

Key Insights
The global Shunt Trip market is poised for robust expansion, demonstrating a market size of approximately USD 1,100 million in 2024, with a projected Compound Annual Growth Rate (CAGR) of 8.5%. This growth trajectory is underpinned by escalating demand for reliable electrical protection and control systems across a spectrum of critical industries. The Power Generation sector, in particular, will continue to be a primary consumer, driven by the ongoing need for robust safety mechanisms in power plants and renewable energy installations. Furthermore, the Oil and Gas and Petrochemical industries, characterized by their inherently hazardous environments, rely heavily on shunt trips for safeguarding equipment and personnel against electrical faults. The Manufacturing sector also presents a significant growth avenue, as automation and industrialization increase the complexity and density of electrical installations, necessitating advanced protective solutions. These drivers collectively paint a picture of a dynamic market where safety, reliability, and operational efficiency are paramount.
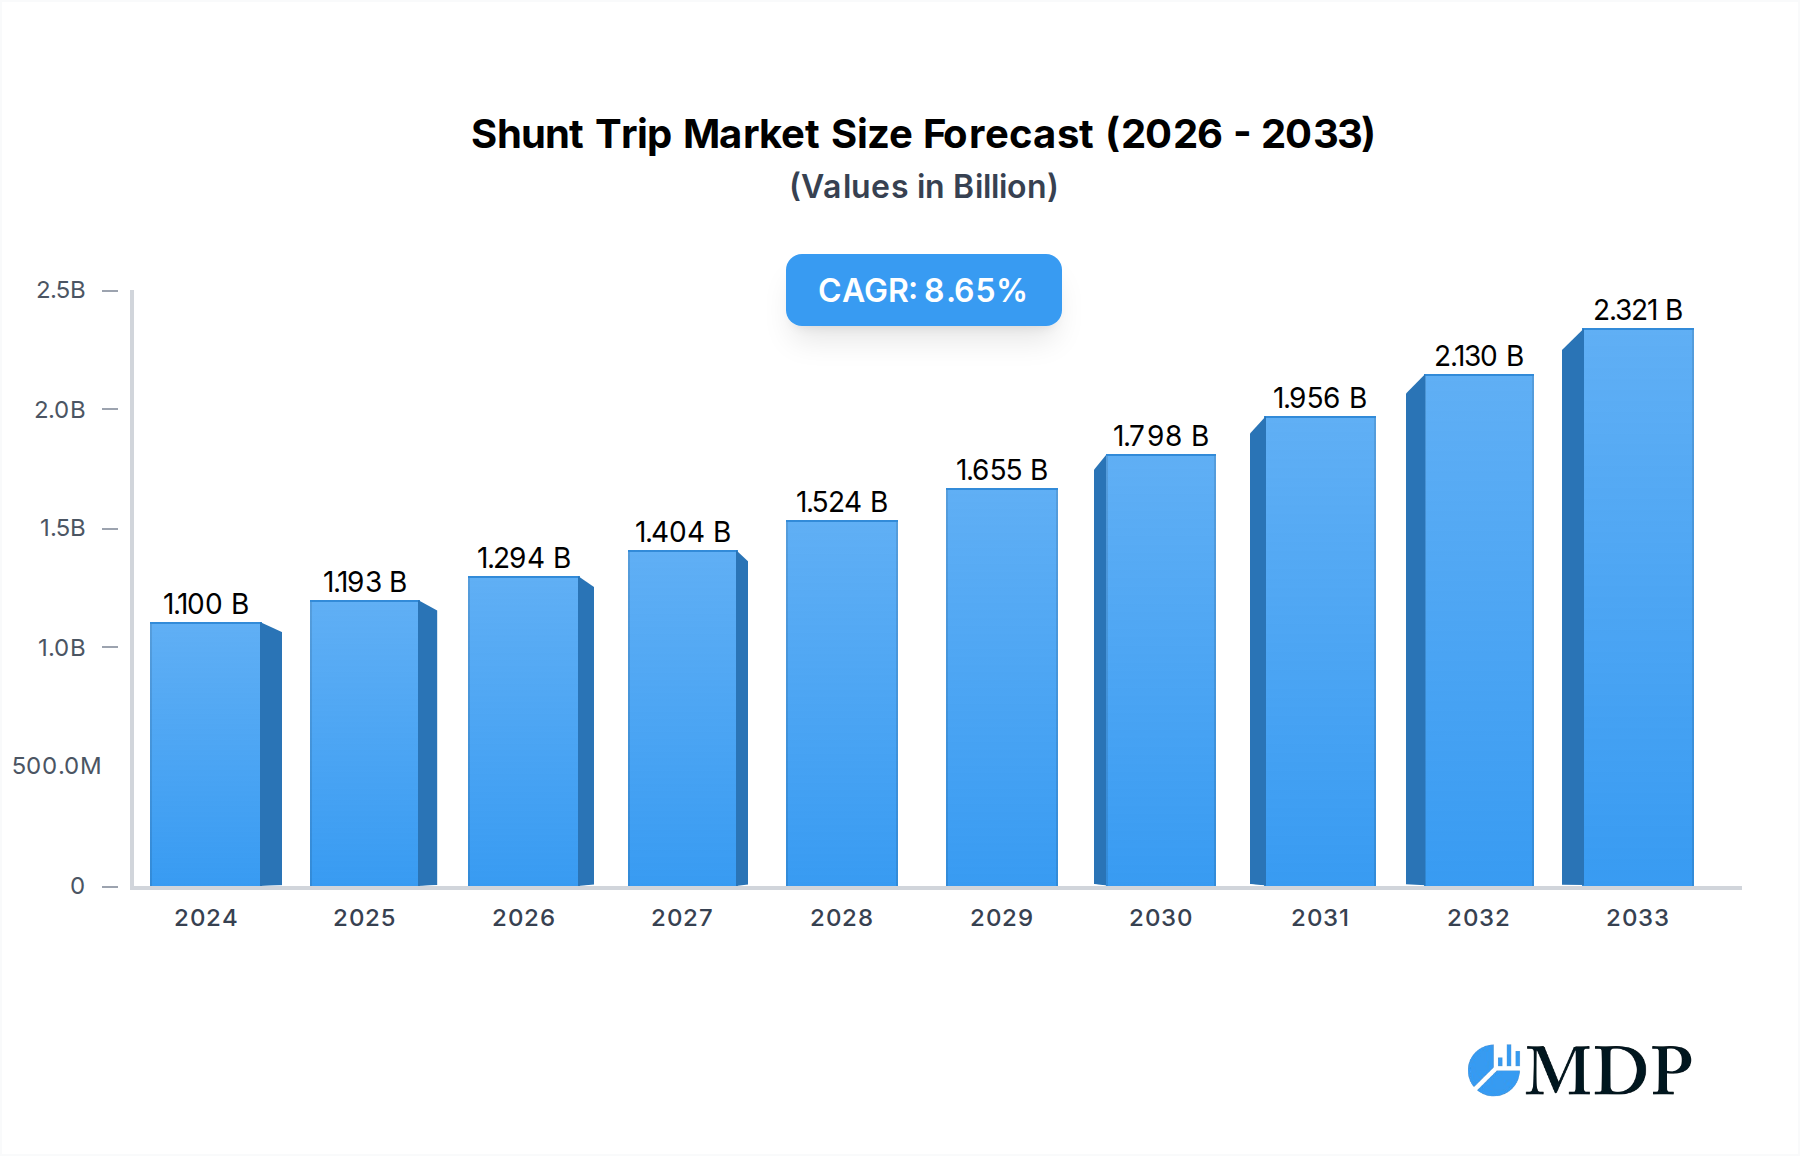
Shunt Trip Market Size (In Billion)
Emerging trends are shaping the Shunt Trip market landscape, with a notable shift towards more sophisticated and integrated solutions. The increasing adoption of smart grid technologies and the Internet of Things (IoT) is fostering the development of shunt trips with enhanced connectivity and remote monitoring capabilities. Electrically-operated shunt trips are expected to gain significant traction due to their precise control and faster response times, catering to the evolving demands of automated industrial processes. While the market is experiencing strong growth, certain restraints such as the initial cost of advanced shunt trip systems and the availability of mature, albeit less sophisticated, alternatives in some price-sensitive regions may pose challenges. However, the overarching emphasis on industrial safety regulations, coupled with continuous technological advancements, is expected to outweigh these restraints, ensuring sustained market momentum. The market is segmented by application into Power Generation, Oil and Gas, Petrochemical, Manufacturing, and Other, and by type into Electrically-operated Shunt Trip, Pneumatically-operated Shunt Trip, and Hydraulic Shunt Trip. Key players like Schneider Electric, ABB, Siemens, and Mitsubishi Electric are at the forefront, driving innovation and catering to a global demand that spans North America, Europe, Asia Pacific, and other key regions.

Shunt Trip Company Market Share
Shunt Trip Market: Global Analysis, Trends, and Forecast (2019-2033)
This comprehensive report offers an in-depth analysis of the global Shunt Trip market, providing critical insights into market dynamics, key trends, leading players, and future growth prospects. Spanning the historical period of 2019-2024, the base year of 2025, and an extensive forecast period from 2025 to 2033, this report is an essential resource for industry stakeholders seeking to understand and capitalize on the evolving Shunt Trip landscape. The study meticulously examines market concentration, innovation drivers, regulatory frameworks, product substitutes, end-user trends, and M&A activities. It further delves into market growth drivers, technological disruptions, consumer preferences, and competitive dynamics. Dominant regions, countries, and segments within applications such as Power Generation, Oil and Gas, Petrochemical, Manufacturing, and Other, as well as types including Electrically-operated Shunt Trip, Pneumatically-operated Shunt Trip, and Hydraulic Shunt Trip, are thoroughly explored. The report also highlights product innovations, strategic outlooks, key drivers, challenges, and emerging opportunities, offering actionable intelligence for strategic decision-making. The global Shunt Trip market is projected to reach $15 billion by 2033, exhibiting a robust Compound Annual Growth Rate (CAGR) of 6.2% during the forecast period.
Shunt Trip Market Dynamics & Concentration
The Shunt Trip market is characterized by a moderate to high concentration, with key players like Schneider Electric, ABB, and Siemens holding significant market shares, estimated to be in the range of 20-25% collectively. Innovation is a primary driver, with ongoing advancements in miniaturization, smart connectivity, and enhanced safety features for shunt trip devices. Regulatory frameworks, particularly concerning electrical safety standards and grid reliability, play a crucial role in shaping market demand and product development. Product substitutes, such as integrated overcurrent protection relays and advanced circuit breaker technologies, pose a competitive challenge, necessitating continuous innovation and cost optimization by shunt trip manufacturers. End-user trends are shifting towards intelligent grid infrastructure, automation in industrial processes, and stringent safety protocols in critical sectors like Oil and Gas and Petrochemical, driving the demand for sophisticated shunt trip solutions. Merger and acquisition (M&A) activities, although moderate, are strategic moves by larger corporations to expand their product portfolios and market reach. For instance, recent M&A deals in the industrial automation sector have seen companies acquiring niche shunt trip manufacturers to bolster their offerings. The estimated number of M&A deals in the last five years is approximately 15, with an average deal value in the range of $50 million to $200 million.
Shunt Trip Industry Trends & Analysis
The Shunt Trip industry is poised for sustained growth, driven by a confluence of factors. The increasing demand for reliable and safe electrical power distribution systems across various sectors is a primary market growth driver. Technological disruptions are at the forefront, with the integration of IoT capabilities and advanced communication protocols enabling remote monitoring, diagnostics, and control of shunt trip devices. This trend is particularly prevalent in smart grid initiatives and the increasing automation of manufacturing facilities, where predictive maintenance and real-time fault detection are paramount. Consumer preferences are evolving towards higher levels of safety, energy efficiency, and interoperability within broader electrical systems. The growing emphasis on industrial safety regulations worldwide is also a significant catalyst, compelling industries to adopt robust protective devices like shunt trips. Competitive dynamics are intensifying, with both established global players and emerging regional manufacturers vying for market share. The market penetration of advanced shunt trip technologies is steadily increasing, from an estimated 45% in 2019 to a projected 70% by 2033. The CAGR of the Shunt Trip market is estimated to be 6.2% between 2025 and 2033, with a projected market size of $15 billion by the end of the forecast period. The increasing adoption of renewable energy sources also necessitates enhanced grid stability and fault protection, further bolstering the demand for shunt trips.
Leading Markets & Segments in Shunt Trip
North America currently dominates the Shunt Trip market, driven by substantial investments in power generation infrastructure, including the expansion of renewable energy projects and the modernization of existing grids. The United States, in particular, exhibits strong demand due to stringent safety regulations and a robust manufacturing sector. Asia Pacific is emerging as a rapidly growing market, fueled by rapid industrialization, increasing urbanization, and significant government initiatives to improve electrical infrastructure in countries like China and India.
Application Segment Dominance:
- Power Generation: This segment holds the largest market share, estimated at 35%, due to the critical need for reliable fault interruption and protection in power plants (conventional and renewable). Key drivers include grid modernization efforts, the integration of distributed energy resources, and the high cost of downtime in power generation facilities.
- Oil and Gas: The inherent hazardous nature of this industry mandates the highest safety standards, making shunt trips essential for preventing electrical fires and explosions. Economic policies promoting energy independence and exploration activities contribute to this segment's sustained demand.
- Petrochemical: Similar to Oil and Gas, the petrochemical industry relies heavily on robust safety mechanisms to protect against electrical faults in volatile environments. Growing global demand for petrochemical products fuels infrastructure development and, consequently, the demand for protective devices.
- Manufacturing: As industrial automation and smart manufacturing (Industry 4.0) gain momentum, the need for reliable and intelligent electrical protection systems, including shunt trips, is escalating. Economic policies supporting domestic manufacturing and technological upgrades further boost this segment.
Type Segment Dominance:
- Electrically-operated Shunt Trip: This type commands the largest market share, estimated at 60%, owing to its versatility, ease of integration with control systems, and widespread application in modern electrical panels and switchgear. Technological advancements in miniaturization and improved response times further solidify its dominance.
- Pneumatically-operated Shunt Trip: While less prevalent than electrically-operated types, pneumatic shunt trips are crucial in specific hazardous environments where electrical signals might be a risk. Their reliability in certain niche applications contributes to their steady demand.
- Hydraulic Shunt Trip: These are primarily used in high-voltage applications and heavy-duty industrial settings requiring robust and reliable tripping mechanisms. Their dominance is more pronounced in specialized sectors within the broader applications.
Shunt Trip Product Developments
The Shunt Trip market is witnessing innovation focused on enhanced safety, miniaturization, and smart functionality. Companies are developing shunt trips with integrated diagnostic capabilities, enabling real-time performance monitoring and predictive maintenance. Advancements in materials science are leading to more durable and compact designs, suitable for space-constrained electrical enclosures. Electrically-operated shunt trips are increasingly incorporating digital communication interfaces, allowing seamless integration with SCADA systems and smart grids. These developments offer distinct competitive advantages by improving reliability, reducing maintenance costs, and enhancing overall system safety in demanding industrial and power infrastructure environments.
Key Drivers of Shunt Trip Growth
The growth of the Shunt Trip market is significantly propelled by several key factors. The increasing global emphasis on electrical safety standards and regulations, particularly in industrial and commercial sectors, mandates the adoption of reliable protective devices. Technological advancements in smart grids and industrial automation are driving the demand for intelligent shunt trip solutions that offer remote monitoring and diagnostics. The expansion of power generation capacity, including renewable energy sources, necessitates enhanced grid stability and fault protection. Furthermore, economic growth and infrastructure development in emerging economies are creating substantial opportunities for shunt trip manufacturers.
Challenges in the Shunt Trip Market
Despite robust growth prospects, the Shunt Trip market faces certain challenges. Stricter environmental regulations concerning the materials used in electrical components can impact manufacturing costs and processes. Intense competition from both established players and new entrants can lead to price pressures. Supply chain disruptions, as witnessed in recent global events, can affect the availability of raw materials and components, leading to production delays and increased costs. Additionally, the growing adoption of alternative, more integrated protection solutions, such as advanced protective relays, presents a competitive challenge that requires continuous product innovation and differentiation.
Emerging Opportunities in Shunt Trip
The Shunt Trip market is ripe with emerging opportunities, primarily driven by technological breakthroughs and strategic market expansion. The ongoing digital transformation of industries, particularly the adoption of Industry 4.0 and the Industrial Internet of Things (IIoT), is creating a demand for smart and connected shunt trip devices with advanced communication capabilities. Strategic partnerships between shunt trip manufacturers and automation solution providers can unlock new market segments and application areas. Furthermore, the increasing focus on grid modernization and the integration of renewable energy sources in developing economies presents significant expansion opportunities for manufacturers willing to invest in these burgeoning markets.
Leading Players in the Shunt Trip Sector
- Schneider Electric
- ABB
- Mitsubishi Electric
- Siemens
- Spark Industries
- WEG
- Emerson
- Tokyo Keiki
- Phoenix Contact
- Steiner Electric
- Toshiba
- Suzhou Future Electrical
- Guoxing Electric Equipment
- Jianbo Electric
- Jingtai Electric
- ALST Electric
Key Milestones in Shunt Trip Industry
- 2019: Introduction of miniaturized shunt trip units with enhanced trip sensitivity by leading manufacturers.
- 2020: Increased focus on smart grid integration, with developments in shunt trips featuring digital communication protocols.
- 2021: Emergence of advanced diagnostic capabilities in shunt trip devices for predictive maintenance.
- 2022: Strategic acquisitions of smaller specialized manufacturers by larger conglomerates to expand product portfolios.
- 2023: Development of shunt trip units with improved energy efficiency and reduced environmental impact.
- 2024: Growing demand for shunt trips in the renewable energy sector to ensure grid stability.
- 2025 (Estimated): Increased adoption of IoT-enabled shunt trip solutions for remote monitoring and control.
- 2026 (Estimated): Further refinement of safety features and compliance with evolving international electrical safety standards.
- 2027 (Estimated): Expansion of shunt trip applications in emerging markets driven by infrastructure development.
- 2028 (Estimated): Integration of AI-powered analytics for enhanced fault prediction in shunt trip systems.
- 2029 (Estimated): Development of highly resilient shunt trip solutions for extreme environmental conditions.
- 2030 (Estimated): Growing demand for customized shunt trip solutions for specialized industrial applications.
- 2031 (Estimated): Advancements in materials leading to more robust and longer-lasting shunt trip devices.
- 2032 (Estimated): Increased focus on cybersecurity for connected shunt trip devices.
- 2033 (Estimated): Ubiquitous integration of shunt trip technology in smart electrical infrastructure globally.
Strategic Outlook for Shunt Trip Market
The strategic outlook for the Shunt Trip market remains exceptionally positive, characterized by sustained growth and evolving technological integration. Key growth accelerators include the relentless drive towards smart grids, increased adoption of renewable energy sources, and stringent global safety mandates. The market is expected to witness a continued surge in demand for electrically-operated shunt trips, particularly those equipped with advanced digital communication and diagnostic features. Manufacturers that focus on innovation, product differentiation, and strategic market expansion, especially in rapidly developing economies, will be well-positioned to capitalize on future opportunities. The emphasis on cybersecurity for connected devices will also become a critical strategic consideration.
Shunt Trip Segmentation
-
1. Application
- 1.1. Power Generation
- 1.2. Oil and Gas
- 1.3. Petrochemical
- 1.4. Manufacturing
- 1.5. Other
-
2. Types
- 2.1. Electrically-operated Shunt Trip
- 2.2. Pneumatically-operated Shunt Trip
- 2.3. Hydraulic Shunt Trip
Shunt Trip Segmentation By Geography
-
1. North America
- 1.1. United States
- 1.2. Canada
- 1.3. Mexico
-
2. South America
- 2.1. Brazil
- 2.2. Argentina
- 2.3. Rest of South America
-
3. Europe
- 3.1. United Kingdom
- 3.2. Germany
- 3.3. France
- 3.4. Italy
- 3.5. Spain
- 3.6. Russia
- 3.7. Benelux
- 3.8. Nordics
- 3.9. Rest of Europe
-
4. Middle East & Africa
- 4.1. Turkey
- 4.2. Israel
- 4.3. GCC
- 4.4. North Africa
- 4.5. South Africa
- 4.6. Rest of Middle East & Africa
-
5. Asia Pacific
- 5.1. China
- 5.2. India
- 5.3. Japan
- 5.4. South Korea
- 5.5. ASEAN
- 5.6. Oceania
- 5.7. Rest of Asia Pacific
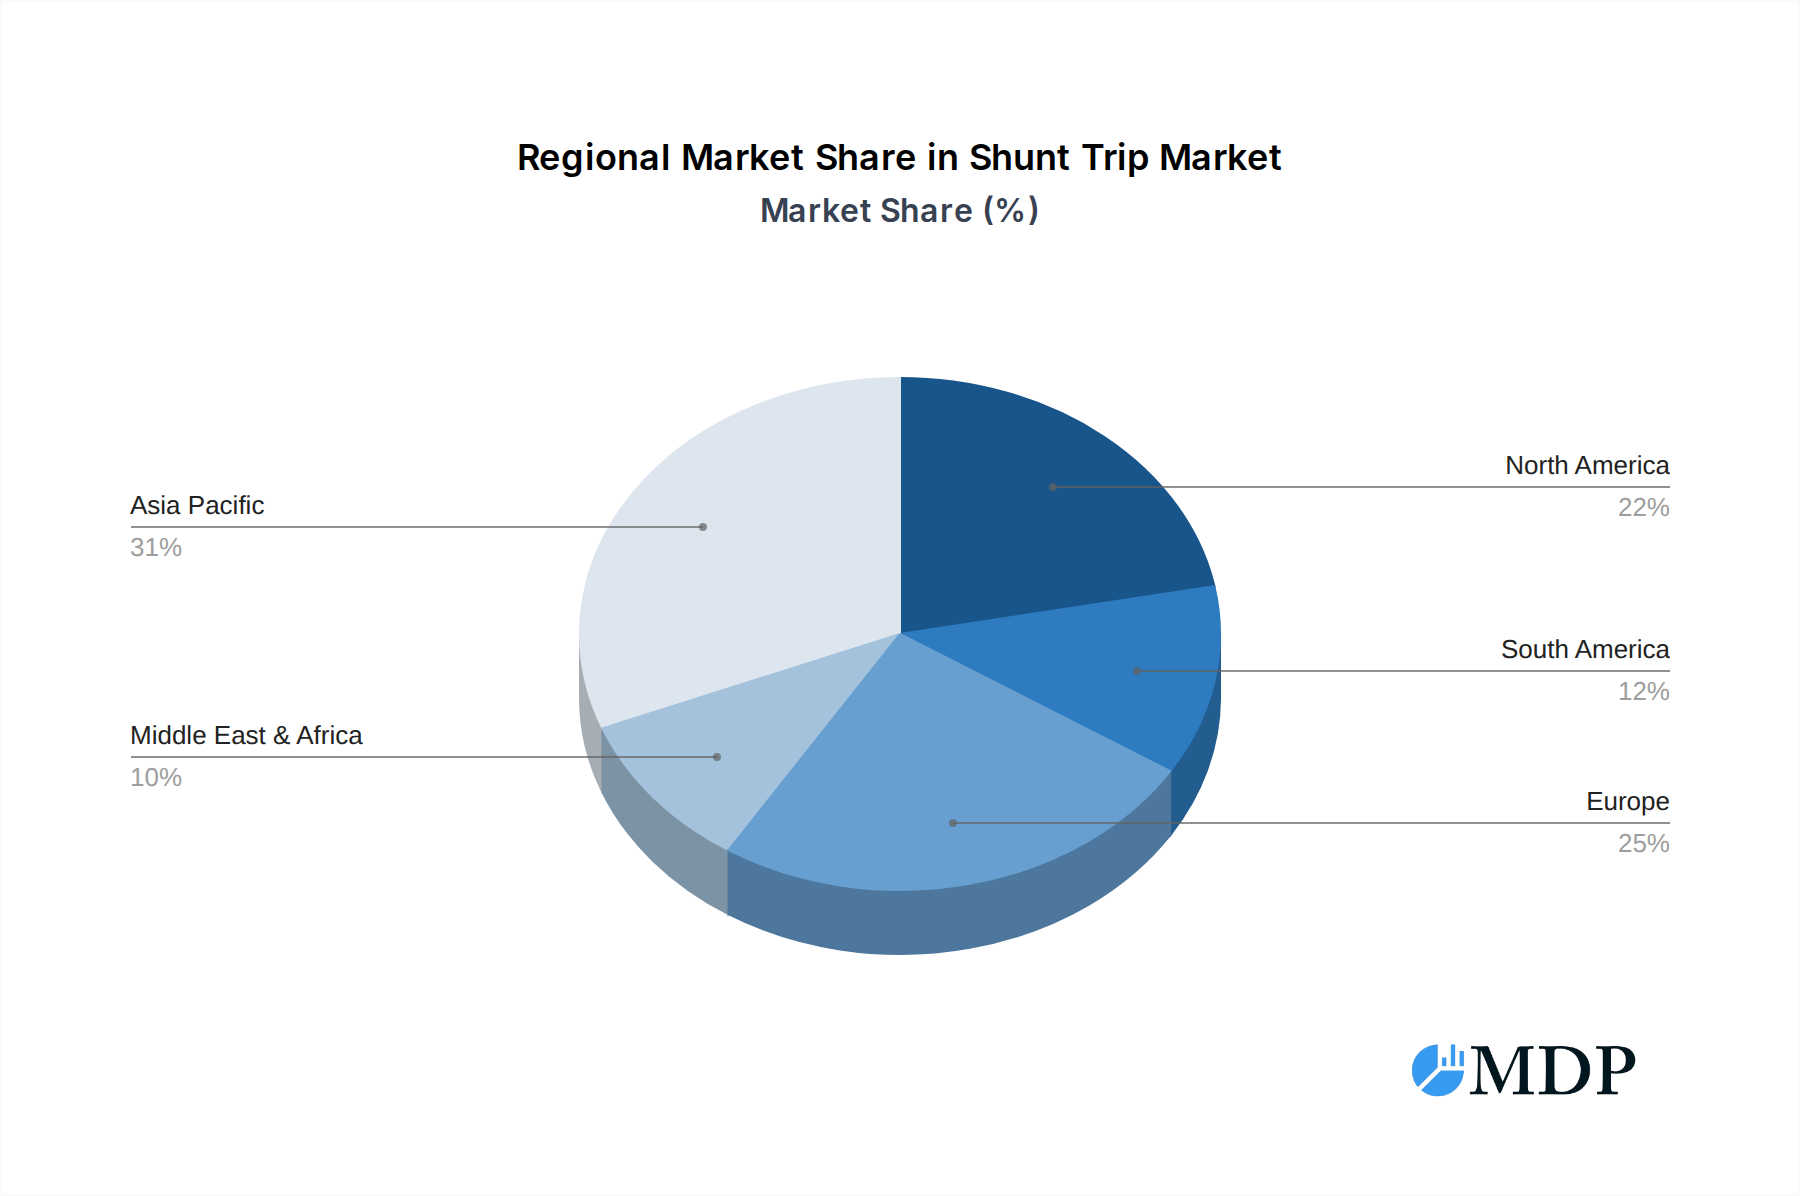
Shunt Trip Regional Market Share
Geographic Coverage of Shunt Trip
Shunt Trip REPORT HIGHLIGHTS
| Aspects | Details |
|---|---|
| Study Period | 2020-2034 |
| Base Year | 2025 |
| Estimated Year | 2026 |
| Forecast Period | 2026-2034 |
| Historical Period | 2020-2025 |
| Growth Rate | CAGR of 8.5% from 2020-2034 |
| Segmentation |
|
Table of Contents
- 1. Introduction
- 1.1. Research Scope
- 1.2. Market Segmentation
- 1.3. Research Methodology
- 1.4. Definitions and Assumptions
- 2. Executive Summary
- 2.1. Introduction
- 3. Market Dynamics
- 3.1. Introduction
- 3.2. Market Drivers
- 3.3. Market Restrains
- 3.4. Market Trends
- 4. Market Factor Analysis
- 4.1. Porters Five Forces
- 4.2. Supply/Value Chain
- 4.3. PESTEL analysis
- 4.4. Market Entropy
- 4.5. Patent/Trademark Analysis
- 5. Global Shunt Trip Analysis, Insights and Forecast, 2020-2032
- 5.1. Market Analysis, Insights and Forecast - by Application
- 5.1.1. Power Generation
- 5.1.2. Oil and Gas
- 5.1.3. Petrochemical
- 5.1.4. Manufacturing
- 5.1.5. Other
- 5.2. Market Analysis, Insights and Forecast - by Types
- 5.2.1. Electrically-operated Shunt Trip
- 5.2.2. Pneumatically-operated Shunt Trip
- 5.2.3. Hydraulic Shunt Trip
- 5.3. Market Analysis, Insights and Forecast - by Region
- 5.3.1. North America
- 5.3.2. South America
- 5.3.3. Europe
- 5.3.4. Middle East & Africa
- 5.3.5. Asia Pacific
- 5.1. Market Analysis, Insights and Forecast - by Application
- 6. North America Shunt Trip Analysis, Insights and Forecast, 2020-2032
- 6.1. Market Analysis, Insights and Forecast - by Application
- 6.1.1. Power Generation
- 6.1.2. Oil and Gas
- 6.1.3. Petrochemical
- 6.1.4. Manufacturing
- 6.1.5. Other
- 6.2. Market Analysis, Insights and Forecast - by Types
- 6.2.1. Electrically-operated Shunt Trip
- 6.2.2. Pneumatically-operated Shunt Trip
- 6.2.3. Hydraulic Shunt Trip
- 6.1. Market Analysis, Insights and Forecast - by Application
- 7. South America Shunt Trip Analysis, Insights and Forecast, 2020-2032
- 7.1. Market Analysis, Insights and Forecast - by Application
- 7.1.1. Power Generation
- 7.1.2. Oil and Gas
- 7.1.3. Petrochemical
- 7.1.4. Manufacturing
- 7.1.5. Other
- 7.2. Market Analysis, Insights and Forecast - by Types
- 7.2.1. Electrically-operated Shunt Trip
- 7.2.2. Pneumatically-operated Shunt Trip
- 7.2.3. Hydraulic Shunt Trip
- 7.1. Market Analysis, Insights and Forecast - by Application
- 8. Europe Shunt Trip Analysis, Insights and Forecast, 2020-2032
- 8.1. Market Analysis, Insights and Forecast - by Application
- 8.1.1. Power Generation
- 8.1.2. Oil and Gas
- 8.1.3. Petrochemical
- 8.1.4. Manufacturing
- 8.1.5. Other
- 8.2. Market Analysis, Insights and Forecast - by Types
- 8.2.1. Electrically-operated Shunt Trip
- 8.2.2. Pneumatically-operated Shunt Trip
- 8.2.3. Hydraulic Shunt Trip
- 8.1. Market Analysis, Insights and Forecast - by Application
- 9. Middle East & Africa Shunt Trip Analysis, Insights and Forecast, 2020-2032
- 9.1. Market Analysis, Insights and Forecast - by Application
- 9.1.1. Power Generation
- 9.1.2. Oil and Gas
- 9.1.3. Petrochemical
- 9.1.4. Manufacturing
- 9.1.5. Other
- 9.2. Market Analysis, Insights and Forecast - by Types
- 9.2.1. Electrically-operated Shunt Trip
- 9.2.2. Pneumatically-operated Shunt Trip
- 9.2.3. Hydraulic Shunt Trip
- 9.1. Market Analysis, Insights and Forecast - by Application
- 10. Asia Pacific Shunt Trip Analysis, Insights and Forecast, 2020-2032
- 10.1. Market Analysis, Insights and Forecast - by Application
- 10.1.1. Power Generation
- 10.1.2. Oil and Gas
- 10.1.3. Petrochemical
- 10.1.4. Manufacturing
- 10.1.5. Other
- 10.2. Market Analysis, Insights and Forecast - by Types
- 10.2.1. Electrically-operated Shunt Trip
- 10.2.2. Pneumatically-operated Shunt Trip
- 10.2.3. Hydraulic Shunt Trip
- 10.1. Market Analysis, Insights and Forecast - by Application
- 11. Competitive Analysis
- 11.1. Global Market Share Analysis 2025
- 11.2. Company Profiles
- 11.2.1 Schneider Electric
- 11.2.1.1. Overview
- 11.2.1.2. Products
- 11.2.1.3. SWOT Analysis
- 11.2.1.4. Recent Developments
- 11.2.1.5. Financials (Based on Availability)
- 11.2.2 ABB
- 11.2.2.1. Overview
- 11.2.2.2. Products
- 11.2.2.3. SWOT Analysis
- 11.2.2.4. Recent Developments
- 11.2.2.5. Financials (Based on Availability)
- 11.2.3 Mitsubishi Electric
- 11.2.3.1. Overview
- 11.2.3.2. Products
- 11.2.3.3. SWOT Analysis
- 11.2.3.4. Recent Developments
- 11.2.3.5. Financials (Based on Availability)
- 11.2.4 Siemens
- 11.2.4.1. Overview
- 11.2.4.2. Products
- 11.2.4.3. SWOT Analysis
- 11.2.4.4. Recent Developments
- 11.2.4.5. Financials (Based on Availability)
- 11.2.5 Spark Industries
- 11.2.5.1. Overview
- 11.2.5.2. Products
- 11.2.5.3. SWOT Analysis
- 11.2.5.4. Recent Developments
- 11.2.5.5. Financials (Based on Availability)
- 11.2.6 WEG
- 11.2.6.1. Overview
- 11.2.6.2. Products
- 11.2.6.3. SWOT Analysis
- 11.2.6.4. Recent Developments
- 11.2.6.5. Financials (Based on Availability)
- 11.2.7 Emerson
- 11.2.7.1. Overview
- 11.2.7.2. Products
- 11.2.7.3. SWOT Analysis
- 11.2.7.4. Recent Developments
- 11.2.7.5. Financials (Based on Availability)
- 11.2.8 Tokyo Keiki
- 11.2.8.1. Overview
- 11.2.8.2. Products
- 11.2.8.3. SWOT Analysis
- 11.2.8.4. Recent Developments
- 11.2.8.5. Financials (Based on Availability)
- 11.2.9 Phoenix Contact
- 11.2.9.1. Overview
- 11.2.9.2. Products
- 11.2.9.3. SWOT Analysis
- 11.2.9.4. Recent Developments
- 11.2.9.5. Financials (Based on Availability)
- 11.2.10 Steiner Electric
- 11.2.10.1. Overview
- 11.2.10.2. Products
- 11.2.10.3. SWOT Analysis
- 11.2.10.4. Recent Developments
- 11.2.10.5. Financials (Based on Availability)
- 11.2.11 Toshiba
- 11.2.11.1. Overview
- 11.2.11.2. Products
- 11.2.11.3. SWOT Analysis
- 11.2.11.4. Recent Developments
- 11.2.11.5. Financials (Based on Availability)
- 11.2.12 Suzhou Future Electrical
- 11.2.12.1. Overview
- 11.2.12.2. Products
- 11.2.12.3. SWOT Analysis
- 11.2.12.4. Recent Developments
- 11.2.12.5. Financials (Based on Availability)
- 11.2.13 Guoxing Electric Equipment
- 11.2.13.1. Overview
- 11.2.13.2. Products
- 11.2.13.3. SWOT Analysis
- 11.2.13.4. Recent Developments
- 11.2.13.5. Financials (Based on Availability)
- 11.2.14 Jianbo Electric
- 11.2.14.1. Overview
- 11.2.14.2. Products
- 11.2.14.3. SWOT Analysis
- 11.2.14.4. Recent Developments
- 11.2.14.5. Financials (Based on Availability)
- 11.2.15 Jingtai Electric
- 11.2.15.1. Overview
- 11.2.15.2. Products
- 11.2.15.3. SWOT Analysis
- 11.2.15.4. Recent Developments
- 11.2.15.5. Financials (Based on Availability)
- 11.2.16 ALST Electric
- 11.2.16.1. Overview
- 11.2.16.2. Products
- 11.2.16.3. SWOT Analysis
- 11.2.16.4. Recent Developments
- 11.2.16.5. Financials (Based on Availability)
- 11.2.1 Schneider Electric
List of Figures
- Figure 1: Global Shunt Trip Revenue Breakdown (billion, %) by Region 2025 & 2033
- Figure 2: North America Shunt Trip Revenue (billion), by Application 2025 & 2033
- Figure 3: North America Shunt Trip Revenue Share (%), by Application 2025 & 2033
- Figure 4: North America Shunt Trip Revenue (billion), by Types 2025 & 2033
- Figure 5: North America Shunt Trip Revenue Share (%), by Types 2025 & 2033
- Figure 6: North America Shunt Trip Revenue (billion), by Country 2025 & 2033
- Figure 7: North America Shunt Trip Revenue Share (%), by Country 2025 & 2033
- Figure 8: South America Shunt Trip Revenue (billion), by Application 2025 & 2033
- Figure 9: South America Shunt Trip Revenue Share (%), by Application 2025 & 2033
- Figure 10: South America Shunt Trip Revenue (billion), by Types 2025 & 2033
- Figure 11: South America Shunt Trip Revenue Share (%), by Types 2025 & 2033
- Figure 12: South America Shunt Trip Revenue (billion), by Country 2025 & 2033
- Figure 13: South America Shunt Trip Revenue Share (%), by Country 2025 & 2033
- Figure 14: Europe Shunt Trip Revenue (billion), by Application 2025 & 2033
- Figure 15: Europe Shunt Trip Revenue Share (%), by Application 2025 & 2033
- Figure 16: Europe Shunt Trip Revenue (billion), by Types 2025 & 2033
- Figure 17: Europe Shunt Trip Revenue Share (%), by Types 2025 & 2033
- Figure 18: Europe Shunt Trip Revenue (billion), by Country 2025 & 2033
- Figure 19: Europe Shunt Trip Revenue Share (%), by Country 2025 & 2033
- Figure 20: Middle East & Africa Shunt Trip Revenue (billion), by Application 2025 & 2033
- Figure 21: Middle East & Africa Shunt Trip Revenue Share (%), by Application 2025 & 2033
- Figure 22: Middle East & Africa Shunt Trip Revenue (billion), by Types 2025 & 2033
- Figure 23: Middle East & Africa Shunt Trip Revenue Share (%), by Types 2025 & 2033
- Figure 24: Middle East & Africa Shunt Trip Revenue (billion), by Country 2025 & 2033
- Figure 25: Middle East & Africa Shunt Trip Revenue Share (%), by Country 2025 & 2033
- Figure 26: Asia Pacific Shunt Trip Revenue (billion), by Application 2025 & 2033
- Figure 27: Asia Pacific Shunt Trip Revenue Share (%), by Application 2025 & 2033
- Figure 28: Asia Pacific Shunt Trip Revenue (billion), by Types 2025 & 2033
- Figure 29: Asia Pacific Shunt Trip Revenue Share (%), by Types 2025 & 2033
- Figure 30: Asia Pacific Shunt Trip Revenue (billion), by Country 2025 & 2033
- Figure 31: Asia Pacific Shunt Trip Revenue Share (%), by Country 2025 & 2033
List of Tables
- Table 1: Global Shunt Trip Revenue billion Forecast, by Application 2020 & 2033
- Table 2: Global Shunt Trip Revenue billion Forecast, by Types 2020 & 2033
- Table 3: Global Shunt Trip Revenue billion Forecast, by Region 2020 & 2033
- Table 4: Global Shunt Trip Revenue billion Forecast, by Application 2020 & 2033
- Table 5: Global Shunt Trip Revenue billion Forecast, by Types 2020 & 2033
- Table 6: Global Shunt Trip Revenue billion Forecast, by Country 2020 & 2033
- Table 7: United States Shunt Trip Revenue (billion) Forecast, by Application 2020 & 2033
- Table 8: Canada Shunt Trip Revenue (billion) Forecast, by Application 2020 & 2033
- Table 9: Mexico Shunt Trip Revenue (billion) Forecast, by Application 2020 & 2033
- Table 10: Global Shunt Trip Revenue billion Forecast, by Application 2020 & 2033
- Table 11: Global Shunt Trip Revenue billion Forecast, by Types 2020 & 2033
- Table 12: Global Shunt Trip Revenue billion Forecast, by Country 2020 & 2033
- Table 13: Brazil Shunt Trip Revenue (billion) Forecast, by Application 2020 & 2033
- Table 14: Argentina Shunt Trip Revenue (billion) Forecast, by Application 2020 & 2033
- Table 15: Rest of South America Shunt Trip Revenue (billion) Forecast, by Application 2020 & 2033
- Table 16: Global Shunt Trip Revenue billion Forecast, by Application 2020 & 2033
- Table 17: Global Shunt Trip Revenue billion Forecast, by Types 2020 & 2033
- Table 18: Global Shunt Trip Revenue billion Forecast, by Country 2020 & 2033
- Table 19: United Kingdom Shunt Trip Revenue (billion) Forecast, by Application 2020 & 2033
- Table 20: Germany Shunt Trip Revenue (billion) Forecast, by Application 2020 & 2033
- Table 21: France Shunt Trip Revenue (billion) Forecast, by Application 2020 & 2033
- Table 22: Italy Shunt Trip Revenue (billion) Forecast, by Application 2020 & 2033
- Table 23: Spain Shunt Trip Revenue (billion) Forecast, by Application 2020 & 2033
- Table 24: Russia Shunt Trip Revenue (billion) Forecast, by Application 2020 & 2033
- Table 25: Benelux Shunt Trip Revenue (billion) Forecast, by Application 2020 & 2033
- Table 26: Nordics Shunt Trip Revenue (billion) Forecast, by Application 2020 & 2033
- Table 27: Rest of Europe Shunt Trip Revenue (billion) Forecast, by Application 2020 & 2033
- Table 28: Global Shunt Trip Revenue billion Forecast, by Application 2020 & 2033
- Table 29: Global Shunt Trip Revenue billion Forecast, by Types 2020 & 2033
- Table 30: Global Shunt Trip Revenue billion Forecast, by Country 2020 & 2033
- Table 31: Turkey Shunt Trip Revenue (billion) Forecast, by Application 2020 & 2033
- Table 32: Israel Shunt Trip Revenue (billion) Forecast, by Application 2020 & 2033
- Table 33: GCC Shunt Trip Revenue (billion) Forecast, by Application 2020 & 2033
- Table 34: North Africa Shunt Trip Revenue (billion) Forecast, by Application 2020 & 2033
- Table 35: South Africa Shunt Trip Revenue (billion) Forecast, by Application 2020 & 2033
- Table 36: Rest of Middle East & Africa Shunt Trip Revenue (billion) Forecast, by Application 2020 & 2033
- Table 37: Global Shunt Trip Revenue billion Forecast, by Application 2020 & 2033
- Table 38: Global Shunt Trip Revenue billion Forecast, by Types 2020 & 2033
- Table 39: Global Shunt Trip Revenue billion Forecast, by Country 2020 & 2033
- Table 40: China Shunt Trip Revenue (billion) Forecast, by Application 2020 & 2033
- Table 41: India Shunt Trip Revenue (billion) Forecast, by Application 2020 & 2033
- Table 42: Japan Shunt Trip Revenue (billion) Forecast, by Application 2020 & 2033
- Table 43: South Korea Shunt Trip Revenue (billion) Forecast, by Application 2020 & 2033
- Table 44: ASEAN Shunt Trip Revenue (billion) Forecast, by Application 2020 & 2033
- Table 45: Oceania Shunt Trip Revenue (billion) Forecast, by Application 2020 & 2033
- Table 46: Rest of Asia Pacific Shunt Trip Revenue (billion) Forecast, by Application 2020 & 2033
Frequently Asked Questions
1. What is the projected Compound Annual Growth Rate (CAGR) of the Shunt Trip?
The projected CAGR is approximately 8.5%.
2. Which companies are prominent players in the Shunt Trip?
Key companies in the market include Schneider Electric, ABB, Mitsubishi Electric, Siemens, Spark Industries, WEG, Emerson, Tokyo Keiki, Phoenix Contact, Steiner Electric, Toshiba, Suzhou Future Electrical, Guoxing Electric Equipment, Jianbo Electric, Jingtai Electric, ALST Electric.
3. What are the main segments of the Shunt Trip?
The market segments include Application, Types.
4. Can you provide details about the market size?
The market size is estimated to be USD 1.1 billion as of 2022.
5. What are some drivers contributing to market growth?
N/A
6. What are the notable trends driving market growth?
N/A
7. Are there any restraints impacting market growth?
N/A
8. Can you provide examples of recent developments in the market?
N/A
9. What pricing options are available for accessing the report?
Pricing options include single-user, multi-user, and enterprise licenses priced at USD 2900.00, USD 4350.00, and USD 5800.00 respectively.
10. Is the market size provided in terms of value or volume?
The market size is provided in terms of value, measured in billion.
11. Are there any specific market keywords associated with the report?
Yes, the market keyword associated with the report is "Shunt Trip," which aids in identifying and referencing the specific market segment covered.
12. How do I determine which pricing option suits my needs best?
The pricing options vary based on user requirements and access needs. Individual users may opt for single-user licenses, while businesses requiring broader access may choose multi-user or enterprise licenses for cost-effective access to the report.
13. Are there any additional resources or data provided in the Shunt Trip report?
While the report offers comprehensive insights, it's advisable to review the specific contents or supplementary materials provided to ascertain if additional resources or data are available.
14. How can I stay updated on further developments or reports in the Shunt Trip?
To stay informed about further developments, trends, and reports in the Shunt Trip, consider subscribing to industry newsletters, following relevant companies and organizations, or regularly checking reputable industry news sources and publications.
Methodology
Step 1 - Identification of Relevant Samples Size from Population Database


Step 2 - Approaches for Defining Global Market Size (Value, Volume* & Price*)

Note*: In applicable scenarios
Step 3 - Data Sources
Primary Research
- Web Analytics
- Survey Reports
- Research Institute
- Latest Research Reports
- Opinion Leaders
Secondary Research
- Annual Reports
- White Paper
- Latest Press Release
- Industry Association
- Paid Database
- Investor Presentations

Step 4 - Data Triangulation
Involves using different sources of information in order to increase the validity of a study
These sources are likely to be stakeholders in a program - participants, other researchers, program staff, other community members, and so on.
Then we put all data in single framework & apply various statistical tools to find out the dynamic on the market.
During the analysis stage, feedback from the stakeholder groups would be compared to determine areas of agreement as well as areas of divergence