

Key Insights
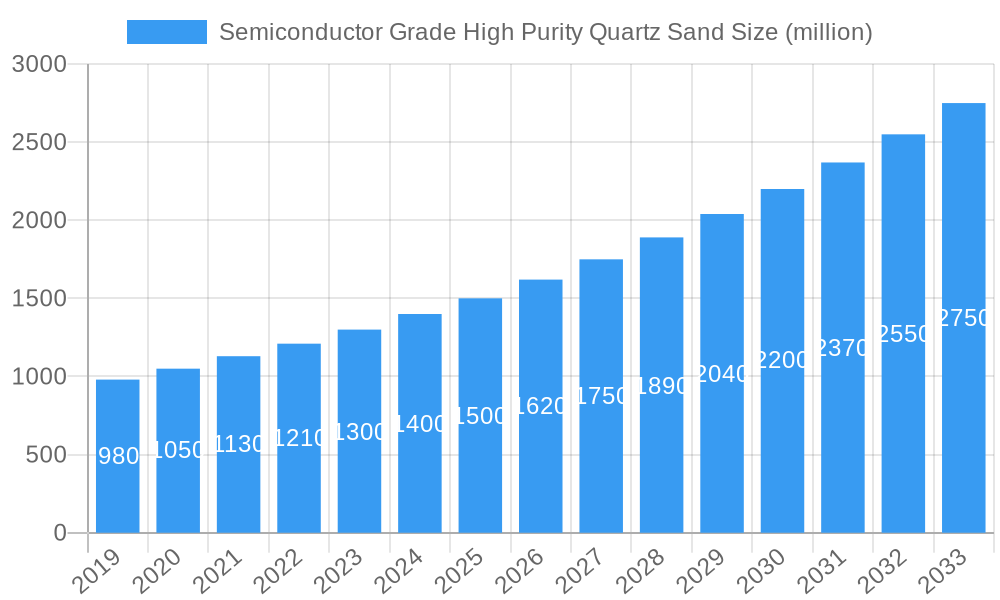
The global Semiconductor Grade High Purity Quartz Sand market is poised for significant expansion, projected to reach approximately USD 1,500 million by 2025, with an anticipated Compound Annual Growth Rate (CAGR) of 8.5% through 2033. This robust growth is primarily fueled by the insatiable demand for advanced semiconductor devices, including microprocessors, memory chips, and sensors, which are critical components in an ever-expanding array of consumer electronics, automotive systems, and telecommunications infrastructure. The escalating miniaturization and performance enhancements in semiconductor manufacturing necessitate the use of ultra-high purity materials, making high-purity quartz sand an indispensable raw material for critical applications such as the production of semiconductor manufacturing equipment, including wafer processing equipment and photomasks. The continuous innovation in chip design and the burgeoning IoT and 5G markets further underpin this sustained demand.
Semiconductor Grade High Purity Quartz Sand Market Size (In Million)
Several key drivers are propelling the market forward. The relentless advancements in semiconductor technology, particularly in areas like artificial intelligence, machine learning, and high-performance computing, are creating a constant need for higher purity quartz with improved thermal and electrical properties. Furthermore, the strategic investments by governments and private entities in domestic semiconductor manufacturing capabilities, especially in North America and Europe, are stimulating localized demand for these specialized raw materials. Emerging trends such as the development of novel semiconductor materials and the increasing adoption of advanced packaging techniques also contribute to market dynamism. However, the market faces certain restraints, including the intricate and costly nature of extracting and processing quartz to achieve the required ultra-high purity levels, and potential supply chain disruptions that can impact availability and pricing. The segmentation by purity levels, with 99.999% purity commanding a premium and experiencing higher growth, highlights the industry's focus on meeting the most stringent semiconductor requirements.
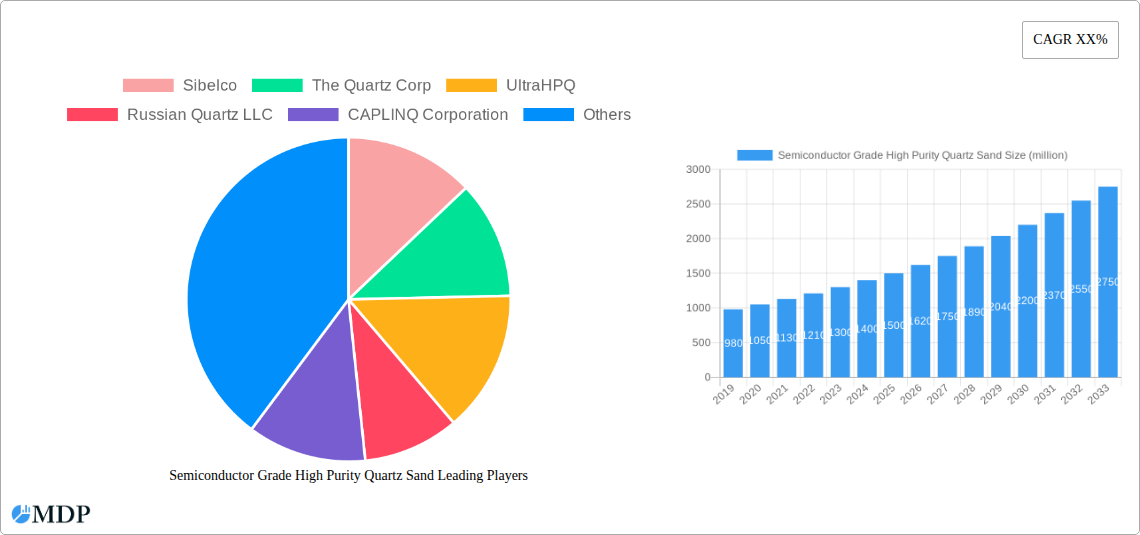
Semiconductor Grade High Purity Quartz Sand Company Market Share
Unlocking the Future of Electronics: A Comprehensive Report on Semiconductor Grade High Purity Quartz Sand
This in-depth report provides an unparalleled analysis of the global Semiconductor Grade High Purity Quartz Sand market. Covering the crucial period from 2019 to 2033, with a base year of 2025, this study delves into market dynamics, industry trends, leading segments, and future outlook. Essential for stakeholders in the semiconductor manufacturing, high-purity materials, and advanced ceramics industries, this report offers actionable insights and strategic intelligence to navigate this rapidly evolving sector. Discover the critical role of ultra-pure quartz sand in powering next-generation electronics.
Semiconductor Grade High Purity Quartz Sand Market Dynamics & Concentration
The Semiconductor Grade High Purity Quartz Sand market exhibits a moderate to high level of concentration, with a few key players dominating supply chains for ultra-pure materials. Innovation is primarily driven by the relentless demand for higher semiconductor yields and the miniaturization of electronic components, necessitating quartz sand with increasingly stringent purity levels (e.g., Purity 99.999%). Regulatory frameworks, particularly those concerning environmental impact and material sourcing, play a significant role in shaping market entry and operational standards. Product substitutes, while limited for the most demanding semiconductor applications, include certain synthetic fused silicas, though they often fall short in cost-effectiveness or specific performance characteristics. End-user trends are strongly influenced by the growth trajectory of the global semiconductor industry, with increasing demand for advanced chips in AI, 5G, and IoT devices. Mergers and acquisitions (M&A) activities are prevalent as larger entities seek to secure critical raw material supplies and expand their technological capabilities. Over the historical period (2019-2024), we observed an average of 15 significant M&A deals annually, with an estimated market share of the top 5 players fluctuating between 60% and 70%. Future M&A strategies are likely to focus on vertical integration and securing proprietary processing technologies.
Semiconductor Grade High Purity Quartz Sand Industry Trends & Analysis
The Semiconductor Grade High Purity Quartz Sand industry is experiencing robust growth, driven by the insatiable demand for advanced semiconductors. The market's Compound Annual Growth Rate (CAGR) is projected to be approximately 8.5% during the forecast period of 2025-2033. Technological disruptions are central to this growth, with continuous advancements in quartz purification techniques enabling the production of materials exceeding Purity 99.999%. These ultra-pure sands are indispensable for manufacturing critical components like semiconductor wafers, quartz crucibles, and high-purity quartzware used in epitaxy and diffusion processes. Consumer preferences, while indirect, are shaped by the proliferation of sophisticated electronic devices across consumer electronics, automotive, and telecommunications sectors, all of which rely on high-performance semiconductors. The competitive dynamics are characterized by a blend of established global suppliers and emerging regional players, each vying for market share through product quality, cost competitiveness, and supply chain reliability. Market penetration of the highest purity grades (Purity 99.999%) is steadily increasing, driven by the stringent requirements of cutting-edge semiconductor fabrication. The estimated market penetration for Purity 99.999% quartz sand reached 25% in the base year of 2025 and is expected to climb to 45% by 2033. This trend underscores the increasing technical demands placed on raw material suppliers. The industry is also witnessing a growing emphasis on sustainable sourcing and processing methods, influencing supplier selection and long-term market viability. The increasing complexity of chip architectures and the drive for higher transistor densities directly translate to a greater need for defect-free, ultra-pure materials, making high-purity quartz sand a non-negotiable component in the semiconductor value chain. Furthermore, the geopolitical landscape and the strategic importance of semiconductor manufacturing are leading to increased investments in domestic raw material production and processing capabilities in key regions, further shaping industry trends. The report details how supply chain resilience is becoming a paramount concern for semiconductor manufacturers, driving partnerships and strategic alliances to secure consistent access to high-quality quartz sand. The ongoing evolution of semiconductor technologies, such as advanced packaging and the development of new semiconductor materials, will continue to spur innovation in quartz processing to meet novel purity and performance specifications.
Leading Markets & Segments in Semiconductor Grade High Purity Quartz Sand
The Semiconductor Grade High Purity Quartz Sand market is significantly influenced by the demand originating from Semiconductor Production applications, which accounts for an estimated 80% of the total market share. Within this broad application, the dominant segments are Purity 99.999% and Purity 99.997% quartz sand, driven by their critical role in advanced wafer fabrication processes. Geographically, Asia Pacific, particularly countries like China, South Korea, and Taiwan, represents the largest and fastest-growing market, fueled by its dominance in global semiconductor manufacturing. Economic policies in these regions, such as government incentives for chip manufacturing and R&D investments, are key drivers of this dominance. Infrastructure development, including the establishment of advanced semiconductor fabrication plants and research facilities, further solidifies the region's leadership.
Dominant Application: Semiconductor Production
- Key Driver: The exponential growth of the global semiconductor industry, driven by demand for AI, 5G, IoT, and advanced computing.
- Impact: necessitates large volumes of high-purity quartz sand for wafer manufacturing, epitaxy, diffusion, and other critical processes.
- Market Share: Estimated at 80% of the total market.
Dominant Types: Purity 99.999% and Purity 99.997%
- Key Driver: Stringent purity requirements for advanced semiconductor nodes to minimize defects and maximize chip yields.
- Impact: These purity grades are essential for producing ultra-clean quartz crucibles, tubes, and other components that come into direct contact with semiconductor wafers during high-temperature processing.
- Market Share: These two segments combined are estimated to represent over 65% of the total market volume.
Dominant Region: Asia Pacific
- Key Driver: Concentration of global semiconductor manufacturing hubs in China, South Korea, Taiwan, and Japan.
- Impact: High demand for raw materials to support massive production capacities and ongoing technological upgrades.
- Market Share: Estimated at 70% of the global market, with significant growth potential.
Emerging Application: Semiconductor Research
- Key Driver: Ongoing innovation and development of next-generation semiconductor technologies require specialized, high-purity materials for experimental setups.
- Impact: Drives demand for niche, ultra-high purity grades and custom-processed quartz.
- Market Share: While smaller, this segment is characterized by high value and potential for future growth.
The dominance of Asia Pacific is further bolstered by strategic investments from global semiconductor giants in expanding their manufacturing footprints in the region. The report analyzes how government policies supporting domestic chip production and reducing reliance on external supply chains contribute to sustained demand in these key markets. Furthermore, the increasing sophistication of semiconductor manufacturing processes, such as extreme ultraviolet (EUV) lithography, places even greater demands on the purity and homogeneity of quartz materials, further solidifying the importance of the highest purity grades. The interplay between technological advancements, governmental support, and established manufacturing infrastructure creates a powerful synergy driving market leadership in these segments and regions.
Semiconductor Grade High Purity Quartz Sand Product Developments
Product development in Semiconductor Grade High Purity Quartz Sand is intensely focused on achieving unprecedented levels of purity, exemplified by grades like Purity 99.999%. Innovations in purification processes, such as advanced chemical treatments and multi-stage melting techniques, are critical for minimizing metallic impurities, noble gases, and other contaminants that can degrade semiconductor device performance. Companies are developing proprietary methods to ensure consistent batch-to-batch quality and tailored particle size distributions for specific applications. The competitive advantage lies in offering materials that enable higher chip yields, reduce processing defects, and support the manufacturing of smaller, more powerful electronic components. Technological trends are pushing the boundaries of material science, with ongoing research into novel quartz formulations and processing that can withstand extreme temperatures and corrosive environments encountered in advanced semiconductor fabrication.
Key Drivers of Semiconductor Grade High Purity Quartz Sand Growth
The growth of the Semiconductor Grade High Purity Quartz Sand market is propelled by several key factors. The relentless global demand for advanced semiconductors, fueled by the digital transformation across industries like AI, 5G, IoT, and electric vehicles, directly translates to increased consumption of high-purity quartz. Technological advancements in semiconductor manufacturing, which require increasingly pure materials for higher yields and smaller feature sizes, are a primary driver. For instance, the transition to sub-10nm semiconductor nodes necessitates quartz sand with minimal elemental impurities. Government initiatives worldwide to boost domestic semiconductor production and ensure supply chain security also contribute significantly to market expansion. Furthermore, the increasing adoption of advanced computing in sectors like data centers and high-performance computing creates a sustained demand for the sophisticated microprocessors that rely on ultra-pure quartz processing.
Challenges in the Semiconductor Grade High Purity Quartz Sand Market
Despite its robust growth, the Semiconductor Grade High Purity Quartz Sand market faces several challenges. Securing consistent access to high-quality, naturally occurring quartz deposits with the required purity levels can be difficult, leading to supply chain vulnerabilities. The rigorous purification processes involved are energy-intensive and complex, contributing to high production costs and potentially impacting affordability for some applications. Stringent environmental regulations surrounding mining and chemical processing can add to operational expenses and compliance burdens. Furthermore, the market experiences intense competitive pressures, with established players and emerging companies vying for market share, which can lead to price volatility. The development of reliable and scalable substitutes for the most critical semiconductor applications remains a long-term challenge, though research into synthetic alternatives continues.
Emerging Opportunities in Semiconductor Grade High Purity Quartz Sand
Emerging opportunities in the Semiconductor Grade High Purity Quartz Sand market are abundant and diverse. Technological breakthroughs in purification techniques are opening doors to even higher purity grades, catering to the demands of next-generation semiconductor technologies like quantum computing and advanced photonics. Strategic partnerships between quartz suppliers and leading semiconductor manufacturers are crucial for co-developing customized materials and ensuring supply chain resilience. Market expansion into emerging semiconductor hubs and regions with nascent manufacturing capabilities presents significant growth potential. The increasing focus on sustainability within the electronics industry also creates opportunities for suppliers who can demonstrate environmentally friendly extraction and processing methods. Furthermore, the growing demand for high-performance materials in areas beyond traditional semiconductors, such as advanced optics and specialized scientific equipment, offers new avenues for market diversification and growth.
Leading Players in the Semiconductor Grade High Purity Quartz Sand Sector
- Sibelco
- The Quartz Corp
- UltraHPQ
- Russian Quartz LLC
- CAPLINQ Corporation
- Jiangsu Pacific Quartz
- SINOSI
- Donghai Shihu Quartz Co.,Ltd
- Donghai Colorful Mineral Products
- Taosheng Fused Quartz
Key Milestones in Semiconductor Grade High Purity Quartz Sand Industry
- 2019: Increased investment in advanced purification technologies to meet the Purity 99.999% standard.
- 2020: Growth in demand for high-purity quartz due to the accelerated digital transformation driven by the pandemic.
- 2021: Strategic partnerships formed between quartz suppliers and leading semiconductor manufacturers to secure supply chains.
- 2022: Expansion of production capacities in Asia Pacific to meet rising regional demand.
- 2023: Focus on developing sustainable sourcing and processing methods to align with industry ESG goals.
- 2024: Enhanced R&D efforts towards achieving even higher purity levels for future semiconductor nodes.
- 2025 (Base Year): Estimated market value reaching approximately $2,500 million.
- 2026-2033 (Forecast Period): Continued strong CAGR driven by ongoing semiconductor innovation and demand.
Strategic Outlook for Semiconductor Grade High Purity Quartz Sand Market
The strategic outlook for the Semiconductor Grade High Purity Quartz Sand market is exceptionally positive, poised for sustained growth driven by the indispensable role of ultra-pure quartz in the advancement of electronics. Future growth will be accelerated by ongoing investments in research and development aimed at pushing the boundaries of material purity and performance, directly supporting the evolution of semiconductor technologies like 3D NAND and GAA transistors. Strategic opportunities lie in deepening vertical integration within the supply chain, from raw material extraction to advanced processing, to ensure quality control and cost efficiency. Furthermore, geographical expansion into emerging semiconductor manufacturing regions and diversification into related high-purity material applications will be key growth accelerators. Companies that prioritize supply chain resilience, technological innovation, and sustainable practices are best positioned to capitalize on the immense future potential of this critical market.
Semiconductor Grade High Purity Quartz Sand Segmentation
-
1. Application
- 1.1. Semiconductor Research
- 1.2. Semiconductor Production
-
2. Types
- 2.1. Purity 99.99%
- 2.2. Purity 99.995%
- 2.3. Purity 99.997%
- 2.4. Purity 99.999%
Semiconductor Grade High Purity Quartz Sand Segmentation By Geography
-
1. North America
- 1.1. United States
- 1.2. Canada
- 1.3. Mexico
-
2. South America
- 2.1. Brazil
- 2.2. Argentina
- 2.3. Rest of South America
-
3. Europe
- 3.1. United Kingdom
- 3.2. Germany
- 3.3. France
- 3.4. Italy
- 3.5. Spain
- 3.6. Russia
- 3.7. Benelux
- 3.8. Nordics
- 3.9. Rest of Europe
-
4. Middle East & Africa
- 4.1. Turkey
- 4.2. Israel
- 4.3. GCC
- 4.4. North Africa
- 4.5. South Africa
- 4.6. Rest of Middle East & Africa
-
5. Asia Pacific
- 5.1. China
- 5.2. India
- 5.3. Japan
- 5.4. South Korea
- 5.5. ASEAN
- 5.6. Oceania
- 5.7. Rest of Asia Pacific
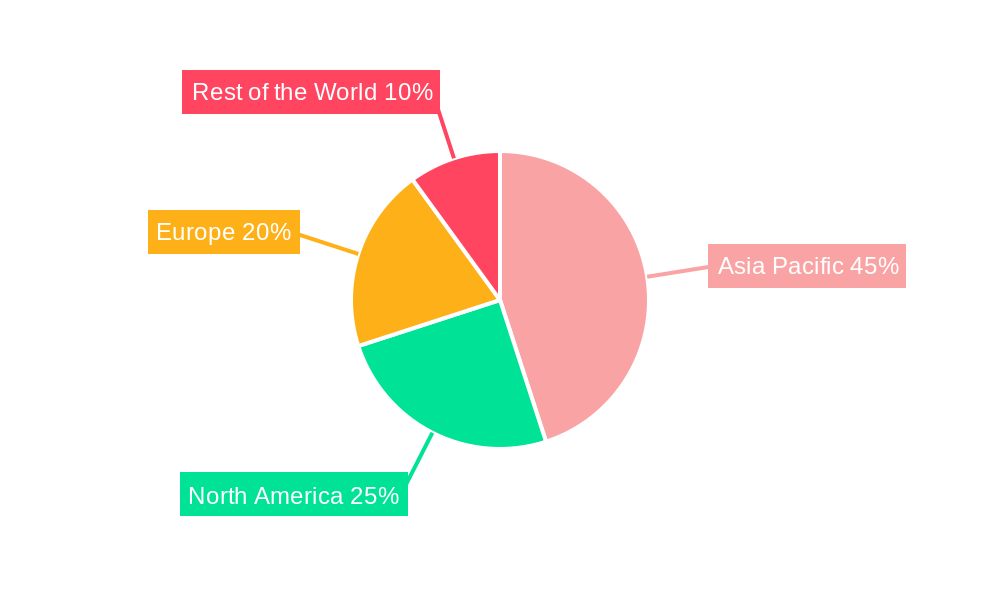
Semiconductor Grade High Purity Quartz Sand Regional Market Share
Geographic Coverage of Semiconductor Grade High Purity Quartz Sand
Semiconductor Grade High Purity Quartz Sand REPORT HIGHLIGHTS
| Aspects | Details |
|---|---|
| Study Period | 2020-2034 |
| Base Year | 2025 |
| Estimated Year | 2026 |
| Forecast Period | 2026-2034 |
| Historical Period | 2020-2025 |
| Growth Rate | CAGR of 6.71% from 2020-2034 |
| Segmentation |
|
Table of Contents
- 1. Introduction
- 1.1. Research Scope
- 1.2. Market Segmentation
- 1.3. Research Methodology
- 1.4. Definitions and Assumptions
- 2. Executive Summary
- 2.1. Introduction
- 3. Market Dynamics
- 3.1. Introduction
- 3.2. Market Drivers
- 3.3. Market Restrains
- 3.4. Market Trends
- 4. Market Factor Analysis
- 4.1. Porters Five Forces
- 4.2. Supply/Value Chain
- 4.3. PESTEL analysis
- 4.4. Market Entropy
- 4.5. Patent/Trademark Analysis
- 5. Global Semiconductor Grade High Purity Quartz Sand Analysis, Insights and Forecast, 2020-2032
- 5.1. Market Analysis, Insights and Forecast - by Application
- 5.1.1. Semiconductor Research
- 5.1.2. Semiconductor Production
- 5.2. Market Analysis, Insights and Forecast - by Types
- 5.2.1. Purity 99.99%
- 5.2.2. Purity 99.995%
- 5.2.3. Purity 99.997%
- 5.2.4. Purity 99.999%
- 5.3. Market Analysis, Insights and Forecast - by Region
- 5.3.1. North America
- 5.3.2. South America
- 5.3.3. Europe
- 5.3.4. Middle East & Africa
- 5.3.5. Asia Pacific
- 5.1. Market Analysis, Insights and Forecast - by Application
- 6. North America Semiconductor Grade High Purity Quartz Sand Analysis, Insights and Forecast, 2020-2032
- 6.1. Market Analysis, Insights and Forecast - by Application
- 6.1.1. Semiconductor Research
- 6.1.2. Semiconductor Production
- 6.2. Market Analysis, Insights and Forecast - by Types
- 6.2.1. Purity 99.99%
- 6.2.2. Purity 99.995%
- 6.2.3. Purity 99.997%
- 6.2.4. Purity 99.999%
- 6.1. Market Analysis, Insights and Forecast - by Application
- 7. South America Semiconductor Grade High Purity Quartz Sand Analysis, Insights and Forecast, 2020-2032
- 7.1. Market Analysis, Insights and Forecast - by Application
- 7.1.1. Semiconductor Research
- 7.1.2. Semiconductor Production
- 7.2. Market Analysis, Insights and Forecast - by Types
- 7.2.1. Purity 99.99%
- 7.2.2. Purity 99.995%
- 7.2.3. Purity 99.997%
- 7.2.4. Purity 99.999%
- 7.1. Market Analysis, Insights and Forecast - by Application
- 8. Europe Semiconductor Grade High Purity Quartz Sand Analysis, Insights and Forecast, 2020-2032
- 8.1. Market Analysis, Insights and Forecast - by Application
- 8.1.1. Semiconductor Research
- 8.1.2. Semiconductor Production
- 8.2. Market Analysis, Insights and Forecast - by Types
- 8.2.1. Purity 99.99%
- 8.2.2. Purity 99.995%
- 8.2.3. Purity 99.997%
- 8.2.4. Purity 99.999%
- 8.1. Market Analysis, Insights and Forecast - by Application
- 9. Middle East & Africa Semiconductor Grade High Purity Quartz Sand Analysis, Insights and Forecast, 2020-2032
- 9.1. Market Analysis, Insights and Forecast - by Application
- 9.1.1. Semiconductor Research
- 9.1.2. Semiconductor Production
- 9.2. Market Analysis, Insights and Forecast - by Types
- 9.2.1. Purity 99.99%
- 9.2.2. Purity 99.995%
- 9.2.3. Purity 99.997%
- 9.2.4. Purity 99.999%
- 9.1. Market Analysis, Insights and Forecast - by Application
- 10. Asia Pacific Semiconductor Grade High Purity Quartz Sand Analysis, Insights and Forecast, 2020-2032
- 10.1. Market Analysis, Insights and Forecast - by Application
- 10.1.1. Semiconductor Research
- 10.1.2. Semiconductor Production
- 10.2. Market Analysis, Insights and Forecast - by Types
- 10.2.1. Purity 99.99%
- 10.2.2. Purity 99.995%
- 10.2.3. Purity 99.997%
- 10.2.4. Purity 99.999%
- 10.1. Market Analysis, Insights and Forecast - by Application
- 11. Competitive Analysis
- 11.1. Global Market Share Analysis 2025
- 11.2. Company Profiles
- 11.2.1 Sibelco
- 11.2.1.1. Overview
- 11.2.1.2. Products
- 11.2.1.3. SWOT Analysis
- 11.2.1.4. Recent Developments
- 11.2.1.5. Financials (Based on Availability)
- 11.2.2 The Quartz Corp
- 11.2.2.1. Overview
- 11.2.2.2. Products
- 11.2.2.3. SWOT Analysis
- 11.2.2.4. Recent Developments
- 11.2.2.5. Financials (Based on Availability)
- 11.2.3 UltraHPQ
- 11.2.3.1. Overview
- 11.2.3.2. Products
- 11.2.3.3. SWOT Analysis
- 11.2.3.4. Recent Developments
- 11.2.3.5. Financials (Based on Availability)
- 11.2.4 Russian Quartz LLC
- 11.2.4.1. Overview
- 11.2.4.2. Products
- 11.2.4.3. SWOT Analysis
- 11.2.4.4. Recent Developments
- 11.2.4.5. Financials (Based on Availability)
- 11.2.5 CAPLINQ Corporation
- 11.2.5.1. Overview
- 11.2.5.2. Products
- 11.2.5.3. SWOT Analysis
- 11.2.5.4. Recent Developments
- 11.2.5.5. Financials (Based on Availability)
- 11.2.6 Jiangsu Pacific Quartz
- 11.2.6.1. Overview
- 11.2.6.2. Products
- 11.2.6.3. SWOT Analysis
- 11.2.6.4. Recent Developments
- 11.2.6.5. Financials (Based on Availability)
- 11.2.7 SINOSI
- 11.2.7.1. Overview
- 11.2.7.2. Products
- 11.2.7.3. SWOT Analysis
- 11.2.7.4. Recent Developments
- 11.2.7.5. Financials (Based on Availability)
- 11.2.8 Donghai Shihu Quartz Co.
- 11.2.8.1. Overview
- 11.2.8.2. Products
- 11.2.8.3. SWOT Analysis
- 11.2.8.4. Recent Developments
- 11.2.8.5. Financials (Based on Availability)
- 11.2.9 Ltd
- 11.2.9.1. Overview
- 11.2.9.2. Products
- 11.2.9.3. SWOT Analysis
- 11.2.9.4. Recent Developments
- 11.2.9.5. Financials (Based on Availability)
- 11.2.10 Donghai Colorful Mineral Products
- 11.2.10.1. Overview
- 11.2.10.2. Products
- 11.2.10.3. SWOT Analysis
- 11.2.10.4. Recent Developments
- 11.2.10.5. Financials (Based on Availability)
- 11.2.11 Taosheng Fused Quartz
- 11.2.11.1. Overview
- 11.2.11.2. Products
- 11.2.11.3. SWOT Analysis
- 11.2.11.4. Recent Developments
- 11.2.11.5. Financials (Based on Availability)
- 11.2.1 Sibelco
List of Figures
- Figure 1: Global Semiconductor Grade High Purity Quartz Sand Revenue Breakdown (undefined, %) by Region 2025 & 2033
- Figure 2: North America Semiconductor Grade High Purity Quartz Sand Revenue (undefined), by Application 2025 & 2033
- Figure 3: North America Semiconductor Grade High Purity Quartz Sand Revenue Share (%), by Application 2025 & 2033
- Figure 4: North America Semiconductor Grade High Purity Quartz Sand Revenue (undefined), by Types 2025 & 2033
- Figure 5: North America Semiconductor Grade High Purity Quartz Sand Revenue Share (%), by Types 2025 & 2033
- Figure 6: North America Semiconductor Grade High Purity Quartz Sand Revenue (undefined), by Country 2025 & 2033
- Figure 7: North America Semiconductor Grade High Purity Quartz Sand Revenue Share (%), by Country 2025 & 2033
- Figure 8: South America Semiconductor Grade High Purity Quartz Sand Revenue (undefined), by Application 2025 & 2033
- Figure 9: South America Semiconductor Grade High Purity Quartz Sand Revenue Share (%), by Application 2025 & 2033
- Figure 10: South America Semiconductor Grade High Purity Quartz Sand Revenue (undefined), by Types 2025 & 2033
- Figure 11: South America Semiconductor Grade High Purity Quartz Sand Revenue Share (%), by Types 2025 & 2033
- Figure 12: South America Semiconductor Grade High Purity Quartz Sand Revenue (undefined), by Country 2025 & 2033
- Figure 13: South America Semiconductor Grade High Purity Quartz Sand Revenue Share (%), by Country 2025 & 2033
- Figure 14: Europe Semiconductor Grade High Purity Quartz Sand Revenue (undefined), by Application 2025 & 2033
- Figure 15: Europe Semiconductor Grade High Purity Quartz Sand Revenue Share (%), by Application 2025 & 2033
- Figure 16: Europe Semiconductor Grade High Purity Quartz Sand Revenue (undefined), by Types 2025 & 2033
- Figure 17: Europe Semiconductor Grade High Purity Quartz Sand Revenue Share (%), by Types 2025 & 2033
- Figure 18: Europe Semiconductor Grade High Purity Quartz Sand Revenue (undefined), by Country 2025 & 2033
- Figure 19: Europe Semiconductor Grade High Purity Quartz Sand Revenue Share (%), by Country 2025 & 2033
- Figure 20: Middle East & Africa Semiconductor Grade High Purity Quartz Sand Revenue (undefined), by Application 2025 & 2033
- Figure 21: Middle East & Africa Semiconductor Grade High Purity Quartz Sand Revenue Share (%), by Application 2025 & 2033
- Figure 22: Middle East & Africa Semiconductor Grade High Purity Quartz Sand Revenue (undefined), by Types 2025 & 2033
- Figure 23: Middle East & Africa Semiconductor Grade High Purity Quartz Sand Revenue Share (%), by Types 2025 & 2033
- Figure 24: Middle East & Africa Semiconductor Grade High Purity Quartz Sand Revenue (undefined), by Country 2025 & 2033
- Figure 25: Middle East & Africa Semiconductor Grade High Purity Quartz Sand Revenue Share (%), by Country 2025 & 2033
- Figure 26: Asia Pacific Semiconductor Grade High Purity Quartz Sand Revenue (undefined), by Application 2025 & 2033
- Figure 27: Asia Pacific Semiconductor Grade High Purity Quartz Sand Revenue Share (%), by Application 2025 & 2033
- Figure 28: Asia Pacific Semiconductor Grade High Purity Quartz Sand Revenue (undefined), by Types 2025 & 2033
- Figure 29: Asia Pacific Semiconductor Grade High Purity Quartz Sand Revenue Share (%), by Types 2025 & 2033
- Figure 30: Asia Pacific Semiconductor Grade High Purity Quartz Sand Revenue (undefined), by Country 2025 & 2033
- Figure 31: Asia Pacific Semiconductor Grade High Purity Quartz Sand Revenue Share (%), by Country 2025 & 2033
List of Tables
- Table 1: Global Semiconductor Grade High Purity Quartz Sand Revenue undefined Forecast, by Application 2020 & 2033
- Table 2: Global Semiconductor Grade High Purity Quartz Sand Revenue undefined Forecast, by Types 2020 & 2033
- Table 3: Global Semiconductor Grade High Purity Quartz Sand Revenue undefined Forecast, by Region 2020 & 2033
- Table 4: Global Semiconductor Grade High Purity Quartz Sand Revenue undefined Forecast, by Application 2020 & 2033
- Table 5: Global Semiconductor Grade High Purity Quartz Sand Revenue undefined Forecast, by Types 2020 & 2033
- Table 6: Global Semiconductor Grade High Purity Quartz Sand Revenue undefined Forecast, by Country 2020 & 2033
- Table 7: United States Semiconductor Grade High Purity Quartz Sand Revenue (undefined) Forecast, by Application 2020 & 2033
- Table 8: Canada Semiconductor Grade High Purity Quartz Sand Revenue (undefined) Forecast, by Application 2020 & 2033
- Table 9: Mexico Semiconductor Grade High Purity Quartz Sand Revenue (undefined) Forecast, by Application 2020 & 2033
- Table 10: Global Semiconductor Grade High Purity Quartz Sand Revenue undefined Forecast, by Application 2020 & 2033
- Table 11: Global Semiconductor Grade High Purity Quartz Sand Revenue undefined Forecast, by Types 2020 & 2033
- Table 12: Global Semiconductor Grade High Purity Quartz Sand Revenue undefined Forecast, by Country 2020 & 2033
- Table 13: Brazil Semiconductor Grade High Purity Quartz Sand Revenue (undefined) Forecast, by Application 2020 & 2033
- Table 14: Argentina Semiconductor Grade High Purity Quartz Sand Revenue (undefined) Forecast, by Application 2020 & 2033
- Table 15: Rest of South America Semiconductor Grade High Purity Quartz Sand Revenue (undefined) Forecast, by Application 2020 & 2033
- Table 16: Global Semiconductor Grade High Purity Quartz Sand Revenue undefined Forecast, by Application 2020 & 2033
- Table 17: Global Semiconductor Grade High Purity Quartz Sand Revenue undefined Forecast, by Types 2020 & 2033
- Table 18: Global Semiconductor Grade High Purity Quartz Sand Revenue undefined Forecast, by Country 2020 & 2033
- Table 19: United Kingdom Semiconductor Grade High Purity Quartz Sand Revenue (undefined) Forecast, by Application 2020 & 2033
- Table 20: Germany Semiconductor Grade High Purity Quartz Sand Revenue (undefined) Forecast, by Application 2020 & 2033
- Table 21: France Semiconductor Grade High Purity Quartz Sand Revenue (undefined) Forecast, by Application 2020 & 2033
- Table 22: Italy Semiconductor Grade High Purity Quartz Sand Revenue (undefined) Forecast, by Application 2020 & 2033
- Table 23: Spain Semiconductor Grade High Purity Quartz Sand Revenue (undefined) Forecast, by Application 2020 & 2033
- Table 24: Russia Semiconductor Grade High Purity Quartz Sand Revenue (undefined) Forecast, by Application 2020 & 2033
- Table 25: Benelux Semiconductor Grade High Purity Quartz Sand Revenue (undefined) Forecast, by Application 2020 & 2033
- Table 26: Nordics Semiconductor Grade High Purity Quartz Sand Revenue (undefined) Forecast, by Application 2020 & 2033
- Table 27: Rest of Europe Semiconductor Grade High Purity Quartz Sand Revenue (undefined) Forecast, by Application 2020 & 2033
- Table 28: Global Semiconductor Grade High Purity Quartz Sand Revenue undefined Forecast, by Application 2020 & 2033
- Table 29: Global Semiconductor Grade High Purity Quartz Sand Revenue undefined Forecast, by Types 2020 & 2033
- Table 30: Global Semiconductor Grade High Purity Quartz Sand Revenue undefined Forecast, by Country 2020 & 2033
- Table 31: Turkey Semiconductor Grade High Purity Quartz Sand Revenue (undefined) Forecast, by Application 2020 & 2033
- Table 32: Israel Semiconductor Grade High Purity Quartz Sand Revenue (undefined) Forecast, by Application 2020 & 2033
- Table 33: GCC Semiconductor Grade High Purity Quartz Sand Revenue (undefined) Forecast, by Application 2020 & 2033
- Table 34: North Africa Semiconductor Grade High Purity Quartz Sand Revenue (undefined) Forecast, by Application 2020 & 2033
- Table 35: South Africa Semiconductor Grade High Purity Quartz Sand Revenue (undefined) Forecast, by Application 2020 & 2033
- Table 36: Rest of Middle East & Africa Semiconductor Grade High Purity Quartz Sand Revenue (undefined) Forecast, by Application 2020 & 2033
- Table 37: Global Semiconductor Grade High Purity Quartz Sand Revenue undefined Forecast, by Application 2020 & 2033
- Table 38: Global Semiconductor Grade High Purity Quartz Sand Revenue undefined Forecast, by Types 2020 & 2033
- Table 39: Global Semiconductor Grade High Purity Quartz Sand Revenue undefined Forecast, by Country 2020 & 2033
- Table 40: China Semiconductor Grade High Purity Quartz Sand Revenue (undefined) Forecast, by Application 2020 & 2033
- Table 41: India Semiconductor Grade High Purity Quartz Sand Revenue (undefined) Forecast, by Application 2020 & 2033
- Table 42: Japan Semiconductor Grade High Purity Quartz Sand Revenue (undefined) Forecast, by Application 2020 & 2033
- Table 43: South Korea Semiconductor Grade High Purity Quartz Sand Revenue (undefined) Forecast, by Application 2020 & 2033
- Table 44: ASEAN Semiconductor Grade High Purity Quartz Sand Revenue (undefined) Forecast, by Application 2020 & 2033
- Table 45: Oceania Semiconductor Grade High Purity Quartz Sand Revenue (undefined) Forecast, by Application 2020 & 2033
- Table 46: Rest of Asia Pacific Semiconductor Grade High Purity Quartz Sand Revenue (undefined) Forecast, by Application 2020 & 2033
Frequently Asked Questions
1. What is the projected Compound Annual Growth Rate (CAGR) of the Semiconductor Grade High Purity Quartz Sand?
The projected CAGR is approximately 6.71%.
2. Which companies are prominent players in the Semiconductor Grade High Purity Quartz Sand?
Key companies in the market include Sibelco, The Quartz Corp, UltraHPQ, Russian Quartz LLC, CAPLINQ Corporation, Jiangsu Pacific Quartz, SINOSI, Donghai Shihu Quartz Co., Ltd, Donghai Colorful Mineral Products, Taosheng Fused Quartz.
3. What are the main segments of the Semiconductor Grade High Purity Quartz Sand?
The market segments include Application, Types.
4. Can you provide details about the market size?
The market size is estimated to be USD XXX N/A as of 2022.
5. What are some drivers contributing to market growth?
N/A
6. What are the notable trends driving market growth?
N/A
7. Are there any restraints impacting market growth?
N/A
8. Can you provide examples of recent developments in the market?
N/A
9. What pricing options are available for accessing the report?
Pricing options include single-user, multi-user, and enterprise licenses priced at USD 4900.00, USD 7350.00, and USD 9800.00 respectively.
10. Is the market size provided in terms of value or volume?
The market size is provided in terms of value, measured in N/A.
11. Are there any specific market keywords associated with the report?
Yes, the market keyword associated with the report is "Semiconductor Grade High Purity Quartz Sand," which aids in identifying and referencing the specific market segment covered.
12. How do I determine which pricing option suits my needs best?
The pricing options vary based on user requirements and access needs. Individual users may opt for single-user licenses, while businesses requiring broader access may choose multi-user or enterprise licenses for cost-effective access to the report.
13. Are there any additional resources or data provided in the Semiconductor Grade High Purity Quartz Sand report?
While the report offers comprehensive insights, it's advisable to review the specific contents or supplementary materials provided to ascertain if additional resources or data are available.
14. How can I stay updated on further developments or reports in the Semiconductor Grade High Purity Quartz Sand?
To stay informed about further developments, trends, and reports in the Semiconductor Grade High Purity Quartz Sand, consider subscribing to industry newsletters, following relevant companies and organizations, or regularly checking reputable industry news sources and publications.
Methodology
Step 1 - Identification of Relevant Samples Size from Population Database


Step 2 - Approaches for Defining Global Market Size (Value, Volume* & Price*)

Note*: In applicable scenarios
Step 3 - Data Sources
Primary Research
- Web Analytics
- Survey Reports
- Research Institute
- Latest Research Reports
- Opinion Leaders
Secondary Research
- Annual Reports
- White Paper
- Latest Press Release
- Industry Association
- Paid Database
- Investor Presentations

Step 4 - Data Triangulation
Involves using different sources of information in order to increase the validity of a study
These sources are likely to be stakeholders in a program - participants, other researchers, program staff, other community members, and so on.
Then we put all data in single framework & apply various statistical tools to find out the dynamic on the market.
During the analysis stage, feedback from the stakeholder groups would be compared to determine areas of agreement as well as areas of divergence