

Key Insights
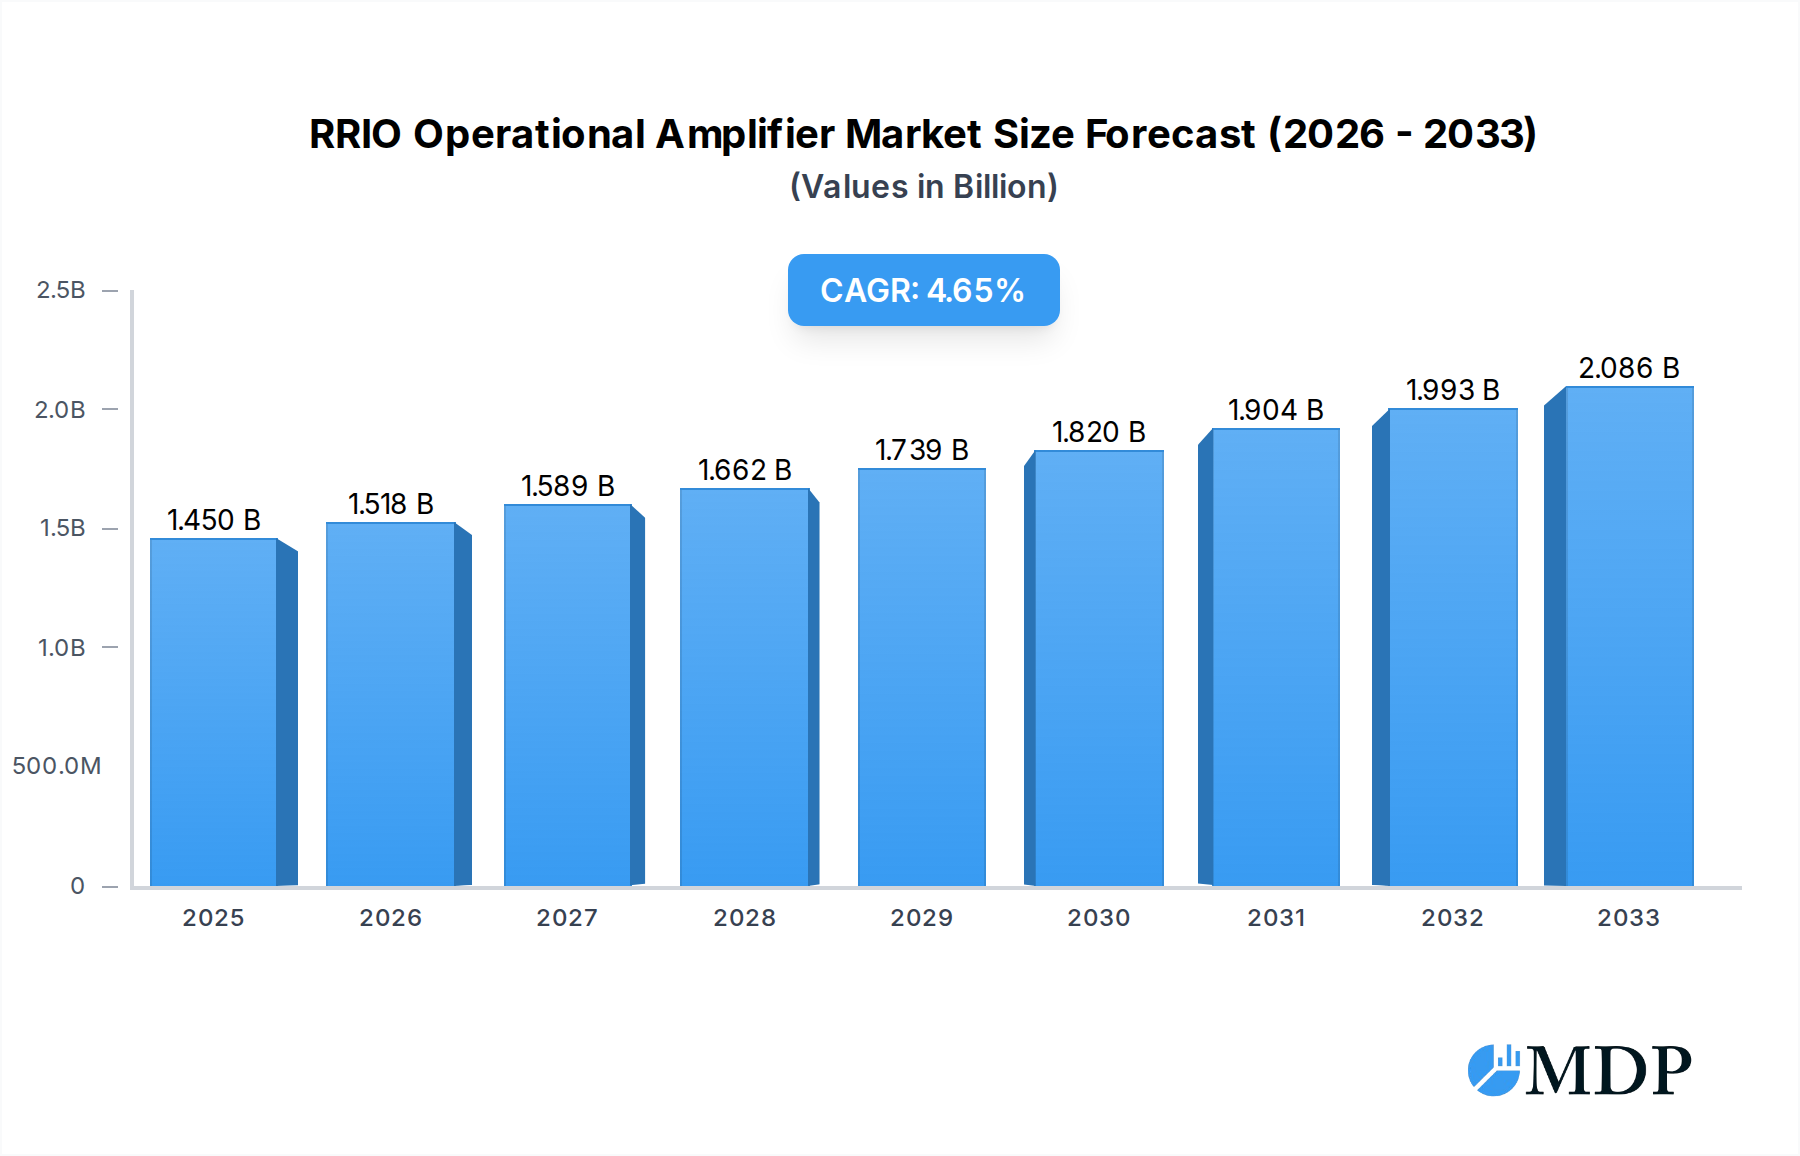
The RRIO (Rail-to-Rail Input/Output) Operational Amplifier market is poised for robust expansion, projected to reach $1450.2 million by 2025, with an impressive Compound Annual Growth Rate (CAGR) of 4.6% from 2019 to 2033. This sustained growth is primarily driven by the escalating demand for miniaturization and power efficiency across a spectrum of electronic devices. The increasing adoption of RRIO op-amps in automotive sensor applications, facilitating enhanced safety and autonomous driving features, is a significant catalyst. Similarly, the surge in industrial automation, requiring precise and reliable analog signal processing for control systems and robotics, further fuels market momentum. The medical sector's continuous innovation, from portable diagnostic equipment to advanced patient monitoring systems, also relies heavily on the low-voltage and high-precision capabilities of RRIO op-amps, contributing substantially to market expansion.

RRIO Operational Amplifier Market Size (In Billion)
Emerging trends such as the integration of AI and IoT in various devices are creating new avenues for RRIO op-amp utilization. The need for compact, low-power solutions in wearable technology, smart home devices, and advanced communication systems is particularly noteworthy. While the market demonstrates strong growth potential, certain restraints such as the increasing complexity of integrated circuits and the need for specialized manufacturing processes could pose challenges. However, the continuous innovation by leading players like Texas Instruments, Renesas, and Analog Devices in developing next-generation RRIO op-amps with improved performance characteristics and lower power consumption is expected to mitigate these challenges, ensuring the market's upward trajectory. The market is segmented by application into Automotive Sensor, Industrial Automation, Medical, and Other, and by type into Single Channel, Dual Channels, 4 Channels, and Other, indicating a diverse range of opportunities.
RRIO Operational Amplifier Company Market Share
RRIO Operational Amplifier Market Insights: Comprehensive Analysis and Forecast (2019-2033)
This in-depth report provides a definitive analysis of the RRIO (Rail-to-Rail Input/Output) operational amplifier market, offering strategic insights and actionable intelligence for industry stakeholders. Spanning a comprehensive study period from 2019 to 2033, with a base year of 2025 and a forecast period from 2025 to 2033, this report delves into market dynamics, key trends, leading segments, product innovations, growth drivers, challenges, emerging opportunities, and the competitive landscape. Leveraging high-traffic keywords such as "RRIO operational amplifier market," "automotive sensors," "industrial automation," "medical electronics," and "high-performance op-amps," this report is optimized for maximum search visibility and engagement within the semiconductor and electronics industry.
RRIO Operational Amplifier Market Dynamics & Concentration
The RRIO operational amplifier market is characterized by a moderate to high concentration, with a few key players holding a significant market share. Innovation in RRIO op-amps is primarily driven by the increasing demand for higher precision, lower power consumption, and enhanced performance in miniaturized electronic systems. Regulatory frameworks, particularly those related to safety and environmental standards in automotive and medical applications, are playing a crucial role in shaping product development and market access. Product substitutes, such as traditional op-amps with limited rail-to-rail capabilities, are gradually being phased out in favor of RRIO solutions due to their superior performance. End-user trends indicate a strong preference for integrated solutions and miniaturization, pushing manufacturers to develop smaller, more efficient RRIO op-amps. Mergers and acquisitions (M&A) activities, while not rampant, have been strategic, aimed at consolidating market share and acquiring advanced technological capabilities. The market share distribution reveals that companies like Texas Instruments, Analog Devices, and Renesas collectively command over 60 million in market share. M&A deal counts, while specific numbers are proprietary, have been observed in the range of 10-20 significant transactions over the historical period (2019-2024), indicating strategic consolidation.
RRIO Operational Amplifier Industry Trends & Analysis
The RRIO operational amplifier industry is experiencing robust growth, driven by several key factors. The increasing adoption of advanced driver-assistance systems (ADAS) in the automotive sector, requiring highly accurate and efficient sensor signal conditioning, is a significant market growth driver. In industrial automation, the demand for precise control and monitoring in sophisticated machinery fuels the need for high-performance RRIO op-amps. The medical industry's continuous innovation in portable diagnostic devices and implantable electronics also necessitates low-power, high-accuracy RRIO solutions. Technological disruptions, such as advancements in silicon-on-insulator (SOI) and complementary metal-oxide-semiconductor (CMOS) fabrication processes, are enabling the development of smaller, more power-efficient RRIO op-amps with enhanced features. Consumer preferences are leaning towards integrated solutions and miniaturization, prompting manufacturers to reduce the footprint of their RRIO op-amp offerings. The competitive dynamics are intense, with established players continuously innovating to maintain their market leadership while new entrants are focusing on niche applications and cost-effective solutions. The Compound Annual Growth Rate (CAGR) for the RRIO operational amplifier market is projected to be approximately 8.5% over the forecast period, reaching an estimated market size of over 5,000 million by 2033. Market penetration in emerging economies is steadily increasing, driven by the growing adoption of advanced electronics in these regions.
Leading Markets & Segments in RRIO Operational Amplifier
The Automotive Sensor segment is currently the dominant market for RRIO operational amplifiers, driven by the exponential growth in autonomous driving technologies and the increasing number of sensors per vehicle. Countries like the United States, China, and Germany are leading the adoption due to their robust automotive manufacturing industries and proactive embrace of advanced vehicle technologies.
- Key Drivers for Automotive Sensor Dominance:
- Economic Policies: Government incentives and regulations promoting electric vehicles (EVs) and autonomous driving technologies.
- Infrastructure: Development of smart infrastructure and connectivity to support advanced vehicle functions.
- Consumer Demand: Growing consumer interest in safety features, convenience, and the novelty of autonomous driving.
- Technological Advancements: Continuous innovation in sensor technology and processing capabilities.
Within the Types category, Dual Channels and 4 Channels RRIO operational amplifiers are witnessing significant traction due to the increasing complexity of electronic systems that require multiple signal processing channels. The demand for integrated multi-channel solutions reduces component count and board space, a critical factor in modern electronic design.
Dominance Analysis - Automotive Sensor: The automotive industry's stringent requirements for reliability, accuracy, and performance in harsh environments make RRIO operational amplifiers indispensable. From engine control units (ECUs) to radar and lidar systems, RRIO op-amps are critical for signal conditioning and amplification, directly impacting vehicle safety and functionality. The sheer volume of vehicles produced globally ensures a sustained and substantial demand for these components.
Dominance Analysis - Dual & 4 Channels: The trend towards system integration and miniaturization in both automotive and industrial applications is a key driver for multi-channel RRIO op-amps. For instance, in an industrial robot arm, multiple sensors (e.g., position, force, temperature) require simultaneous processing, making dual and quad-channel op-amps a cost-effective and space-saving solution. Similarly, in medical devices like portable ECG monitors, multiple biological signals need to be accurately amplified and processed.
RRIO Operational Amplifier Product Developments
Recent product developments in RRIO operational amplifiers focus on ultra-low power consumption, high bandwidth, and enhanced accuracy for battery-powered and portable devices. Innovations include the integration of additional features such as comparators and voltage references within a single package, reducing component count and board space. Companies are also developing RRIO op-amps with improved electromagnetic interference (EMI) immunity and wider operating temperature ranges to meet the demands of industrial and automotive environments. These advancements provide manufacturers with greater design flexibility and enable the creation of more sophisticated and reliable electronic systems.
Key Drivers of RRIO Operational Amplifier Growth
The growth of the RRIO operational amplifier market is propelled by several key factors. The escalating demand for advanced driver-assistance systems (ADAS) in the automotive sector, driven by safety regulations and consumer preferences for enhanced vehicle capabilities, is a primary driver. The continuous evolution of industrial automation, with an increasing emphasis on smart factories and the Industrial Internet of Things (IIoT), necessitates precise and efficient signal processing, fueling RRIO op-amp adoption. Furthermore, the expanding healthcare sector's need for miniaturized, low-power, and highly accurate medical devices, such as portable diagnostic equipment and implantable sensors, contributes significantly to market expansion. Advancements in semiconductor manufacturing technologies also enable the development of more performant and cost-effective RRIO op-amps, further accelerating their integration into various applications.
Challenges in the RRIO Operational Amplifier Market
Despite the positive growth trajectory, the RRIO operational amplifier market faces certain challenges. Supply chain disruptions and raw material price volatility, particularly for critical semiconductor components, can impact production volumes and costs, creating uncertainty for manufacturers and end-users. The increasing complexity of integrated circuits and the stringent testing requirements for high-reliability applications, especially in the automotive and medical sectors, contribute to longer development cycles and higher manufacturing costs. Intense competition among established players and emerging market participants can lead to price erosion in certain segments, impacting profit margins. Moreover, the need to comply with diverse and evolving regulatory standards across different regions and industries adds another layer of complexity to market entry and product development.
Emerging Opportunities in RRIO Operational Amplifier
Emerging opportunities in the RRIO operational amplifier market are largely driven by technological breakthroughs and strategic market expansion. The burgeoning demand for edge computing applications, where data processing occurs closer to the source, presents a significant opportunity for low-power, high-performance RRIO op-amps in IoT devices and smart sensors. The continued growth of wearable technology and personal health monitoring devices, requiring compact and energy-efficient electronic components, also opens new avenues for RRIO op-amp innovation. Strategic partnerships between semiconductor manufacturers and system integrators can accelerate product development and market penetration in niche application areas. Furthermore, the ongoing transition towards renewable energy solutions and smart grid technologies will necessitate advanced power management and sensing capabilities, creating further demand for sophisticated RRIO operational amplifiers.
Leading Players in the RRIO Operational Amplifier Sector
- Texas Instruments
- Renesas
- Analog Devices
- STMicroelectronics
- ROHM
- Onsemi
- Diodes
- Nisshinbo Micro Device
- Corebai
- Shenzhen Enchgip Semiconductor
Key Milestones in RRIO Operational Amplifier Industry
- 2019: Increased adoption of RRIO op-amps in automotive infotainment systems due to demand for higher audio fidelity and integrated functionalities.
- 2020: Launch of ultra-low power RRIO op-amps designed for battery-operated IoT devices, signaling a shift towards energy efficiency.
- 2021: Significant investments in R&D for high-speed RRIO op-amps to support the growing demand for 5G infrastructure and data centers.
- 2022: Expansion of RRIO op-amp offerings catering to the burgeoning medical device market, with a focus on precision and miniaturization.
- 2023: Introduction of RRIO op-amps with advanced EMI suppression capabilities to address the challenges of increasingly crowded electronic environments.
- 2024: Key strategic partnerships formed between leading RRIO op-amp manufacturers and automotive OEMs to co-develop next-generation sensor solutions.
Strategic Outlook for RRIO Operational Amplifier Market
The strategic outlook for the RRIO operational amplifier market remains exceptionally positive, driven by sustained demand across critical sectors. Continued advancements in miniaturization, power efficiency, and performance will be paramount for market leaders. Focus on developing specialized RRIO op-amps tailored for emerging applications such as AI at the edge, advanced robotics, and next-generation medical diagnostics will unlock significant growth potential. Strategic alliances and a proactive approach to evolving regulatory landscapes will be crucial for navigating competitive pressures and ensuring long-term market success. The market is poised for continued expansion, with innovation in areas like integration of digital functionalities and enhanced reliability being key accelerators.
RRIO Operational Amplifier Segmentation
-
1. Application
- 1.1. Automotive Sensor
- 1.2. Industrial Automation
- 1.3. Medical
- 1.4. Other
-
2. Types
- 2.1. Single Channel
- 2.2. Dual Channels
- 2.3. 4 Channels
- 2.4. Other
RRIO Operational Amplifier Segmentation By Geography
-
1. North America
- 1.1. United States
- 1.2. Canada
- 1.3. Mexico
-
2. South America
- 2.1. Brazil
- 2.2. Argentina
- 2.3. Rest of South America
-
3. Europe
- 3.1. United Kingdom
- 3.2. Germany
- 3.3. France
- 3.4. Italy
- 3.5. Spain
- 3.6. Russia
- 3.7. Benelux
- 3.8. Nordics
- 3.9. Rest of Europe
-
4. Middle East & Africa
- 4.1. Turkey
- 4.2. Israel
- 4.3. GCC
- 4.4. North Africa
- 4.5. South Africa
- 4.6. Rest of Middle East & Africa
-
5. Asia Pacific
- 5.1. China
- 5.2. India
- 5.3. Japan
- 5.4. South Korea
- 5.5. ASEAN
- 5.6. Oceania
- 5.7. Rest of Asia Pacific
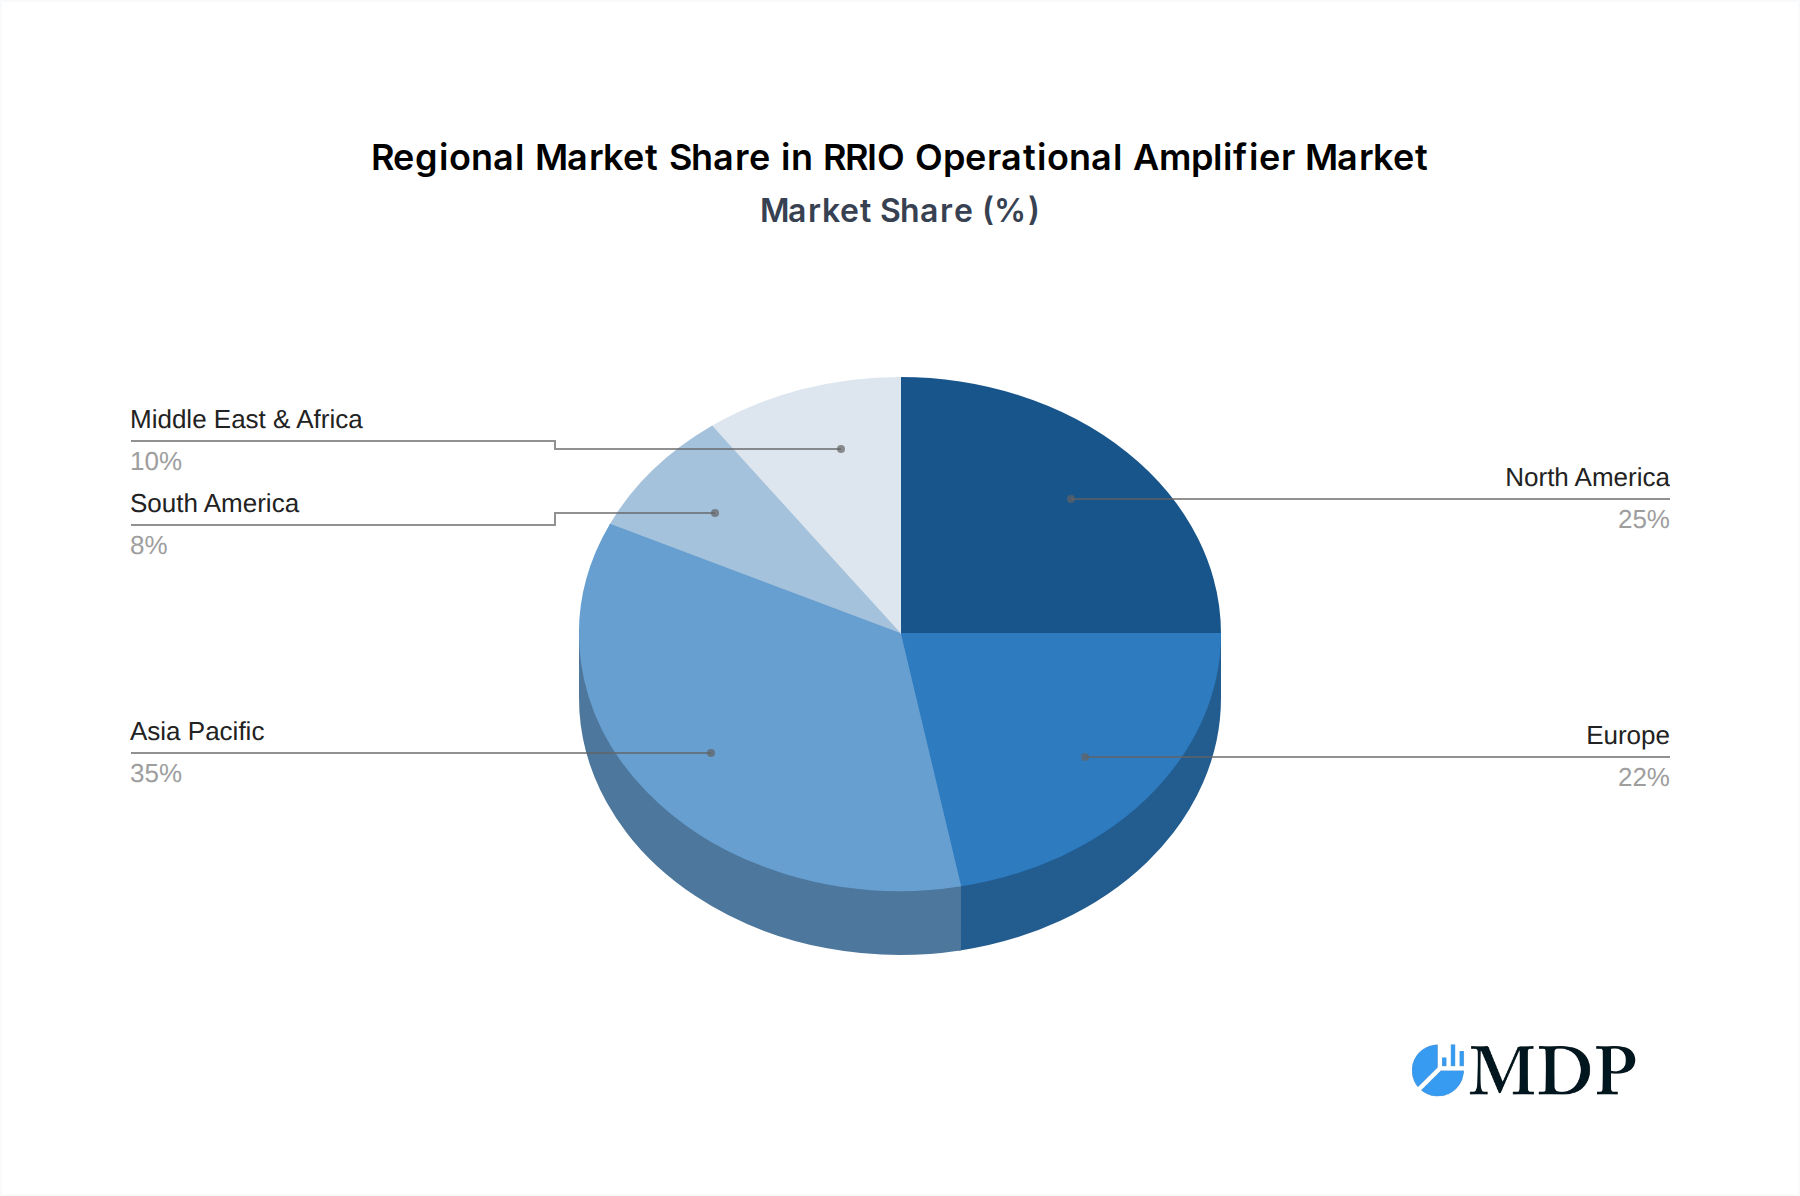
RRIO Operational Amplifier Regional Market Share
Geographic Coverage of RRIO Operational Amplifier
RRIO Operational Amplifier REPORT HIGHLIGHTS
| Aspects | Details |
|---|---|
| Study Period | 2020-2034 |
| Base Year | 2025 |
| Estimated Year | 2026 |
| Forecast Period | 2026-2034 |
| Historical Period | 2020-2025 |
| Growth Rate | CAGR of 4.6% from 2020-2034 |
| Segmentation |
|
Table of Contents
- 1. Introduction
- 1.1. Research Scope
- 1.2. Market Segmentation
- 1.3. Research Methodology
- 1.4. Definitions and Assumptions
- 2. Executive Summary
- 2.1. Introduction
- 3. Market Dynamics
- 3.1. Introduction
- 3.2. Market Drivers
- 3.3. Market Restrains
- 3.4. Market Trends
- 4. Market Factor Analysis
- 4.1. Porters Five Forces
- 4.2. Supply/Value Chain
- 4.3. PESTEL analysis
- 4.4. Market Entropy
- 4.5. Patent/Trademark Analysis
- 5. Global RRIO Operational Amplifier Analysis, Insights and Forecast, 2020-2032
- 5.1. Market Analysis, Insights and Forecast - by Application
- 5.1.1. Automotive Sensor
- 5.1.2. Industrial Automation
- 5.1.3. Medical
- 5.1.4. Other
- 5.2. Market Analysis, Insights and Forecast - by Types
- 5.2.1. Single Channel
- 5.2.2. Dual Channels
- 5.2.3. 4 Channels
- 5.2.4. Other
- 5.3. Market Analysis, Insights and Forecast - by Region
- 5.3.1. North America
- 5.3.2. South America
- 5.3.3. Europe
- 5.3.4. Middle East & Africa
- 5.3.5. Asia Pacific
- 5.1. Market Analysis, Insights and Forecast - by Application
- 6. North America RRIO Operational Amplifier Analysis, Insights and Forecast, 2020-2032
- 6.1. Market Analysis, Insights and Forecast - by Application
- 6.1.1. Automotive Sensor
- 6.1.2. Industrial Automation
- 6.1.3. Medical
- 6.1.4. Other
- 6.2. Market Analysis, Insights and Forecast - by Types
- 6.2.1. Single Channel
- 6.2.2. Dual Channels
- 6.2.3. 4 Channels
- 6.2.4. Other
- 6.1. Market Analysis, Insights and Forecast - by Application
- 7. South America RRIO Operational Amplifier Analysis, Insights and Forecast, 2020-2032
- 7.1. Market Analysis, Insights and Forecast - by Application
- 7.1.1. Automotive Sensor
- 7.1.2. Industrial Automation
- 7.1.3. Medical
- 7.1.4. Other
- 7.2. Market Analysis, Insights and Forecast - by Types
- 7.2.1. Single Channel
- 7.2.2. Dual Channels
- 7.2.3. 4 Channels
- 7.2.4. Other
- 7.1. Market Analysis, Insights and Forecast - by Application
- 8. Europe RRIO Operational Amplifier Analysis, Insights and Forecast, 2020-2032
- 8.1. Market Analysis, Insights and Forecast - by Application
- 8.1.1. Automotive Sensor
- 8.1.2. Industrial Automation
- 8.1.3. Medical
- 8.1.4. Other
- 8.2. Market Analysis, Insights and Forecast - by Types
- 8.2.1. Single Channel
- 8.2.2. Dual Channels
- 8.2.3. 4 Channels
- 8.2.4. Other
- 8.1. Market Analysis, Insights and Forecast - by Application
- 9. Middle East & Africa RRIO Operational Amplifier Analysis, Insights and Forecast, 2020-2032
- 9.1. Market Analysis, Insights and Forecast - by Application
- 9.1.1. Automotive Sensor
- 9.1.2. Industrial Automation
- 9.1.3. Medical
- 9.1.4. Other
- 9.2. Market Analysis, Insights and Forecast - by Types
- 9.2.1. Single Channel
- 9.2.2. Dual Channels
- 9.2.3. 4 Channels
- 9.2.4. Other
- 9.1. Market Analysis, Insights and Forecast - by Application
- 10. Asia Pacific RRIO Operational Amplifier Analysis, Insights and Forecast, 2020-2032
- 10.1. Market Analysis, Insights and Forecast - by Application
- 10.1.1. Automotive Sensor
- 10.1.2. Industrial Automation
- 10.1.3. Medical
- 10.1.4. Other
- 10.2. Market Analysis, Insights and Forecast - by Types
- 10.2.1. Single Channel
- 10.2.2. Dual Channels
- 10.2.3. 4 Channels
- 10.2.4. Other
- 10.1. Market Analysis, Insights and Forecast - by Application
- 11. Competitive Analysis
- 11.1. Global Market Share Analysis 2025
- 11.2. Company Profiles
- 11.2.1 Texas Instruments
- 11.2.1.1. Overview
- 11.2.1.2. Products
- 11.2.1.3. SWOT Analysis
- 11.2.1.4. Recent Developments
- 11.2.1.5. Financials (Based on Availability)
- 11.2.2 Renesas
- 11.2.2.1. Overview
- 11.2.2.2. Products
- 11.2.2.3. SWOT Analysis
- 11.2.2.4. Recent Developments
- 11.2.2.5. Financials (Based on Availability)
- 11.2.3 Analog Devices
- 11.2.3.1. Overview
- 11.2.3.2. Products
- 11.2.3.3. SWOT Analysis
- 11.2.3.4. Recent Developments
- 11.2.3.5. Financials (Based on Availability)
- 11.2.4 STMicroelectronics
- 11.2.4.1. Overview
- 11.2.4.2. Products
- 11.2.4.3. SWOT Analysis
- 11.2.4.4. Recent Developments
- 11.2.4.5. Financials (Based on Availability)
- 11.2.5 ROHM
- 11.2.5.1. Overview
- 11.2.5.2. Products
- 11.2.5.3. SWOT Analysis
- 11.2.5.4. Recent Developments
- 11.2.5.5. Financials (Based on Availability)
- 11.2.6 Onsemi
- 11.2.6.1. Overview
- 11.2.6.2. Products
- 11.2.6.3. SWOT Analysis
- 11.2.6.4. Recent Developments
- 11.2.6.5. Financials (Based on Availability)
- 11.2.7 Diodes
- 11.2.7.1. Overview
- 11.2.7.2. Products
- 11.2.7.3. SWOT Analysis
- 11.2.7.4. Recent Developments
- 11.2.7.5. Financials (Based on Availability)
- 11.2.8 Nisshinbo Micro Device
- 11.2.8.1. Overview
- 11.2.8.2. Products
- 11.2.8.3. SWOT Analysis
- 11.2.8.4. Recent Developments
- 11.2.8.5. Financials (Based on Availability)
- 11.2.9 Corebai
- 11.2.9.1. Overview
- 11.2.9.2. Products
- 11.2.9.3. SWOT Analysis
- 11.2.9.4. Recent Developments
- 11.2.9.5. Financials (Based on Availability)
- 11.2.10 Shenzhen Enchgip Semiconductor
- 11.2.10.1. Overview
- 11.2.10.2. Products
- 11.2.10.3. SWOT Analysis
- 11.2.10.4. Recent Developments
- 11.2.10.5. Financials (Based on Availability)
- 11.2.1 Texas Instruments
List of Figures
- Figure 1: Global RRIO Operational Amplifier Revenue Breakdown (undefined, %) by Region 2025 & 2033
- Figure 2: Global RRIO Operational Amplifier Volume Breakdown (K, %) by Region 2025 & 2033
- Figure 3: North America RRIO Operational Amplifier Revenue (undefined), by Application 2025 & 2033
- Figure 4: North America RRIO Operational Amplifier Volume (K), by Application 2025 & 2033
- Figure 5: North America RRIO Operational Amplifier Revenue Share (%), by Application 2025 & 2033
- Figure 6: North America RRIO Operational Amplifier Volume Share (%), by Application 2025 & 2033
- Figure 7: North America RRIO Operational Amplifier Revenue (undefined), by Types 2025 & 2033
- Figure 8: North America RRIO Operational Amplifier Volume (K), by Types 2025 & 2033
- Figure 9: North America RRIO Operational Amplifier Revenue Share (%), by Types 2025 & 2033
- Figure 10: North America RRIO Operational Amplifier Volume Share (%), by Types 2025 & 2033
- Figure 11: North America RRIO Operational Amplifier Revenue (undefined), by Country 2025 & 2033
- Figure 12: North America RRIO Operational Amplifier Volume (K), by Country 2025 & 2033
- Figure 13: North America RRIO Operational Amplifier Revenue Share (%), by Country 2025 & 2033
- Figure 14: North America RRIO Operational Amplifier Volume Share (%), by Country 2025 & 2033
- Figure 15: South America RRIO Operational Amplifier Revenue (undefined), by Application 2025 & 2033
- Figure 16: South America RRIO Operational Amplifier Volume (K), by Application 2025 & 2033
- Figure 17: South America RRIO Operational Amplifier Revenue Share (%), by Application 2025 & 2033
- Figure 18: South America RRIO Operational Amplifier Volume Share (%), by Application 2025 & 2033
- Figure 19: South America RRIO Operational Amplifier Revenue (undefined), by Types 2025 & 2033
- Figure 20: South America RRIO Operational Amplifier Volume (K), by Types 2025 & 2033
- Figure 21: South America RRIO Operational Amplifier Revenue Share (%), by Types 2025 & 2033
- Figure 22: South America RRIO Operational Amplifier Volume Share (%), by Types 2025 & 2033
- Figure 23: South America RRIO Operational Amplifier Revenue (undefined), by Country 2025 & 2033
- Figure 24: South America RRIO Operational Amplifier Volume (K), by Country 2025 & 2033
- Figure 25: South America RRIO Operational Amplifier Revenue Share (%), by Country 2025 & 2033
- Figure 26: South America RRIO Operational Amplifier Volume Share (%), by Country 2025 & 2033
- Figure 27: Europe RRIO Operational Amplifier Revenue (undefined), by Application 2025 & 2033
- Figure 28: Europe RRIO Operational Amplifier Volume (K), by Application 2025 & 2033
- Figure 29: Europe RRIO Operational Amplifier Revenue Share (%), by Application 2025 & 2033
- Figure 30: Europe RRIO Operational Amplifier Volume Share (%), by Application 2025 & 2033
- Figure 31: Europe RRIO Operational Amplifier Revenue (undefined), by Types 2025 & 2033
- Figure 32: Europe RRIO Operational Amplifier Volume (K), by Types 2025 & 2033
- Figure 33: Europe RRIO Operational Amplifier Revenue Share (%), by Types 2025 & 2033
- Figure 34: Europe RRIO Operational Amplifier Volume Share (%), by Types 2025 & 2033
- Figure 35: Europe RRIO Operational Amplifier Revenue (undefined), by Country 2025 & 2033
- Figure 36: Europe RRIO Operational Amplifier Volume (K), by Country 2025 & 2033
- Figure 37: Europe RRIO Operational Amplifier Revenue Share (%), by Country 2025 & 2033
- Figure 38: Europe RRIO Operational Amplifier Volume Share (%), by Country 2025 & 2033
- Figure 39: Middle East & Africa RRIO Operational Amplifier Revenue (undefined), by Application 2025 & 2033
- Figure 40: Middle East & Africa RRIO Operational Amplifier Volume (K), by Application 2025 & 2033
- Figure 41: Middle East & Africa RRIO Operational Amplifier Revenue Share (%), by Application 2025 & 2033
- Figure 42: Middle East & Africa RRIO Operational Amplifier Volume Share (%), by Application 2025 & 2033
- Figure 43: Middle East & Africa RRIO Operational Amplifier Revenue (undefined), by Types 2025 & 2033
- Figure 44: Middle East & Africa RRIO Operational Amplifier Volume (K), by Types 2025 & 2033
- Figure 45: Middle East & Africa RRIO Operational Amplifier Revenue Share (%), by Types 2025 & 2033
- Figure 46: Middle East & Africa RRIO Operational Amplifier Volume Share (%), by Types 2025 & 2033
- Figure 47: Middle East & Africa RRIO Operational Amplifier Revenue (undefined), by Country 2025 & 2033
- Figure 48: Middle East & Africa RRIO Operational Amplifier Volume (K), by Country 2025 & 2033
- Figure 49: Middle East & Africa RRIO Operational Amplifier Revenue Share (%), by Country 2025 & 2033
- Figure 50: Middle East & Africa RRIO Operational Amplifier Volume Share (%), by Country 2025 & 2033
- Figure 51: Asia Pacific RRIO Operational Amplifier Revenue (undefined), by Application 2025 & 2033
- Figure 52: Asia Pacific RRIO Operational Amplifier Volume (K), by Application 2025 & 2033
- Figure 53: Asia Pacific RRIO Operational Amplifier Revenue Share (%), by Application 2025 & 2033
- Figure 54: Asia Pacific RRIO Operational Amplifier Volume Share (%), by Application 2025 & 2033
- Figure 55: Asia Pacific RRIO Operational Amplifier Revenue (undefined), by Types 2025 & 2033
- Figure 56: Asia Pacific RRIO Operational Amplifier Volume (K), by Types 2025 & 2033
- Figure 57: Asia Pacific RRIO Operational Amplifier Revenue Share (%), by Types 2025 & 2033
- Figure 58: Asia Pacific RRIO Operational Amplifier Volume Share (%), by Types 2025 & 2033
- Figure 59: Asia Pacific RRIO Operational Amplifier Revenue (undefined), by Country 2025 & 2033
- Figure 60: Asia Pacific RRIO Operational Amplifier Volume (K), by Country 2025 & 2033
- Figure 61: Asia Pacific RRIO Operational Amplifier Revenue Share (%), by Country 2025 & 2033
- Figure 62: Asia Pacific RRIO Operational Amplifier Volume Share (%), by Country 2025 & 2033
List of Tables
- Table 1: Global RRIO Operational Amplifier Revenue undefined Forecast, by Application 2020 & 2033
- Table 2: Global RRIO Operational Amplifier Volume K Forecast, by Application 2020 & 2033
- Table 3: Global RRIO Operational Amplifier Revenue undefined Forecast, by Types 2020 & 2033
- Table 4: Global RRIO Operational Amplifier Volume K Forecast, by Types 2020 & 2033
- Table 5: Global RRIO Operational Amplifier Revenue undefined Forecast, by Region 2020 & 2033
- Table 6: Global RRIO Operational Amplifier Volume K Forecast, by Region 2020 & 2033
- Table 7: Global RRIO Operational Amplifier Revenue undefined Forecast, by Application 2020 & 2033
- Table 8: Global RRIO Operational Amplifier Volume K Forecast, by Application 2020 & 2033
- Table 9: Global RRIO Operational Amplifier Revenue undefined Forecast, by Types 2020 & 2033
- Table 10: Global RRIO Operational Amplifier Volume K Forecast, by Types 2020 & 2033
- Table 11: Global RRIO Operational Amplifier Revenue undefined Forecast, by Country 2020 & 2033
- Table 12: Global RRIO Operational Amplifier Volume K Forecast, by Country 2020 & 2033
- Table 13: United States RRIO Operational Amplifier Revenue (undefined) Forecast, by Application 2020 & 2033
- Table 14: United States RRIO Operational Amplifier Volume (K) Forecast, by Application 2020 & 2033
- Table 15: Canada RRIO Operational Amplifier Revenue (undefined) Forecast, by Application 2020 & 2033
- Table 16: Canada RRIO Operational Amplifier Volume (K) Forecast, by Application 2020 & 2033
- Table 17: Mexico RRIO Operational Amplifier Revenue (undefined) Forecast, by Application 2020 & 2033
- Table 18: Mexico RRIO Operational Amplifier Volume (K) Forecast, by Application 2020 & 2033
- Table 19: Global RRIO Operational Amplifier Revenue undefined Forecast, by Application 2020 & 2033
- Table 20: Global RRIO Operational Amplifier Volume K Forecast, by Application 2020 & 2033
- Table 21: Global RRIO Operational Amplifier Revenue undefined Forecast, by Types 2020 & 2033
- Table 22: Global RRIO Operational Amplifier Volume K Forecast, by Types 2020 & 2033
- Table 23: Global RRIO Operational Amplifier Revenue undefined Forecast, by Country 2020 & 2033
- Table 24: Global RRIO Operational Amplifier Volume K Forecast, by Country 2020 & 2033
- Table 25: Brazil RRIO Operational Amplifier Revenue (undefined) Forecast, by Application 2020 & 2033
- Table 26: Brazil RRIO Operational Amplifier Volume (K) Forecast, by Application 2020 & 2033
- Table 27: Argentina RRIO Operational Amplifier Revenue (undefined) Forecast, by Application 2020 & 2033
- Table 28: Argentina RRIO Operational Amplifier Volume (K) Forecast, by Application 2020 & 2033
- Table 29: Rest of South America RRIO Operational Amplifier Revenue (undefined) Forecast, by Application 2020 & 2033
- Table 30: Rest of South America RRIO Operational Amplifier Volume (K) Forecast, by Application 2020 & 2033
- Table 31: Global RRIO Operational Amplifier Revenue undefined Forecast, by Application 2020 & 2033
- Table 32: Global RRIO Operational Amplifier Volume K Forecast, by Application 2020 & 2033
- Table 33: Global RRIO Operational Amplifier Revenue undefined Forecast, by Types 2020 & 2033
- Table 34: Global RRIO Operational Amplifier Volume K Forecast, by Types 2020 & 2033
- Table 35: Global RRIO Operational Amplifier Revenue undefined Forecast, by Country 2020 & 2033
- Table 36: Global RRIO Operational Amplifier Volume K Forecast, by Country 2020 & 2033
- Table 37: United Kingdom RRIO Operational Amplifier Revenue (undefined) Forecast, by Application 2020 & 2033
- Table 38: United Kingdom RRIO Operational Amplifier Volume (K) Forecast, by Application 2020 & 2033
- Table 39: Germany RRIO Operational Amplifier Revenue (undefined) Forecast, by Application 2020 & 2033
- Table 40: Germany RRIO Operational Amplifier Volume (K) Forecast, by Application 2020 & 2033
- Table 41: France RRIO Operational Amplifier Revenue (undefined) Forecast, by Application 2020 & 2033
- Table 42: France RRIO Operational Amplifier Volume (K) Forecast, by Application 2020 & 2033
- Table 43: Italy RRIO Operational Amplifier Revenue (undefined) Forecast, by Application 2020 & 2033
- Table 44: Italy RRIO Operational Amplifier Volume (K) Forecast, by Application 2020 & 2033
- Table 45: Spain RRIO Operational Amplifier Revenue (undefined) Forecast, by Application 2020 & 2033
- Table 46: Spain RRIO Operational Amplifier Volume (K) Forecast, by Application 2020 & 2033
- Table 47: Russia RRIO Operational Amplifier Revenue (undefined) Forecast, by Application 2020 & 2033
- Table 48: Russia RRIO Operational Amplifier Volume (K) Forecast, by Application 2020 & 2033
- Table 49: Benelux RRIO Operational Amplifier Revenue (undefined) Forecast, by Application 2020 & 2033
- Table 50: Benelux RRIO Operational Amplifier Volume (K) Forecast, by Application 2020 & 2033
- Table 51: Nordics RRIO Operational Amplifier Revenue (undefined) Forecast, by Application 2020 & 2033
- Table 52: Nordics RRIO Operational Amplifier Volume (K) Forecast, by Application 2020 & 2033
- Table 53: Rest of Europe RRIO Operational Amplifier Revenue (undefined) Forecast, by Application 2020 & 2033
- Table 54: Rest of Europe RRIO Operational Amplifier Volume (K) Forecast, by Application 2020 & 2033
- Table 55: Global RRIO Operational Amplifier Revenue undefined Forecast, by Application 2020 & 2033
- Table 56: Global RRIO Operational Amplifier Volume K Forecast, by Application 2020 & 2033
- Table 57: Global RRIO Operational Amplifier Revenue undefined Forecast, by Types 2020 & 2033
- Table 58: Global RRIO Operational Amplifier Volume K Forecast, by Types 2020 & 2033
- Table 59: Global RRIO Operational Amplifier Revenue undefined Forecast, by Country 2020 & 2033
- Table 60: Global RRIO Operational Amplifier Volume K Forecast, by Country 2020 & 2033
- Table 61: Turkey RRIO Operational Amplifier Revenue (undefined) Forecast, by Application 2020 & 2033
- Table 62: Turkey RRIO Operational Amplifier Volume (K) Forecast, by Application 2020 & 2033
- Table 63: Israel RRIO Operational Amplifier Revenue (undefined) Forecast, by Application 2020 & 2033
- Table 64: Israel RRIO Operational Amplifier Volume (K) Forecast, by Application 2020 & 2033
- Table 65: GCC RRIO Operational Amplifier Revenue (undefined) Forecast, by Application 2020 & 2033
- Table 66: GCC RRIO Operational Amplifier Volume (K) Forecast, by Application 2020 & 2033
- Table 67: North Africa RRIO Operational Amplifier Revenue (undefined) Forecast, by Application 2020 & 2033
- Table 68: North Africa RRIO Operational Amplifier Volume (K) Forecast, by Application 2020 & 2033
- Table 69: South Africa RRIO Operational Amplifier Revenue (undefined) Forecast, by Application 2020 & 2033
- Table 70: South Africa RRIO Operational Amplifier Volume (K) Forecast, by Application 2020 & 2033
- Table 71: Rest of Middle East & Africa RRIO Operational Amplifier Revenue (undefined) Forecast, by Application 2020 & 2033
- Table 72: Rest of Middle East & Africa RRIO Operational Amplifier Volume (K) Forecast, by Application 2020 & 2033
- Table 73: Global RRIO Operational Amplifier Revenue undefined Forecast, by Application 2020 & 2033
- Table 74: Global RRIO Operational Amplifier Volume K Forecast, by Application 2020 & 2033
- Table 75: Global RRIO Operational Amplifier Revenue undefined Forecast, by Types 2020 & 2033
- Table 76: Global RRIO Operational Amplifier Volume K Forecast, by Types 2020 & 2033
- Table 77: Global RRIO Operational Amplifier Revenue undefined Forecast, by Country 2020 & 2033
- Table 78: Global RRIO Operational Amplifier Volume K Forecast, by Country 2020 & 2033
- Table 79: China RRIO Operational Amplifier Revenue (undefined) Forecast, by Application 2020 & 2033
- Table 80: China RRIO Operational Amplifier Volume (K) Forecast, by Application 2020 & 2033
- Table 81: India RRIO Operational Amplifier Revenue (undefined) Forecast, by Application 2020 & 2033
- Table 82: India RRIO Operational Amplifier Volume (K) Forecast, by Application 2020 & 2033
- Table 83: Japan RRIO Operational Amplifier Revenue (undefined) Forecast, by Application 2020 & 2033
- Table 84: Japan RRIO Operational Amplifier Volume (K) Forecast, by Application 2020 & 2033
- Table 85: South Korea RRIO Operational Amplifier Revenue (undefined) Forecast, by Application 2020 & 2033
- Table 86: South Korea RRIO Operational Amplifier Volume (K) Forecast, by Application 2020 & 2033
- Table 87: ASEAN RRIO Operational Amplifier Revenue (undefined) Forecast, by Application 2020 & 2033
- Table 88: ASEAN RRIO Operational Amplifier Volume (K) Forecast, by Application 2020 & 2033
- Table 89: Oceania RRIO Operational Amplifier Revenue (undefined) Forecast, by Application 2020 & 2033
- Table 90: Oceania RRIO Operational Amplifier Volume (K) Forecast, by Application 2020 & 2033
- Table 91: Rest of Asia Pacific RRIO Operational Amplifier Revenue (undefined) Forecast, by Application 2020 & 2033
- Table 92: Rest of Asia Pacific RRIO Operational Amplifier Volume (K) Forecast, by Application 2020 & 2033
Frequently Asked Questions
1. What is the projected Compound Annual Growth Rate (CAGR) of the RRIO Operational Amplifier?
The projected CAGR is approximately 4.6%.
2. Which companies are prominent players in the RRIO Operational Amplifier?
Key companies in the market include Texas Instruments, Renesas, Analog Devices, STMicroelectronics, ROHM, Onsemi, Diodes, Nisshinbo Micro Device, Corebai, Shenzhen Enchgip Semiconductor.
3. What are the main segments of the RRIO Operational Amplifier?
The market segments include Application, Types.
4. Can you provide details about the market size?
The market size is estimated to be USD XXX N/A as of 2022.
5. What are some drivers contributing to market growth?
N/A
6. What are the notable trends driving market growth?
N/A
7. Are there any restraints impacting market growth?
N/A
8. Can you provide examples of recent developments in the market?
N/A
9. What pricing options are available for accessing the report?
Pricing options include single-user, multi-user, and enterprise licenses priced at USD 4350.00, USD 6525.00, and USD 8700.00 respectively.
10. Is the market size provided in terms of value or volume?
The market size is provided in terms of value, measured in N/A and volume, measured in K.
11. Are there any specific market keywords associated with the report?
Yes, the market keyword associated with the report is "RRIO Operational Amplifier," which aids in identifying and referencing the specific market segment covered.
12. How do I determine which pricing option suits my needs best?
The pricing options vary based on user requirements and access needs. Individual users may opt for single-user licenses, while businesses requiring broader access may choose multi-user or enterprise licenses for cost-effective access to the report.
13. Are there any additional resources or data provided in the RRIO Operational Amplifier report?
While the report offers comprehensive insights, it's advisable to review the specific contents or supplementary materials provided to ascertain if additional resources or data are available.
14. How can I stay updated on further developments or reports in the RRIO Operational Amplifier?
To stay informed about further developments, trends, and reports in the RRIO Operational Amplifier, consider subscribing to industry newsletters, following relevant companies and organizations, or regularly checking reputable industry news sources and publications.
Methodology
Step 1 - Identification of Relevant Samples Size from Population Database


Step 2 - Approaches for Defining Global Market Size (Value, Volume* & Price*)

Note*: In applicable scenarios
Step 3 - Data Sources
Primary Research
- Web Analytics
- Survey Reports
- Research Institute
- Latest Research Reports
- Opinion Leaders
Secondary Research
- Annual Reports
- White Paper
- Latest Press Release
- Industry Association
- Paid Database
- Investor Presentations

Step 4 - Data Triangulation
Involves using different sources of information in order to increase the validity of a study
These sources are likely to be stakeholders in a program - participants, other researchers, program staff, other community members, and so on.
Then we put all data in single framework & apply various statistical tools to find out the dynamic on the market.
During the analysis stage, feedback from the stakeholder groups would be compared to determine areas of agreement as well as areas of divergence