

Key Insights
The global market for RKN cool containers is experiencing robust growth, driven by the increasing demand for temperature-sensitive pharmaceuticals, biologics, and other healthcare products. The rising global population and increasing prevalence of chronic diseases are fueling this demand, requiring efficient and reliable cold chain logistics solutions. Furthermore, the expansion of e-commerce and the growing preference for online grocery shopping are contributing to market expansion. Technological advancements in container design and monitoring systems, such as improved insulation, real-time temperature tracking, and data logging capabilities, are enhancing the efficiency and safety of cold chain transportation, further boosting market growth. The market is segmented by container type (passive, active), application (pharmaceutical, food & beverage, other), and region. Key players, including va-Q-tec AG, Korean Air Cargo, Lufthansa Cargo, Haier Biomedical, Csafe, Envirotainer AB, VRR, and DoKaSch, are actively investing in R&D and expanding their market presence through strategic partnerships and acquisitions. Competition is expected to intensify, with companies focusing on innovation, cost optimization, and service improvements to gain a competitive edge.
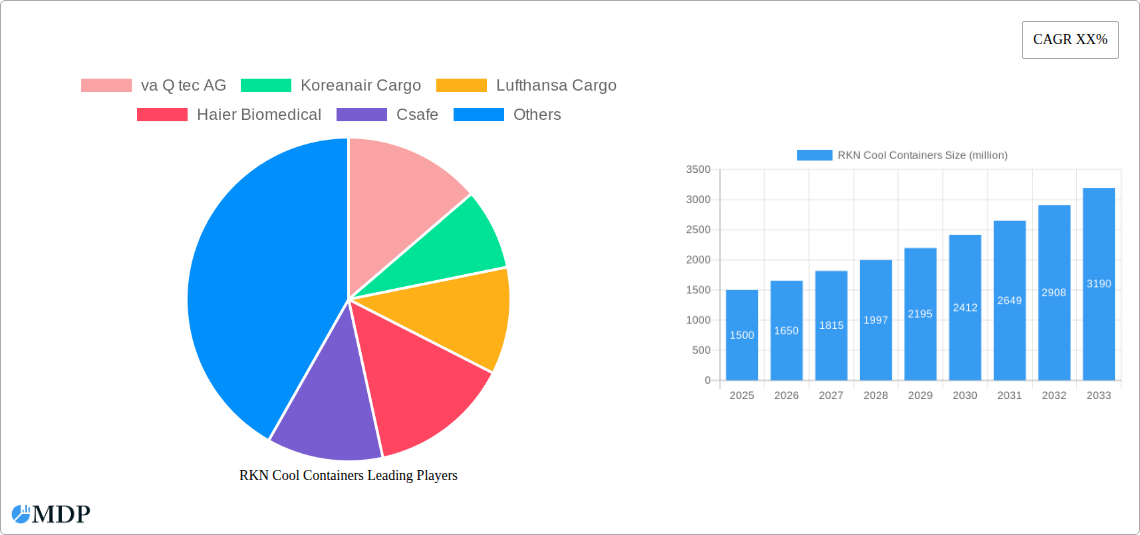
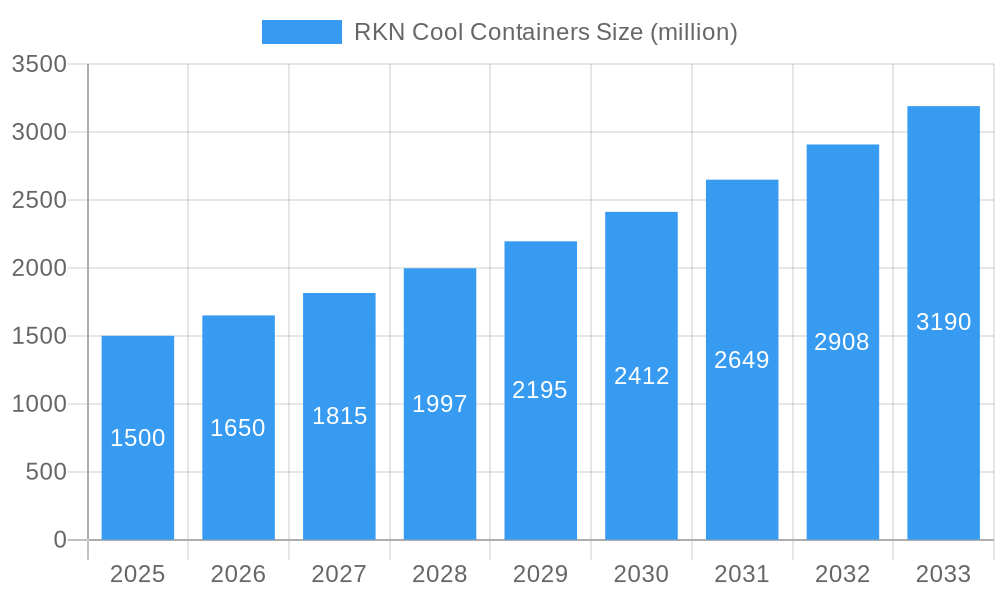
RKN Cool Containers Market Size (In Billion)
Despite the positive outlook, the market faces challenges such as high initial investment costs for advanced containers, stringent regulatory compliance requirements, and the risk of damage or spoilage during transportation. Fluctuations in fuel prices and supply chain disruptions also pose significant hurdles. However, ongoing technological advancements, coupled with the increasing awareness of the importance of maintaining the cold chain for sensitive goods, are expected to mitigate these challenges. The market is projected to witness sustained growth throughout the forecast period (2025-2033), with a healthy Compound Annual Growth Rate (CAGR) leading to a substantial increase in market value. Regional growth will vary depending on factors such as economic development, healthcare infrastructure, and the regulatory environment.
RKN Cool Containers Company Market Share
RKN Cool Containers Market Report: 2019-2033 Forecast
Unlocking Billions in Growth Potential: A Comprehensive Analysis of the RKN Cool Containers Market
This in-depth report provides a comprehensive analysis of the RKN Cool Containers market, offering invaluable insights for industry stakeholders, investors, and businesses seeking to capitalize on its significant growth potential. The report covers the period 2019-2033, with a focus on the 2025-2033 forecast period. We leverage data from the base year 2025 and examine historical data from 2019-2024 to build a robust and accurate predictive model. The market is projected to reach xx million by 2033, presenting substantial opportunities for growth and innovation.
RKN Cool Containers Market Dynamics & Concentration
This section analyzes the competitive landscape of the RKN Cool Containers market, focusing on market concentration, innovation drivers, regulatory frameworks, product substitutes, end-user trends, and mergers & acquisitions (M&A) activities.
The global RKN Cool Containers market is characterized by a moderately concentrated structure, with the top five players holding an estimated xx% market share in 2025. This concentration is primarily driven by the significant capital investment required for R&D, manufacturing, and distribution. Innovation is key, with companies focusing on improving thermal efficiency, durability, and monitoring capabilities. Regulatory frameworks, particularly concerning environmental regulations and safety standards, are significant influencing factors. Product substitutes, such as passive containers and dry ice solutions, are present but offer limited cost-effectiveness and performance compared to RKN containers. End-user trends toward enhanced temperature monitoring and data management are driving market growth. Finally, M&A activity within the sector is modest, with an estimated xx deals recorded between 2019 and 2024.
- Market Share: Top 5 players: xx% in 2025
- M&A Deals (2019-2024): xx
- Key Innovation Drivers: Improved thermal efficiency, enhanced monitoring capabilities, sustainable materials.
- Regulatory Impact: Stringent safety and environmental regulations influence design and operation.
RKN Cool Containers Industry Trends & Analysis
This section dives deep into the key trends shaping the RKN Cool Containers market. The market is experiencing robust growth, driven by the increasing demand for temperature-sensitive pharmaceutical products, the expansion of the global cold chain logistics network, and technological advancements leading to more efficient and reliable containers. The compound annual growth rate (CAGR) is estimated at xx% during the forecast period (2025-2033). Market penetration is increasing across various segments, fueled by the rising adoption of advanced monitoring technologies and the growing awareness of the importance of maintaining product integrity throughout the supply chain. Competitive dynamics are characterized by both innovation and consolidation, with leading players striving to enhance their technological capabilities and expand their market reach. Consumer preferences are shifting towards higher levels of security, transparency, and sustainability in cold chain logistics.
Leading Markets & Segments in RKN Cool Containers
This section identifies the dominant regions and segments within the RKN Cool Containers market. The North American region currently holds the leading position, driven by robust pharmaceutical and healthcare sectors. However, the Asia-Pacific region is projected to experience significant growth over the forecast period, fueled by expanding economies and increasing investments in cold chain infrastructure. Key drivers are outlined below:
- North America: Strong pharmaceutical industry, well-established cold chain infrastructure.
- Asia-Pacific: Rapid economic growth, increasing investments in cold chain logistics.
- Europe: Mature market with stringent regulations driving innovation.
Dominance Analysis: North America's dominance stems from its well-established healthcare sector and advanced cold chain infrastructure. However, Asia-Pacific's rapid economic expansion and increased focus on infrastructure development position it for significant market share gains in the coming years. Europe, while a mature market, continues to contribute significantly driven by stringent regulations fostering innovation.
RKN Cool Containers Product Developments
Recent product developments focus on enhancing thermal efficiency through advanced insulation materials and improved refrigeration systems. The integration of sophisticated monitoring technologies, including real-time temperature tracking and data logging, provides greater visibility and control over the transportation process. These innovations aim to address the industry's growing demands for increased reliability, security, and cost-effectiveness. The introduction of reusable and sustainable containers also contributes to the overall market trend towards environmental responsibility.
Key Drivers of RKN Cool Containers Growth
Several factors are driving the growth of the RKN Cool Containers market. These include the rising demand for temperature-sensitive goods, particularly in the pharmaceutical and food industries. Technological advancements, such as the development of more efficient and reliable refrigeration systems, are also contributing to market expansion. Government regulations aimed at improving the safety and quality of cold chain transportation further fuel market growth. Finally, the ongoing globalization of trade and the increasing importance of efficient supply chain management are creating significant opportunities for growth.
Challenges in the RKN Cool Containers Market
The RKN Cool Containers market faces several challenges, including fluctuating raw material prices impacting production costs. Supply chain disruptions can affect availability and lead times. Intense competition among manufacturers and providers necessitates ongoing investment in research and development to maintain a competitive edge. Lastly, stringent regulatory compliance demands significant resources and expertise. These factors collectively impact profitability and market growth.
Emerging Opportunities in RKN Cool Containers
Emerging opportunities stem from technological breakthroughs in areas like lightweight and energy-efficient materials. The development of improved monitoring systems allowing for proactive management of temperature-sensitive goods during transit is creating new market opportunities. Strategic partnerships between container manufacturers, logistics providers, and technology companies will be crucial in fostering market expansion.
Leading Players in the RKN Cool Containers Sector
Key Milestones in RKN Cool Containers Industry
- 2020: Introduction of xx new container models with enhanced insulation.
- 2022: Significant investment in R&D for sustainable container materials.
- 2023: Launch of real-time temperature monitoring and data analytics platforms.
- 2024: Merger between xx and xx leading to increased market share.
Strategic Outlook for RKN Cool Containers Market
The RKN Cool Containers market exhibits substantial growth potential driven by rising demand, technological advancements, and ongoing globalization. Companies adopting a strategy focused on innovation, operational efficiency, and strategic partnerships are expected to thrive. Investing in cutting-edge technologies, such as AI-powered monitoring and predictive maintenance, will significantly enhance operational efficiency and profitability. The focus on sustainability and reduced environmental impact will further shape the market’s long-term trajectory.
RKN Cool Containers Segmentation
-
1. Application
- 1.1. Drugs
- 1.2. Vaccines
- 1.3. Medicines
- 1.4. Biological Products
- 1.5. Others
-
2. Types
- 2.1. Maximum Payload Below 1000kg
- 2.2. Maximum Payload Above 1000kg
RKN Cool Containers Segmentation By Geography
-
1. North America
- 1.1. United States
- 1.2. Canada
- 1.3. Mexico
-
2. South America
- 2.1. Brazil
- 2.2. Argentina
- 2.3. Rest of South America
-
3. Europe
- 3.1. United Kingdom
- 3.2. Germany
- 3.3. France
- 3.4. Italy
- 3.5. Spain
- 3.6. Russia
- 3.7. Benelux
- 3.8. Nordics
- 3.9. Rest of Europe
-
4. Middle East & Africa
- 4.1. Turkey
- 4.2. Israel
- 4.3. GCC
- 4.4. North Africa
- 4.5. South Africa
- 4.6. Rest of Middle East & Africa
-
5. Asia Pacific
- 5.1. China
- 5.2. India
- 5.3. Japan
- 5.4. South Korea
- 5.5. ASEAN
- 5.6. Oceania
- 5.7. Rest of Asia Pacific
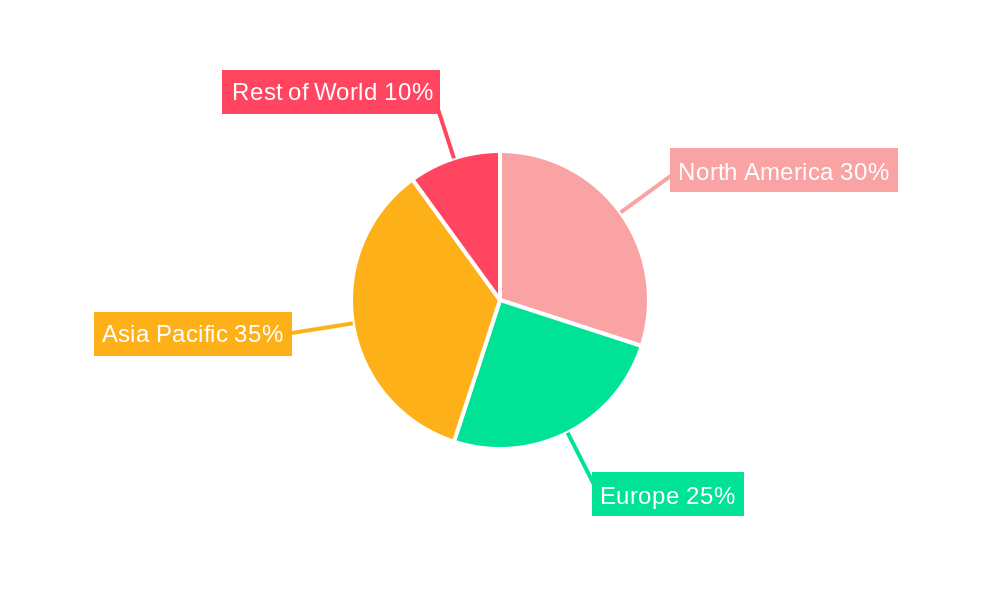
RKN Cool Containers Regional Market Share
Geographic Coverage of RKN Cool Containers
RKN Cool Containers REPORT HIGHLIGHTS
| Aspects | Details |
|---|---|
| Study Period | 2020-2034 |
| Base Year | 2025 |
| Estimated Year | 2026 |
| Forecast Period | 2026-2034 |
| Historical Period | 2020-2025 |
| Growth Rate | CAGR of 7.2% from 2020-2034 |
| Segmentation |
|
Table of Contents
- 1. Introduction
- 1.1. Research Scope
- 1.2. Market Segmentation
- 1.3. Research Objective
- 1.4. Definitions and Assumptions
- 2. Executive Summary
- 2.1. Market Snapshot
- 3. Market Dynamics
- 3.1. Market Drivers
- 3.2. Market Restrains
- 3.3. Market Trends
- 3.4. Market Opportunities
- 4. Market Factor Analysis
- 4.1. Porters Five Forces
- 4.1.1. Bargaining Power of Suppliers
- 4.1.2. Bargaining Power of Buyers
- 4.1.3. Threat of New Entrants
- 4.1.4. Threat of Substitutes
- 4.1.5. Competitive Rivalry
- 4.2. PESTEL analysis
- 4.3. BCG Analysis
- 4.3.1. Stars (High Growth, High Market Share)
- 4.3.2. Cash Cows (Low Growth, High Market Share)
- 4.3.3. Question Mark (High Growth, Low Market Share)
- 4.3.4. Dogs (Low Growth, Low Market Share)
- 4.4. Ansoff Matrix Analysis
- 4.5. Supply Chain Analysis
- 4.6. Regulatory Landscape
- 4.7. Current Market Potential and Opportunity Assessment (TAM–SAM–SOM Framework)
- 4.8. MDP Analyst Note
- 4.1. Porters Five Forces
- 5. Market Analysis, Insights and Forecast 2021-2033
- 5.1. Market Analysis, Insights and Forecast - by Application
- 5.1.1. Drugs
- 5.1.2. Vaccines
- 5.1.3. Medicines
- 5.1.4. Biological Products
- 5.1.5. Others
- 5.2. Market Analysis, Insights and Forecast - by Types
- 5.2.1. Maximum Payload Below 1000kg
- 5.2.2. Maximum Payload Above 1000kg
- 5.3. Market Analysis, Insights and Forecast - by Region
- 5.3.1. North America
- 5.3.2. South America
- 5.3.3. Europe
- 5.3.4. Middle East & Africa
- 5.3.5. Asia Pacific
- 5.1. Market Analysis, Insights and Forecast - by Application
- 6. Global RKN Cool Containers Analysis, Insights and Forecast, 2021-2033
- 6.1. Market Analysis, Insights and Forecast - by Application
- 6.1.1. Drugs
- 6.1.2. Vaccines
- 6.1.3. Medicines
- 6.1.4. Biological Products
- 6.1.5. Others
- 6.2. Market Analysis, Insights and Forecast - by Types
- 6.2.1. Maximum Payload Below 1000kg
- 6.2.2. Maximum Payload Above 1000kg
- 6.1. Market Analysis, Insights and Forecast - by Application
- 7. North America RKN Cool Containers Analysis, Insights and Forecast, 2020-2032
- 7.1. Market Analysis, Insights and Forecast - by Application
- 7.1.1. Drugs
- 7.1.2. Vaccines
- 7.1.3. Medicines
- 7.1.4. Biological Products
- 7.1.5. Others
- 7.2. Market Analysis, Insights and Forecast - by Types
- 7.2.1. Maximum Payload Below 1000kg
- 7.2.2. Maximum Payload Above 1000kg
- 7.1. Market Analysis, Insights and Forecast - by Application
- 8. South America RKN Cool Containers Analysis, Insights and Forecast, 2020-2032
- 8.1. Market Analysis, Insights and Forecast - by Application
- 8.1.1. Drugs
- 8.1.2. Vaccines
- 8.1.3. Medicines
- 8.1.4. Biological Products
- 8.1.5. Others
- 8.2. Market Analysis, Insights and Forecast - by Types
- 8.2.1. Maximum Payload Below 1000kg
- 8.2.2. Maximum Payload Above 1000kg
- 8.1. Market Analysis, Insights and Forecast - by Application
- 9. Europe RKN Cool Containers Analysis, Insights and Forecast, 2020-2032
- 9.1. Market Analysis, Insights and Forecast - by Application
- 9.1.1. Drugs
- 9.1.2. Vaccines
- 9.1.3. Medicines
- 9.1.4. Biological Products
- 9.1.5. Others
- 9.2. Market Analysis, Insights and Forecast - by Types
- 9.2.1. Maximum Payload Below 1000kg
- 9.2.2. Maximum Payload Above 1000kg
- 9.1. Market Analysis, Insights and Forecast - by Application
- 10. Middle East & Africa RKN Cool Containers Analysis, Insights and Forecast, 2020-2032
- 10.1. Market Analysis, Insights and Forecast - by Application
- 10.1.1. Drugs
- 10.1.2. Vaccines
- 10.1.3. Medicines
- 10.1.4. Biological Products
- 10.1.5. Others
- 10.2. Market Analysis, Insights and Forecast - by Types
- 10.2.1. Maximum Payload Below 1000kg
- 10.2.2. Maximum Payload Above 1000kg
- 10.1. Market Analysis, Insights and Forecast - by Application
- 11. Asia Pacific RKN Cool Containers Analysis, Insights and Forecast, 2020-2032
- 11.1. Market Analysis, Insights and Forecast - by Application
- 11.1.1. Drugs
- 11.1.2. Vaccines
- 11.1.3. Medicines
- 11.1.4. Biological Products
- 11.1.5. Others
- 11.2. Market Analysis, Insights and Forecast - by Types
- 11.2.1. Maximum Payload Below 1000kg
- 11.2.2. Maximum Payload Above 1000kg
- 11.1. Market Analysis, Insights and Forecast - by Application
- 12. Competitive Analysis
- 12.1. Company Profiles
- 12.1.1 va Q tec AG
- 12.1.1.1. Company Overview
- 12.1.1.2. Products
- 12.1.1.3. Company Financials
- 12.1.1.4. SWOT Analysis
- 12.1.2 Koreanair Cargo
- 12.1.2.1. Company Overview
- 12.1.2.2. Products
- 12.1.2.3. Company Financials
- 12.1.2.4. SWOT Analysis
- 12.1.3 Lufthansa Cargo
- 12.1.3.1. Company Overview
- 12.1.3.2. Products
- 12.1.3.3. Company Financials
- 12.1.3.4. SWOT Analysis
- 12.1.4 Haier Biomedical
- 12.1.4.1. Company Overview
- 12.1.4.2. Products
- 12.1.4.3. Company Financials
- 12.1.4.4. SWOT Analysis
- 12.1.5 Csafe
- 12.1.5.1. Company Overview
- 12.1.5.2. Products
- 12.1.5.3. Company Financials
- 12.1.5.4. SWOT Analysis
- 12.1.6 Envirotainer AB
- 12.1.6.1. Company Overview
- 12.1.6.2. Products
- 12.1.6.3. Company Financials
- 12.1.6.4. SWOT Analysis
- 12.1.7 VRR
- 12.1.7.1. Company Overview
- 12.1.7.2. Products
- 12.1.7.3. Company Financials
- 12.1.7.4. SWOT Analysis
- 12.1.8 DoKaSch
- 12.1.8.1. Company Overview
- 12.1.8.2. Products
- 12.1.8.3. Company Financials
- 12.1.8.4. SWOT Analysis
- 12.1.1 va Q tec AG
- 12.2. Market Entropy
- 12.2.1 Company's Key Areas Served
- 12.2.2 Recent Developments
- 12.3. Company Market Share Analysis 2025
- 12.3.1 Top 5 Companies Market Share Analysis
- 12.3.2 Top 3 Companies Market Share Analysis
- 12.4. List of Potential Customers
- 13. Research Methodology
List of Figures
- Figure 1: Global RKN Cool Containers Revenue Breakdown (undefined, %) by Region 2025 & 2033
- Figure 2: Global RKN Cool Containers Volume Breakdown (K, %) by Region 2025 & 2033
- Figure 3: North America RKN Cool Containers Revenue (undefined), by Application 2025 & 2033
- Figure 4: North America RKN Cool Containers Volume (K), by Application 2025 & 2033
- Figure 5: North America RKN Cool Containers Revenue Share (%), by Application 2025 & 2033
- Figure 6: North America RKN Cool Containers Volume Share (%), by Application 2025 & 2033
- Figure 7: North America RKN Cool Containers Revenue (undefined), by Types 2025 & 2033
- Figure 8: North America RKN Cool Containers Volume (K), by Types 2025 & 2033
- Figure 9: North America RKN Cool Containers Revenue Share (%), by Types 2025 & 2033
- Figure 10: North America RKN Cool Containers Volume Share (%), by Types 2025 & 2033
- Figure 11: North America RKN Cool Containers Revenue (undefined), by Country 2025 & 2033
- Figure 12: North America RKN Cool Containers Volume (K), by Country 2025 & 2033
- Figure 13: North America RKN Cool Containers Revenue Share (%), by Country 2025 & 2033
- Figure 14: North America RKN Cool Containers Volume Share (%), by Country 2025 & 2033
- Figure 15: South America RKN Cool Containers Revenue (undefined), by Application 2025 & 2033
- Figure 16: South America RKN Cool Containers Volume (K), by Application 2025 & 2033
- Figure 17: South America RKN Cool Containers Revenue Share (%), by Application 2025 & 2033
- Figure 18: South America RKN Cool Containers Volume Share (%), by Application 2025 & 2033
- Figure 19: South America RKN Cool Containers Revenue (undefined), by Types 2025 & 2033
- Figure 20: South America RKN Cool Containers Volume (K), by Types 2025 & 2033
- Figure 21: South America RKN Cool Containers Revenue Share (%), by Types 2025 & 2033
- Figure 22: South America RKN Cool Containers Volume Share (%), by Types 2025 & 2033
- Figure 23: South America RKN Cool Containers Revenue (undefined), by Country 2025 & 2033
- Figure 24: South America RKN Cool Containers Volume (K), by Country 2025 & 2033
- Figure 25: South America RKN Cool Containers Revenue Share (%), by Country 2025 & 2033
- Figure 26: South America RKN Cool Containers Volume Share (%), by Country 2025 & 2033
- Figure 27: Europe RKN Cool Containers Revenue (undefined), by Application 2025 & 2033
- Figure 28: Europe RKN Cool Containers Volume (K), by Application 2025 & 2033
- Figure 29: Europe RKN Cool Containers Revenue Share (%), by Application 2025 & 2033
- Figure 30: Europe RKN Cool Containers Volume Share (%), by Application 2025 & 2033
- Figure 31: Europe RKN Cool Containers Revenue (undefined), by Types 2025 & 2033
- Figure 32: Europe RKN Cool Containers Volume (K), by Types 2025 & 2033
- Figure 33: Europe RKN Cool Containers Revenue Share (%), by Types 2025 & 2033
- Figure 34: Europe RKN Cool Containers Volume Share (%), by Types 2025 & 2033
- Figure 35: Europe RKN Cool Containers Revenue (undefined), by Country 2025 & 2033
- Figure 36: Europe RKN Cool Containers Volume (K), by Country 2025 & 2033
- Figure 37: Europe RKN Cool Containers Revenue Share (%), by Country 2025 & 2033
- Figure 38: Europe RKN Cool Containers Volume Share (%), by Country 2025 & 2033
- Figure 39: Middle East & Africa RKN Cool Containers Revenue (undefined), by Application 2025 & 2033
- Figure 40: Middle East & Africa RKN Cool Containers Volume (K), by Application 2025 & 2033
- Figure 41: Middle East & Africa RKN Cool Containers Revenue Share (%), by Application 2025 & 2033
- Figure 42: Middle East & Africa RKN Cool Containers Volume Share (%), by Application 2025 & 2033
- Figure 43: Middle East & Africa RKN Cool Containers Revenue (undefined), by Types 2025 & 2033
- Figure 44: Middle East & Africa RKN Cool Containers Volume (K), by Types 2025 & 2033
- Figure 45: Middle East & Africa RKN Cool Containers Revenue Share (%), by Types 2025 & 2033
- Figure 46: Middle East & Africa RKN Cool Containers Volume Share (%), by Types 2025 & 2033
- Figure 47: Middle East & Africa RKN Cool Containers Revenue (undefined), by Country 2025 & 2033
- Figure 48: Middle East & Africa RKN Cool Containers Volume (K), by Country 2025 & 2033
- Figure 49: Middle East & Africa RKN Cool Containers Revenue Share (%), by Country 2025 & 2033
- Figure 50: Middle East & Africa RKN Cool Containers Volume Share (%), by Country 2025 & 2033
- Figure 51: Asia Pacific RKN Cool Containers Revenue (undefined), by Application 2025 & 2033
- Figure 52: Asia Pacific RKN Cool Containers Volume (K), by Application 2025 & 2033
- Figure 53: Asia Pacific RKN Cool Containers Revenue Share (%), by Application 2025 & 2033
- Figure 54: Asia Pacific RKN Cool Containers Volume Share (%), by Application 2025 & 2033
- Figure 55: Asia Pacific RKN Cool Containers Revenue (undefined), by Types 2025 & 2033
- Figure 56: Asia Pacific RKN Cool Containers Volume (K), by Types 2025 & 2033
- Figure 57: Asia Pacific RKN Cool Containers Revenue Share (%), by Types 2025 & 2033
- Figure 58: Asia Pacific RKN Cool Containers Volume Share (%), by Types 2025 & 2033
- Figure 59: Asia Pacific RKN Cool Containers Revenue (undefined), by Country 2025 & 2033
- Figure 60: Asia Pacific RKN Cool Containers Volume (K), by Country 2025 & 2033
- Figure 61: Asia Pacific RKN Cool Containers Revenue Share (%), by Country 2025 & 2033
- Figure 62: Asia Pacific RKN Cool Containers Volume Share (%), by Country 2025 & 2033
List of Tables
- Table 1: Global RKN Cool Containers Revenue undefined Forecast, by Application 2020 & 2033
- Table 2: Global RKN Cool Containers Volume K Forecast, by Application 2020 & 2033
- Table 3: Global RKN Cool Containers Revenue undefined Forecast, by Types 2020 & 2033
- Table 4: Global RKN Cool Containers Volume K Forecast, by Types 2020 & 2033
- Table 5: Global RKN Cool Containers Revenue undefined Forecast, by Region 2020 & 2033
- Table 6: Global RKN Cool Containers Volume K Forecast, by Region 2020 & 2033
- Table 7: Global RKN Cool Containers Revenue undefined Forecast, by Application 2020 & 2033
- Table 8: Global RKN Cool Containers Volume K Forecast, by Application 2020 & 2033
- Table 9: Global RKN Cool Containers Revenue undefined Forecast, by Types 2020 & 2033
- Table 10: Global RKN Cool Containers Volume K Forecast, by Types 2020 & 2033
- Table 11: Global RKN Cool Containers Revenue undefined Forecast, by Country 2020 & 2033
- Table 12: Global RKN Cool Containers Volume K Forecast, by Country 2020 & 2033
- Table 13: United States RKN Cool Containers Revenue (undefined) Forecast, by Application 2020 & 2033
- Table 14: United States RKN Cool Containers Volume (K) Forecast, by Application 2020 & 2033
- Table 15: Canada RKN Cool Containers Revenue (undefined) Forecast, by Application 2020 & 2033
- Table 16: Canada RKN Cool Containers Volume (K) Forecast, by Application 2020 & 2033
- Table 17: Mexico RKN Cool Containers Revenue (undefined) Forecast, by Application 2020 & 2033
- Table 18: Mexico RKN Cool Containers Volume (K) Forecast, by Application 2020 & 2033
- Table 19: Global RKN Cool Containers Revenue undefined Forecast, by Application 2020 & 2033
- Table 20: Global RKN Cool Containers Volume K Forecast, by Application 2020 & 2033
- Table 21: Global RKN Cool Containers Revenue undefined Forecast, by Types 2020 & 2033
- Table 22: Global RKN Cool Containers Volume K Forecast, by Types 2020 & 2033
- Table 23: Global RKN Cool Containers Revenue undefined Forecast, by Country 2020 & 2033
- Table 24: Global RKN Cool Containers Volume K Forecast, by Country 2020 & 2033
- Table 25: Brazil RKN Cool Containers Revenue (undefined) Forecast, by Application 2020 & 2033
- Table 26: Brazil RKN Cool Containers Volume (K) Forecast, by Application 2020 & 2033
- Table 27: Argentina RKN Cool Containers Revenue (undefined) Forecast, by Application 2020 & 2033
- Table 28: Argentina RKN Cool Containers Volume (K) Forecast, by Application 2020 & 2033
- Table 29: Rest of South America RKN Cool Containers Revenue (undefined) Forecast, by Application 2020 & 2033
- Table 30: Rest of South America RKN Cool Containers Volume (K) Forecast, by Application 2020 & 2033
- Table 31: Global RKN Cool Containers Revenue undefined Forecast, by Application 2020 & 2033
- Table 32: Global RKN Cool Containers Volume K Forecast, by Application 2020 & 2033
- Table 33: Global RKN Cool Containers Revenue undefined Forecast, by Types 2020 & 2033
- Table 34: Global RKN Cool Containers Volume K Forecast, by Types 2020 & 2033
- Table 35: Global RKN Cool Containers Revenue undefined Forecast, by Country 2020 & 2033
- Table 36: Global RKN Cool Containers Volume K Forecast, by Country 2020 & 2033
- Table 37: United Kingdom RKN Cool Containers Revenue (undefined) Forecast, by Application 2020 & 2033
- Table 38: United Kingdom RKN Cool Containers Volume (K) Forecast, by Application 2020 & 2033
- Table 39: Germany RKN Cool Containers Revenue (undefined) Forecast, by Application 2020 & 2033
- Table 40: Germany RKN Cool Containers Volume (K) Forecast, by Application 2020 & 2033
- Table 41: France RKN Cool Containers Revenue (undefined) Forecast, by Application 2020 & 2033
- Table 42: France RKN Cool Containers Volume (K) Forecast, by Application 2020 & 2033
- Table 43: Italy RKN Cool Containers Revenue (undefined) Forecast, by Application 2020 & 2033
- Table 44: Italy RKN Cool Containers Volume (K) Forecast, by Application 2020 & 2033
- Table 45: Spain RKN Cool Containers Revenue (undefined) Forecast, by Application 2020 & 2033
- Table 46: Spain RKN Cool Containers Volume (K) Forecast, by Application 2020 & 2033
- Table 47: Russia RKN Cool Containers Revenue (undefined) Forecast, by Application 2020 & 2033
- Table 48: Russia RKN Cool Containers Volume (K) Forecast, by Application 2020 & 2033
- Table 49: Benelux RKN Cool Containers Revenue (undefined) Forecast, by Application 2020 & 2033
- Table 50: Benelux RKN Cool Containers Volume (K) Forecast, by Application 2020 & 2033
- Table 51: Nordics RKN Cool Containers Revenue (undefined) Forecast, by Application 2020 & 2033
- Table 52: Nordics RKN Cool Containers Volume (K) Forecast, by Application 2020 & 2033
- Table 53: Rest of Europe RKN Cool Containers Revenue (undefined) Forecast, by Application 2020 & 2033
- Table 54: Rest of Europe RKN Cool Containers Volume (K) Forecast, by Application 2020 & 2033
- Table 55: Global RKN Cool Containers Revenue undefined Forecast, by Application 2020 & 2033
- Table 56: Global RKN Cool Containers Volume K Forecast, by Application 2020 & 2033
- Table 57: Global RKN Cool Containers Revenue undefined Forecast, by Types 2020 & 2033
- Table 58: Global RKN Cool Containers Volume K Forecast, by Types 2020 & 2033
- Table 59: Global RKN Cool Containers Revenue undefined Forecast, by Country 2020 & 2033
- Table 60: Global RKN Cool Containers Volume K Forecast, by Country 2020 & 2033
- Table 61: Turkey RKN Cool Containers Revenue (undefined) Forecast, by Application 2020 & 2033
- Table 62: Turkey RKN Cool Containers Volume (K) Forecast, by Application 2020 & 2033
- Table 63: Israel RKN Cool Containers Revenue (undefined) Forecast, by Application 2020 & 2033
- Table 64: Israel RKN Cool Containers Volume (K) Forecast, by Application 2020 & 2033
- Table 65: GCC RKN Cool Containers Revenue (undefined) Forecast, by Application 2020 & 2033
- Table 66: GCC RKN Cool Containers Volume (K) Forecast, by Application 2020 & 2033
- Table 67: North Africa RKN Cool Containers Revenue (undefined) Forecast, by Application 2020 & 2033
- Table 68: North Africa RKN Cool Containers Volume (K) Forecast, by Application 2020 & 2033
- Table 69: South Africa RKN Cool Containers Revenue (undefined) Forecast, by Application 2020 & 2033
- Table 70: South Africa RKN Cool Containers Volume (K) Forecast, by Application 2020 & 2033
- Table 71: Rest of Middle East & Africa RKN Cool Containers Revenue (undefined) Forecast, by Application 2020 & 2033
- Table 72: Rest of Middle East & Africa RKN Cool Containers Volume (K) Forecast, by Application 2020 & 2033
- Table 73: Global RKN Cool Containers Revenue undefined Forecast, by Application 2020 & 2033
- Table 74: Global RKN Cool Containers Volume K Forecast, by Application 2020 & 2033
- Table 75: Global RKN Cool Containers Revenue undefined Forecast, by Types 2020 & 2033
- Table 76: Global RKN Cool Containers Volume K Forecast, by Types 2020 & 2033
- Table 77: Global RKN Cool Containers Revenue undefined Forecast, by Country 2020 & 2033
- Table 78: Global RKN Cool Containers Volume K Forecast, by Country 2020 & 2033
- Table 79: China RKN Cool Containers Revenue (undefined) Forecast, by Application 2020 & 2033
- Table 80: China RKN Cool Containers Volume (K) Forecast, by Application 2020 & 2033
- Table 81: India RKN Cool Containers Revenue (undefined) Forecast, by Application 2020 & 2033
- Table 82: India RKN Cool Containers Volume (K) Forecast, by Application 2020 & 2033
- Table 83: Japan RKN Cool Containers Revenue (undefined) Forecast, by Application 2020 & 2033
- Table 84: Japan RKN Cool Containers Volume (K) Forecast, by Application 2020 & 2033
- Table 85: South Korea RKN Cool Containers Revenue (undefined) Forecast, by Application 2020 & 2033
- Table 86: South Korea RKN Cool Containers Volume (K) Forecast, by Application 2020 & 2033
- Table 87: ASEAN RKN Cool Containers Revenue (undefined) Forecast, by Application 2020 & 2033
- Table 88: ASEAN RKN Cool Containers Volume (K) Forecast, by Application 2020 & 2033
- Table 89: Oceania RKN Cool Containers Revenue (undefined) Forecast, by Application 2020 & 2033
- Table 90: Oceania RKN Cool Containers Volume (K) Forecast, by Application 2020 & 2033
- Table 91: Rest of Asia Pacific RKN Cool Containers Revenue (undefined) Forecast, by Application 2020 & 2033
- Table 92: Rest of Asia Pacific RKN Cool Containers Volume (K) Forecast, by Application 2020 & 2033
Frequently Asked Questions
1. What is the projected Compound Annual Growth Rate (CAGR) of the RKN Cool Containers?
The projected CAGR is approximately 7.2%.
2. Which companies are prominent players in the RKN Cool Containers?
Key companies in the market include va Q tec AG, Koreanair Cargo, Lufthansa Cargo, Haier Biomedical, Csafe, Envirotainer AB, VRR, DoKaSch.
3. What are the main segments of the RKN Cool Containers?
The market segments include Application, Types.
4. Can you provide details about the market size?
The market size is estimated to be USD XXX N/A as of 2022.
5. What are some drivers contributing to market growth?
N/A
6. What are the notable trends driving market growth?
N/A
7. Are there any restraints impacting market growth?
N/A
8. Can you provide examples of recent developments in the market?
N/A
9. What pricing options are available for accessing the report?
Pricing options include single-user, multi-user, and enterprise licenses priced at USD 3950.00, USD 5925.00, and USD 7900.00 respectively.
10. Is the market size provided in terms of value or volume?
The market size is provided in terms of value, measured in N/A and volume, measured in K.
11. Are there any specific market keywords associated with the report?
Yes, the market keyword associated with the report is "RKN Cool Containers," which aids in identifying and referencing the specific market segment covered.
12. How do I determine which pricing option suits my needs best?
The pricing options vary based on user requirements and access needs. Individual users may opt for single-user licenses, while businesses requiring broader access may choose multi-user or enterprise licenses for cost-effective access to the report.
13. Are there any additional resources or data provided in the RKN Cool Containers report?
While the report offers comprehensive insights, it's advisable to review the specific contents or supplementary materials provided to ascertain if additional resources or data are available.
14. How can I stay updated on further developments or reports in the RKN Cool Containers?
To stay informed about further developments, trends, and reports in the RKN Cool Containers, consider subscribing to industry newsletters, following relevant companies and organizations, or regularly checking reputable industry news sources and publications.
Methodology
Step 1 - Identification of Relevant Samples Size from Population Database


Step 2 - Approaches for Defining Global Market Size (Value, Volume* & Price*)

Note*: In applicable scenarios
Step 3 - Data Sources
Primary Research
- Web Analytics
- Survey Reports
- Research Institute
- Latest Research Reports
- Opinion Leaders
Secondary Research
- Annual Reports
- White Paper
- Latest Press Release
- Industry Association
- Paid Database
- Investor Presentations

Step 4 - Data Triangulation
Involves using different sources of information in order to increase the validity of a study
These sources are likely to be stakeholders in a program - participants, other researchers, program staff, other community members, and so on.
Then we put all data in single framework & apply various statistical tools to find out the dynamic on the market.
During the analysis stage, feedback from the stakeholder groups would be compared to determine areas of agreement as well as areas of divergence