

Key Insights
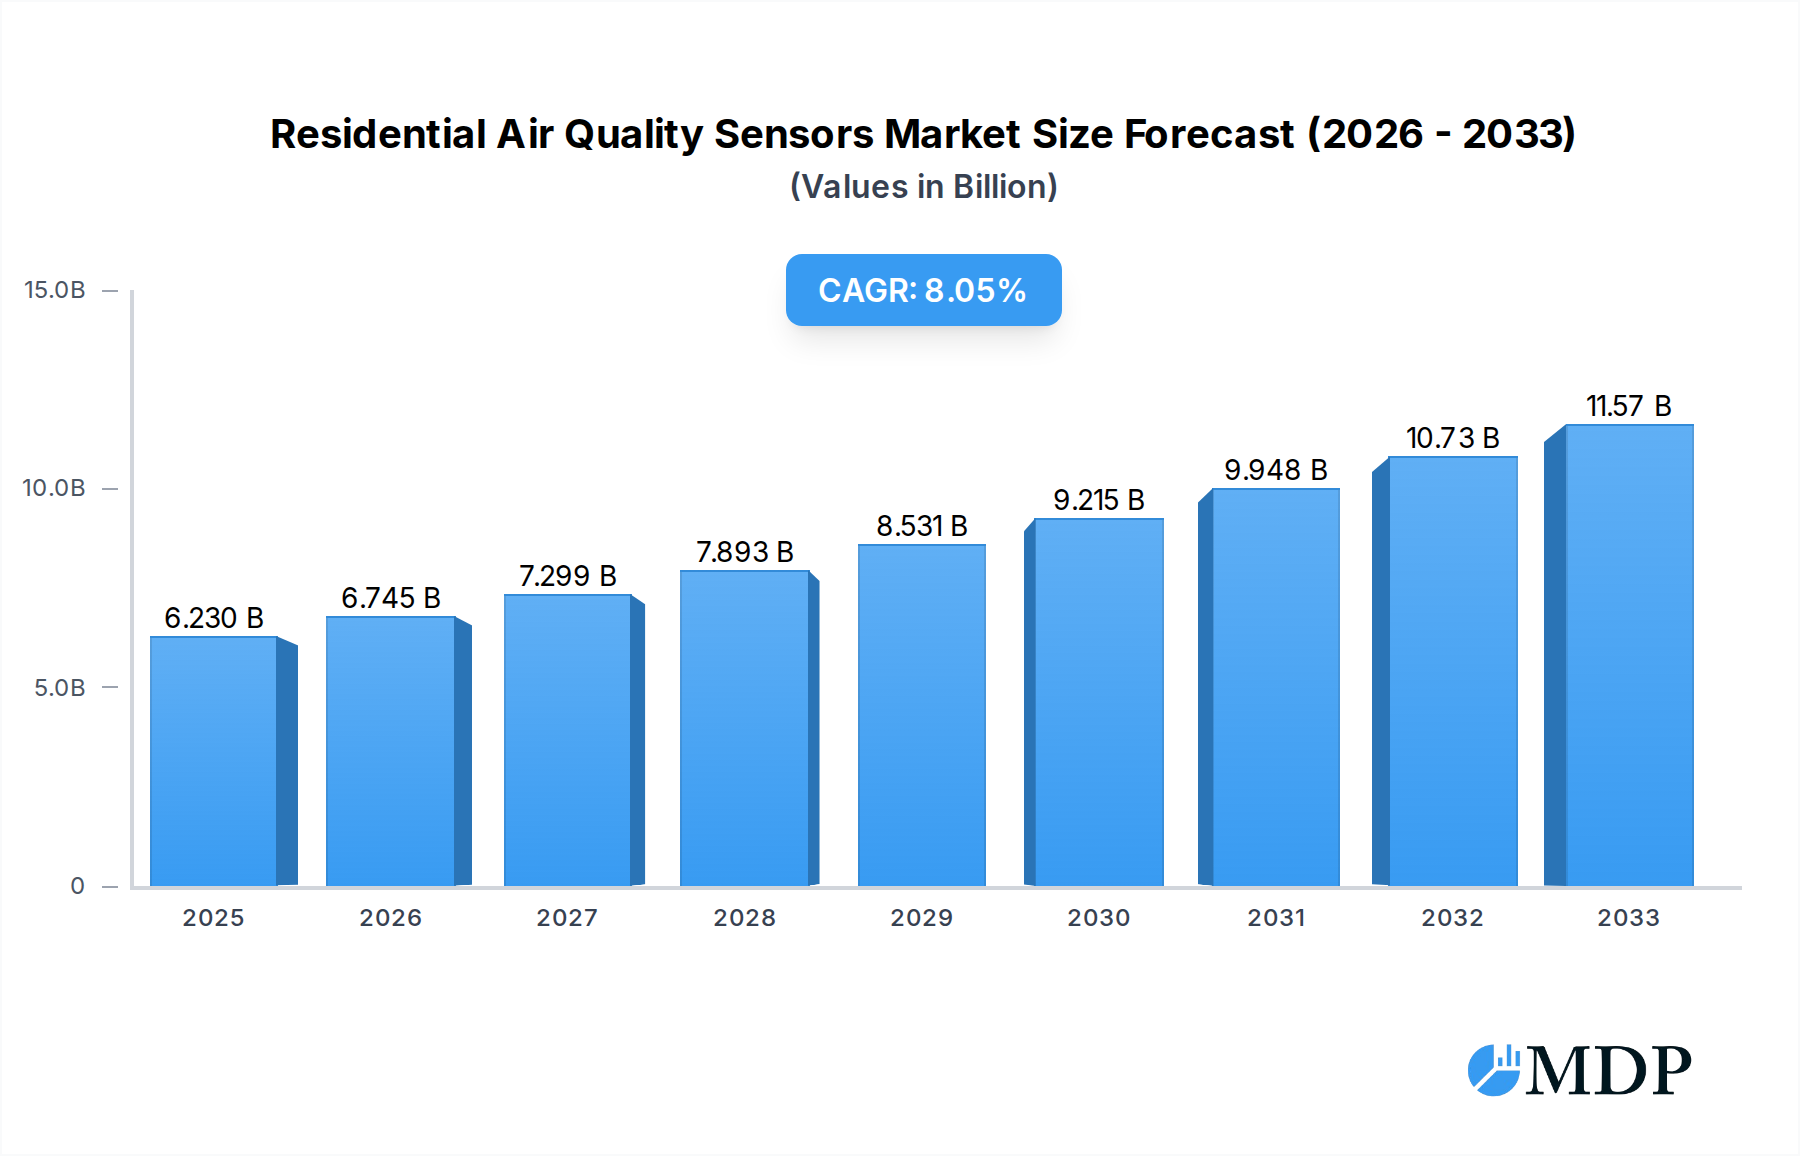
The Residential Air Quality Sensors market is poised for significant expansion, projected to reach a substantial USD 6.23 billion in 2025. This growth is fueled by an increasing global awareness of indoor air pollution's detrimental effects on health, driving demand for smart home devices that monitor and manage air quality. The market is expected to experience a robust CAGR of 8.3% throughout the forecast period of 2025-2033. Key growth drivers include rising disposable incomes, enabling consumers to invest in advanced home monitoring systems, and the escalating prevalence of respiratory ailments, allergies, and asthma, which directly correlates with the need for cleaner indoor environments. Furthermore, technological advancements are leading to the development of more sophisticated, accurate, and affordable sensors, including multi-gas monitoring solutions, making them accessible to a wider consumer base. The integration of these sensors into broader smart home ecosystems further enhances their appeal, offering seamless control and automation for healthier living spaces.

Residential Air Quality Sensors Market Size (In Billion)
The market landscape is characterized by a dynamic interplay of innovative companies and evolving consumer preferences across various applications. Key applications such as the restroom, kitchen, living room, bedroom, and bathroom are all witnessing increased adoption of air quality sensors. The demand for both single-gas and multi-gas monitoring sensors is on the rise, with multi-gas sensors offering comprehensive insights into a range of pollutants like VOCs, PM2.5, CO2, and formaldehyde. Geographically, North America and Europe currently lead the market due to high disposable incomes and a strong emphasis on health and wellness, but the Asia Pacific region is emerging as a significant growth frontier, driven by rapid urbanization, industrialization, and a burgeoning middle class with increasing health consciousness. This market is expected to see sustained innovation, with companies like Foobot, Nest, and Laser Egg at the forefront of developing user-friendly and feature-rich solutions to address the growing consumer need for healthy indoor air.
Residential Air Quality Sensors Company Market Share
This comprehensive report, "Residential Air Quality Sensors Market: Dynamics, Trends, and Future Outlook 2019–2033," offers an in-depth analysis of the rapidly expanding global market for residential air quality monitoring solutions. With a study period spanning from 2019 to 2033, a base and estimated year of 2025, and a forecast period from 2025 to 2033, this report is essential for stakeholders seeking to capitalize on this billion-dollar industry. We delve into market dynamics, innovative trends, leading segments, product developments, key growth drivers, challenges, emerging opportunities, competitive landscape, pivotal milestones, and a strategic outlook, providing actionable insights for sustained success.
Residential Air Quality Sensors Market Dynamics & Concentration
The residential air quality sensors market is characterized by dynamic evolution and increasing concentration among key players. Innovation remains a primary driver, fueled by growing consumer awareness of indoor air pollution's health implications and the desire for healthier living environments. Regulatory frameworks, while still developing in some regions, are increasingly pushing for better indoor air quality standards, indirectly boosting sensor adoption. Product substitutes exist, such as basic air purifiers without monitoring capabilities, but the trend is shifting towards integrated, data-driven solutions. End-user trends highlight a burgeoning demand for smart home integration, intuitive user interfaces, and actionable data insights. Mergers and acquisitions (M&A) activities are on the rise as larger companies seek to consolidate market share and acquire innovative technologies. For instance, the historical period saw an estimated Billion M&A deals, indicating a growing interest in market consolidation. Leading players like Foobot, Nest, and Laser Egg command significant market share, estimated at over Billion combined.
- Market Concentration: Moderately concentrated with a few dominant players and a growing number of niche innovators.
- Innovation Drivers:
- Rising health consciousness regarding indoor air quality.
- Advancements in sensor technology (IoT, AI integration).
- Increasing adoption of smart home ecosystems.
- Regulatory Frameworks: Growing influence of building codes and health standards promoting air quality monitoring.
- Product Substitutes: Basic air purifiers, standalone CO2 monitors.
- End-User Trends: Demand for real-time data, mobile app integration, personalized health recommendations.
- M&A Activities: Increasing, with an estimated Billion deals recorded during the historical period.
Residential Air Quality Sensors Industry Trends & Analysis
The residential air quality sensors industry is experiencing robust growth, projected to reach Billion by the end of the forecast period. This expansion is propelled by a confluence of factors, including heightened public awareness regarding the detrimental health effects of poor indoor air quality, such as respiratory issues, allergies, and cognitive impairment. The increasing prevalence of smart home technology and the Internet of Things (IoT) further accelerates market penetration, as consumers seek integrated solutions for comprehensive home monitoring and control. Technological advancements are central to this growth, with manufacturers continuously innovating to develop more accurate, affordable, and feature-rich sensors. This includes the integration of artificial intelligence (AI) for predictive analysis and personalized recommendations, as well as the development of multi-gas monitoring sensors capable of detecting a wider range of pollutants.
Consumer preferences are evolving, with a strong inclination towards user-friendly devices that provide actionable insights rather than just raw data. The demand for sleek, aesthetically pleasing designs that blend seamlessly into home decor is also a significant factor. The competitive landscape is intensifying, with established smart home brands and dedicated air quality sensor manufacturers vying for market dominance. The projected Compound Annual Growth Rate (CAGR) for the residential air quality sensors market is estimated at Billion% over the forecast period, indicating a sustained upward trajectory. Market penetration is expected to rise significantly, reaching over Billion% of households in developed nations by 2033, driven by falling unit costs and increased availability. The development of compact, highly sensitive sensors, coupled with cloud-based data analytics platforms, is democratizing access to sophisticated air quality monitoring, making it an essential component of modern healthy living.
Leading Markets & Segments in Residential Air Quality Sensors
The residential air quality sensors market is dominated by North America, driven by high disposable incomes, advanced technological adoption, and stringent environmental regulations. The United States, in particular, leads the market due to strong consumer demand for smart home devices and a growing awareness of indoor air pollution's health impacts. In terms of applications, the Bedroom segment is expected to witness the highest growth, fueled by parental concerns for infant and child well-being and the recognition that sleep quality is directly linked to air purity. The Kitchen segment also holds significant potential, given the emission of volatile organic compounds (VOCs) and particulate matter during cooking.
- Dominant Region: North America, particularly the United States.
- Key Drivers: High disposable income, early adoption of smart home technology, robust regulatory environment, widespread health consciousness.
- Leading Application Segments:
- Bedroom: High growth potential due to focus on sleep quality and child health.
- Key Drivers: Parental concern for infant/child health, understanding of sleep disruption by poor air quality.
- Kitchen: Significant demand due to cooking-related pollutant emissions.
- Key Drivers: Awareness of VOCs and particulate matter from cooking, desire for healthier cooking environments.
- Livingroom: Growing adoption as a central monitoring point for family health.
- Key Drivers: Family health focus, integration with other smart home devices, high occupancy.
- Bathroom/Restroom Toilet: Niche but growing demand for odor and VOC monitoring.
- Key Drivers: Odor control, detection of specific VOCs.
- Bedroom: High growth potential due to focus on sleep quality and child health.
- Dominant Sensor Type: Multi-Gas Monitoring Sensors are increasingly preferred due to their comprehensive pollutant detection capabilities.
- Key Drivers: Holistic air quality assessment, ability to detect multiple hazardous substances, enhanced value proposition for consumers.
- Single-Gas Monitoring Sensors: Continue to hold a significant share for specific applications (e.g., CO2 monitors in bedrooms).
- Key Drivers: Cost-effectiveness for targeted monitoring, simplicity of use.
Residential Air Quality Sensors Product Developments
Product innovation in residential air quality sensors focuses on enhanced accuracy, miniaturization, and seamless integration with smart home ecosystems. Manufacturers are developing multi-gas monitoring sensors capable of detecting a broader spectrum of pollutants, including PM2.5, VOCs, CO2, formaldehyde, and more, offering a holistic view of indoor air quality. Competitive advantages are being built through advanced AI algorithms that provide personalized health insights and predictive maintenance alerts. The integration of long-range wireless technologies and improved battery life are also key trends, enabling flexible placement and extended operation without frequent charging.
Key Drivers of Residential Air Quality Sensors Growth
The residential air quality sensors market is propelled by several critical drivers. Rising global health consciousness, particularly concerning respiratory illnesses and allergies exacerbated by indoor air pollution, is a paramount factor. The proliferation of smart home technology and the increasing affordability of IoT devices create a fertile ground for sensor integration. Technological advancements in sensor accuracy, sensitivity, and data processing, coupled with government initiatives promoting healthier indoor environments, further catalyze growth. The growing demand for data-driven insights into personal health and well-being also plays a significant role, making these sensors indispensable for health-conscious consumers.
Challenges in the Residential Air Quality Sensors Market
Despite robust growth, the residential air quality sensors market faces several challenges. High initial costs for advanced multi-gas sensors can be a barrier for some consumer segments. The complexity of interpreting raw sensor data for the average consumer requires intuitive user interfaces and clear actionable recommendations. Furthermore, a lack of standardized regulations across different regions can create market fragmentation and hinder widespread adoption. Intense competition and the need for continuous innovation to stay ahead of emerging technologies also exert pressure on manufacturers. Supply chain disruptions and the availability of critical components can also impact production and pricing.
Emerging Opportunities in Residential Air Quality Sensors
Emerging opportunities in the residential air quality sensors market are abundant. The integration of AI and machine learning for predictive health analytics, offering personalized recommendations for improving indoor air quality and overall well-being, presents a significant avenue for growth. Strategic partnerships with healthcare providers, smart home platforms, and real estate developers can unlock new distribution channels and customer bases. The expansion into developing economies with growing middle classes and increasing awareness of health issues offers substantial untapped market potential. Furthermore, the development of specialized sensors for monitoring emerging indoor pollutants and the integration of air quality monitoring with other smart home functionalities, such as HVAC systems and air purifiers, will drive future innovation and market expansion.
Leading Players in the Residential Air Quality Sensors Sector
- Foobot
- Airbeam (AirCasting)
- Nest
- Air Guard K
- Air Mentor
- Laser Egg
- PRANUS
- Sensology
- Birdi
- CubeSensors
- Haier
- Moji
- Uhoo
Key Milestones in Residential Air Quality Sensors Industry
- 2019: Launch of advanced multi-gas monitoring sensors by several key players, enhancing detection capabilities.
- 2020: Increased consumer adoption of smart home devices, including air quality sensors, fueled by a growing focus on home health.
- 2021: Development of AI-powered predictive analytics for indoor air quality by leading research institutions and companies.
- 2022: Emergence of cloud-based data platforms enabling remote monitoring and historical data analysis for consumers.
- 2023: Significant investment in R&D for more affordable and accurate sensor technologies.
- 2024: Growing trend of integrating air quality sensors with existing smart home ecosystems and HVAC systems.
Strategic Outlook for Residential Air Quality Sensors Market
The strategic outlook for the residential air quality sensors market is exceptionally promising, poised for sustained billion-dollar growth. The increasing convergence of health, technology, and home automation will continue to be a primary growth accelerator. Manufacturers should focus on developing user-centric products that provide actionable insights and seamless integration into the smart home ecosystem. Strategic partnerships with healthcare providers and smart home platform providers will be crucial for market penetration and brand building. Continued investment in research and development, particularly in AI-driven analytics and the detection of emerging indoor pollutants, will be vital for maintaining a competitive edge and unlocking future market potential. Expansion into developing economies, coupled with efforts to reduce sensor costs, will broaden the market reach significantly.
Residential Air Quality Sensors Segmentation
-
1. Application
- 1.1. Restroom Toilet
- 1.2. Kitchen
- 1.3. Livingroom
- 1.4. Bedroom
- 1.5. Bathroom
- 1.6. Others
-
2. Types
- 2.1. Singal-Gas Monitoring Sensor
- 2.2. Multi-Gas Monitoring Sensor
Residential Air Quality Sensors Segmentation By Geography
-
1. North America
- 1.1. United States
- 1.2. Canada
- 1.3. Mexico
-
2. South America
- 2.1. Brazil
- 2.2. Argentina
- 2.3. Rest of South America
-
3. Europe
- 3.1. United Kingdom
- 3.2. Germany
- 3.3. France
- 3.4. Italy
- 3.5. Spain
- 3.6. Russia
- 3.7. Benelux
- 3.8. Nordics
- 3.9. Rest of Europe
-
4. Middle East & Africa
- 4.1. Turkey
- 4.2. Israel
- 4.3. GCC
- 4.4. North Africa
- 4.5. South Africa
- 4.6. Rest of Middle East & Africa
-
5. Asia Pacific
- 5.1. China
- 5.2. India
- 5.3. Japan
- 5.4. South Korea
- 5.5. ASEAN
- 5.6. Oceania
- 5.7. Rest of Asia Pacific
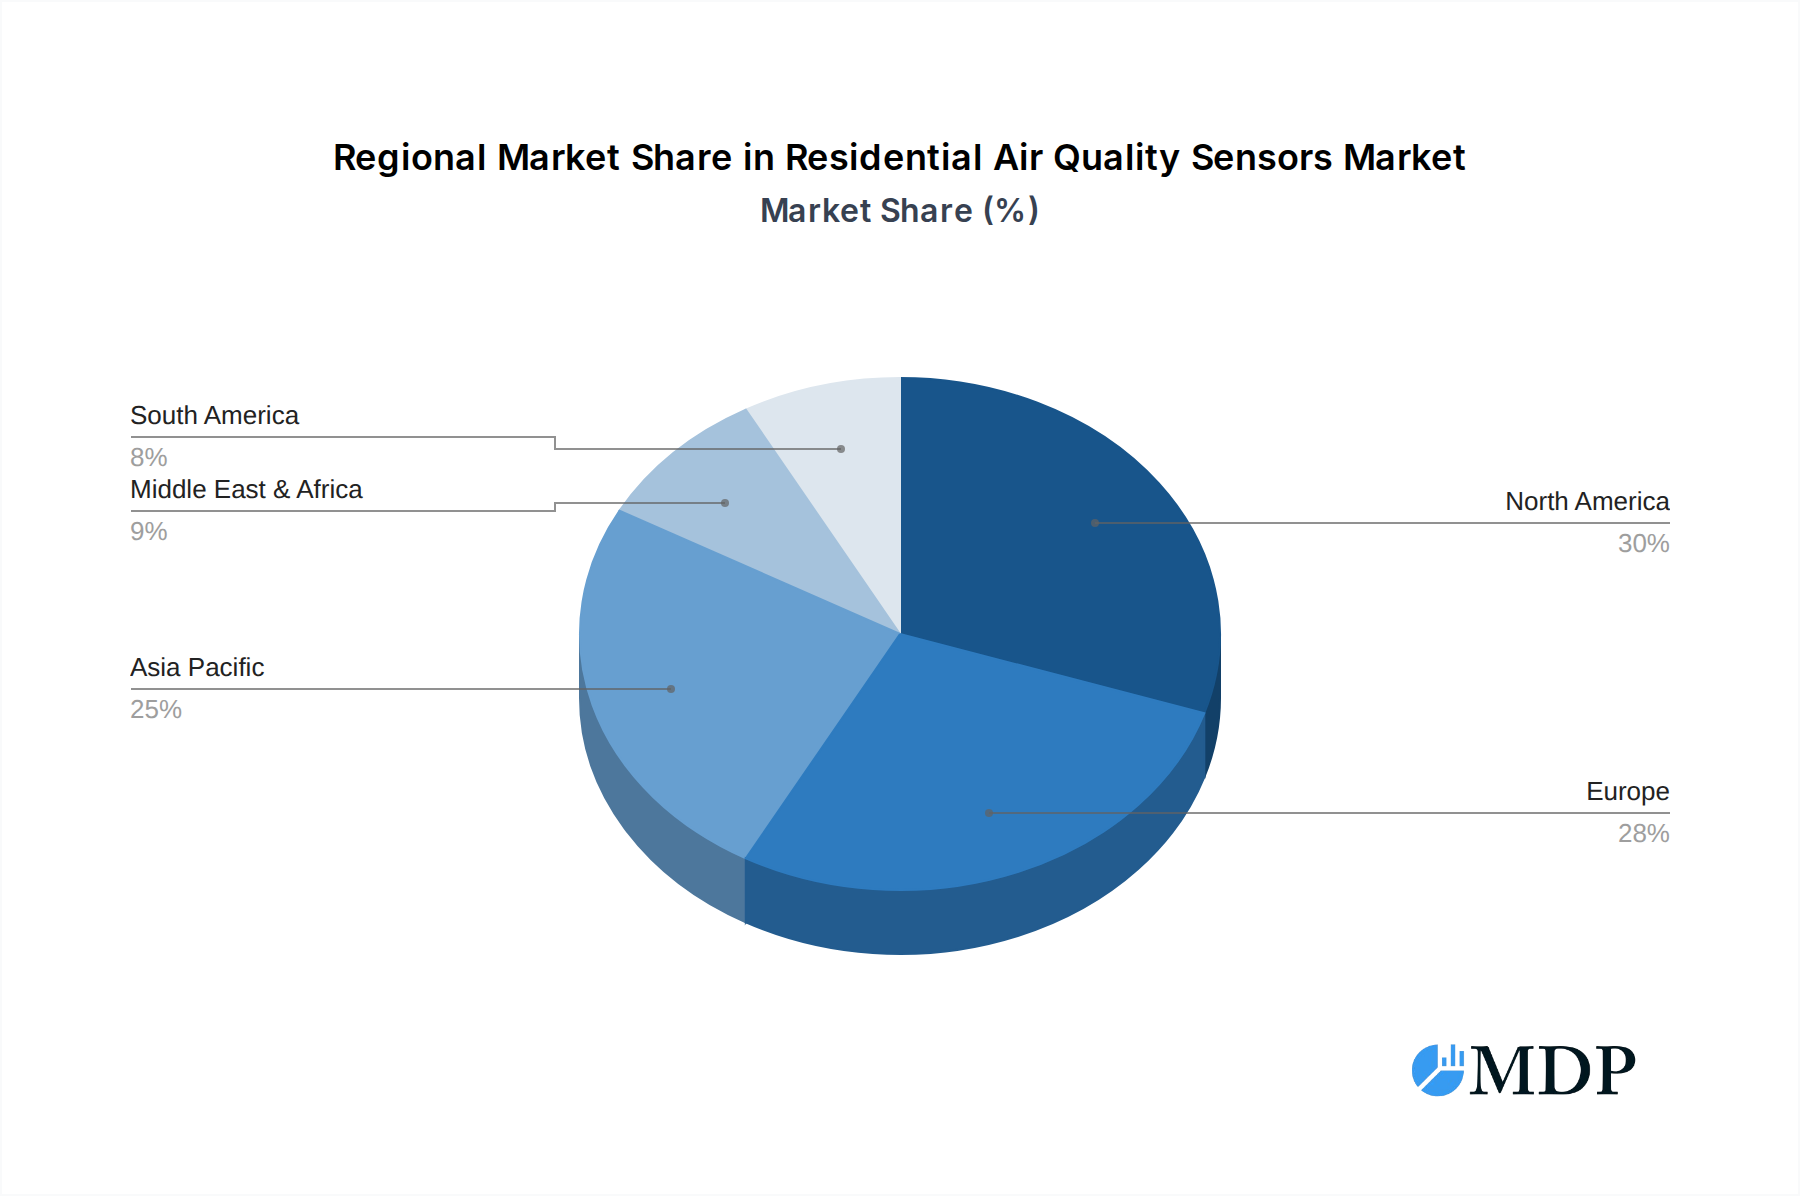
Residential Air Quality Sensors Regional Market Share
Geographic Coverage of Residential Air Quality Sensors
Residential Air Quality Sensors REPORT HIGHLIGHTS
| Aspects | Details |
|---|---|
| Study Period | 2020-2034 |
| Base Year | 2025 |
| Estimated Year | 2026 |
| Forecast Period | 2026-2034 |
| Historical Period | 2020-2025 |
| Growth Rate | CAGR of 8.3% from 2020-2034 |
| Segmentation |
|
Table of Contents
- 1. Introduction
- 1.1. Research Scope
- 1.2. Market Segmentation
- 1.3. Research Methodology
- 1.4. Definitions and Assumptions
- 2. Executive Summary
- 2.1. Introduction
- 3. Market Dynamics
- 3.1. Introduction
- 3.2. Market Drivers
- 3.3. Market Restrains
- 3.4. Market Trends
- 4. Market Factor Analysis
- 4.1. Porters Five Forces
- 4.2. Supply/Value Chain
- 4.3. PESTEL analysis
- 4.4. Market Entropy
- 4.5. Patent/Trademark Analysis
- 5. Global Residential Air Quality Sensors Analysis, Insights and Forecast, 2020-2032
- 5.1. Market Analysis, Insights and Forecast - by Application
- 5.1.1. Restroom Toilet
- 5.1.2. Kitchen
- 5.1.3. Livingroom
- 5.1.4. Bedroom
- 5.1.5. Bathroom
- 5.1.6. Others
- 5.2. Market Analysis, Insights and Forecast - by Types
- 5.2.1. Singal-Gas Monitoring Sensor
- 5.2.2. Multi-Gas Monitoring Sensor
- 5.3. Market Analysis, Insights and Forecast - by Region
- 5.3.1. North America
- 5.3.2. South America
- 5.3.3. Europe
- 5.3.4. Middle East & Africa
- 5.3.5. Asia Pacific
- 5.1. Market Analysis, Insights and Forecast - by Application
- 6. North America Residential Air Quality Sensors Analysis, Insights and Forecast, 2020-2032
- 6.1. Market Analysis, Insights and Forecast - by Application
- 6.1.1. Restroom Toilet
- 6.1.2. Kitchen
- 6.1.3. Livingroom
- 6.1.4. Bedroom
- 6.1.5. Bathroom
- 6.1.6. Others
- 6.2. Market Analysis, Insights and Forecast - by Types
- 6.2.1. Singal-Gas Monitoring Sensor
- 6.2.2. Multi-Gas Monitoring Sensor
- 6.1. Market Analysis, Insights and Forecast - by Application
- 7. South America Residential Air Quality Sensors Analysis, Insights and Forecast, 2020-2032
- 7.1. Market Analysis, Insights and Forecast - by Application
- 7.1.1. Restroom Toilet
- 7.1.2. Kitchen
- 7.1.3. Livingroom
- 7.1.4. Bedroom
- 7.1.5. Bathroom
- 7.1.6. Others
- 7.2. Market Analysis, Insights and Forecast - by Types
- 7.2.1. Singal-Gas Monitoring Sensor
- 7.2.2. Multi-Gas Monitoring Sensor
- 7.1. Market Analysis, Insights and Forecast - by Application
- 8. Europe Residential Air Quality Sensors Analysis, Insights and Forecast, 2020-2032
- 8.1. Market Analysis, Insights and Forecast - by Application
- 8.1.1. Restroom Toilet
- 8.1.2. Kitchen
- 8.1.3. Livingroom
- 8.1.4. Bedroom
- 8.1.5. Bathroom
- 8.1.6. Others
- 8.2. Market Analysis, Insights and Forecast - by Types
- 8.2.1. Singal-Gas Monitoring Sensor
- 8.2.2. Multi-Gas Monitoring Sensor
- 8.1. Market Analysis, Insights and Forecast - by Application
- 9. Middle East & Africa Residential Air Quality Sensors Analysis, Insights and Forecast, 2020-2032
- 9.1. Market Analysis, Insights and Forecast - by Application
- 9.1.1. Restroom Toilet
- 9.1.2. Kitchen
- 9.1.3. Livingroom
- 9.1.4. Bedroom
- 9.1.5. Bathroom
- 9.1.6. Others
- 9.2. Market Analysis, Insights and Forecast - by Types
- 9.2.1. Singal-Gas Monitoring Sensor
- 9.2.2. Multi-Gas Monitoring Sensor
- 9.1. Market Analysis, Insights and Forecast - by Application
- 10. Asia Pacific Residential Air Quality Sensors Analysis, Insights and Forecast, 2020-2032
- 10.1. Market Analysis, Insights and Forecast - by Application
- 10.1.1. Restroom Toilet
- 10.1.2. Kitchen
- 10.1.3. Livingroom
- 10.1.4. Bedroom
- 10.1.5. Bathroom
- 10.1.6. Others
- 10.2. Market Analysis, Insights and Forecast - by Types
- 10.2.1. Singal-Gas Monitoring Sensor
- 10.2.2. Multi-Gas Monitoring Sensor
- 10.1. Market Analysis, Insights and Forecast - by Application
- 11. Competitive Analysis
- 11.1. Global Market Share Analysis 2025
- 11.2. Company Profiles
- 11.2.1 Foobot
- 11.2.1.1. Overview
- 11.2.1.2. Products
- 11.2.1.3. SWOT Analysis
- 11.2.1.4. Recent Developments
- 11.2.1.5. Financials (Based on Availability)
- 11.2.2 Airbeam (AirCasting)
- 11.2.2.1. Overview
- 11.2.2.2. Products
- 11.2.2.3. SWOT Analysis
- 11.2.2.4. Recent Developments
- 11.2.2.5. Financials (Based on Availability)
- 11.2.3 Nest
- 11.2.3.1. Overview
- 11.2.3.2. Products
- 11.2.3.3. SWOT Analysis
- 11.2.3.4. Recent Developments
- 11.2.3.5. Financials (Based on Availability)
- 11.2.4 Air Guard K
- 11.2.4.1. Overview
- 11.2.4.2. Products
- 11.2.4.3. SWOT Analysis
- 11.2.4.4. Recent Developments
- 11.2.4.5. Financials (Based on Availability)
- 11.2.5 Air Mentor
- 11.2.5.1. Overview
- 11.2.5.2. Products
- 11.2.5.3. SWOT Analysis
- 11.2.5.4. Recent Developments
- 11.2.5.5. Financials (Based on Availability)
- 11.2.6 Laser Egg
- 11.2.6.1. Overview
- 11.2.6.2. Products
- 11.2.6.3. SWOT Analysis
- 11.2.6.4. Recent Developments
- 11.2.6.5. Financials (Based on Availability)
- 11.2.7 PRANUS
- 11.2.7.1. Overview
- 11.2.7.2. Products
- 11.2.7.3. SWOT Analysis
- 11.2.7.4. Recent Developments
- 11.2.7.5. Financials (Based on Availability)
- 11.2.8 Sensology
- 11.2.8.1. Overview
- 11.2.8.2. Products
- 11.2.8.3. SWOT Analysis
- 11.2.8.4. Recent Developments
- 11.2.8.5. Financials (Based on Availability)
- 11.2.9 Birdi
- 11.2.9.1. Overview
- 11.2.9.2. Products
- 11.2.9.3. SWOT Analysis
- 11.2.9.4. Recent Developments
- 11.2.9.5. Financials (Based on Availability)
- 11.2.10 CubeSensors
- 11.2.10.1. Overview
- 11.2.10.2. Products
- 11.2.10.3. SWOT Analysis
- 11.2.10.4. Recent Developments
- 11.2.10.5. Financials (Based on Availability)
- 11.2.11 Haier
- 11.2.11.1. Overview
- 11.2.11.2. Products
- 11.2.11.3. SWOT Analysis
- 11.2.11.4. Recent Developments
- 11.2.11.5. Financials (Based on Availability)
- 11.2.12 Moji
- 11.2.12.1. Overview
- 11.2.12.2. Products
- 11.2.12.3. SWOT Analysis
- 11.2.12.4. Recent Developments
- 11.2.12.5. Financials (Based on Availability)
- 11.2.13 Uhoo
- 11.2.13.1. Overview
- 11.2.13.2. Products
- 11.2.13.3. SWOT Analysis
- 11.2.13.4. Recent Developments
- 11.2.13.5. Financials (Based on Availability)
- 11.2.1 Foobot
List of Figures
- Figure 1: Global Residential Air Quality Sensors Revenue Breakdown (undefined, %) by Region 2025 & 2033
- Figure 2: Global Residential Air Quality Sensors Volume Breakdown (K, %) by Region 2025 & 2033
- Figure 3: North America Residential Air Quality Sensors Revenue (undefined), by Application 2025 & 2033
- Figure 4: North America Residential Air Quality Sensors Volume (K), by Application 2025 & 2033
- Figure 5: North America Residential Air Quality Sensors Revenue Share (%), by Application 2025 & 2033
- Figure 6: North America Residential Air Quality Sensors Volume Share (%), by Application 2025 & 2033
- Figure 7: North America Residential Air Quality Sensors Revenue (undefined), by Types 2025 & 2033
- Figure 8: North America Residential Air Quality Sensors Volume (K), by Types 2025 & 2033
- Figure 9: North America Residential Air Quality Sensors Revenue Share (%), by Types 2025 & 2033
- Figure 10: North America Residential Air Quality Sensors Volume Share (%), by Types 2025 & 2033
- Figure 11: North America Residential Air Quality Sensors Revenue (undefined), by Country 2025 & 2033
- Figure 12: North America Residential Air Quality Sensors Volume (K), by Country 2025 & 2033
- Figure 13: North America Residential Air Quality Sensors Revenue Share (%), by Country 2025 & 2033
- Figure 14: North America Residential Air Quality Sensors Volume Share (%), by Country 2025 & 2033
- Figure 15: South America Residential Air Quality Sensors Revenue (undefined), by Application 2025 & 2033
- Figure 16: South America Residential Air Quality Sensors Volume (K), by Application 2025 & 2033
- Figure 17: South America Residential Air Quality Sensors Revenue Share (%), by Application 2025 & 2033
- Figure 18: South America Residential Air Quality Sensors Volume Share (%), by Application 2025 & 2033
- Figure 19: South America Residential Air Quality Sensors Revenue (undefined), by Types 2025 & 2033
- Figure 20: South America Residential Air Quality Sensors Volume (K), by Types 2025 & 2033
- Figure 21: South America Residential Air Quality Sensors Revenue Share (%), by Types 2025 & 2033
- Figure 22: South America Residential Air Quality Sensors Volume Share (%), by Types 2025 & 2033
- Figure 23: South America Residential Air Quality Sensors Revenue (undefined), by Country 2025 & 2033
- Figure 24: South America Residential Air Quality Sensors Volume (K), by Country 2025 & 2033
- Figure 25: South America Residential Air Quality Sensors Revenue Share (%), by Country 2025 & 2033
- Figure 26: South America Residential Air Quality Sensors Volume Share (%), by Country 2025 & 2033
- Figure 27: Europe Residential Air Quality Sensors Revenue (undefined), by Application 2025 & 2033
- Figure 28: Europe Residential Air Quality Sensors Volume (K), by Application 2025 & 2033
- Figure 29: Europe Residential Air Quality Sensors Revenue Share (%), by Application 2025 & 2033
- Figure 30: Europe Residential Air Quality Sensors Volume Share (%), by Application 2025 & 2033
- Figure 31: Europe Residential Air Quality Sensors Revenue (undefined), by Types 2025 & 2033
- Figure 32: Europe Residential Air Quality Sensors Volume (K), by Types 2025 & 2033
- Figure 33: Europe Residential Air Quality Sensors Revenue Share (%), by Types 2025 & 2033
- Figure 34: Europe Residential Air Quality Sensors Volume Share (%), by Types 2025 & 2033
- Figure 35: Europe Residential Air Quality Sensors Revenue (undefined), by Country 2025 & 2033
- Figure 36: Europe Residential Air Quality Sensors Volume (K), by Country 2025 & 2033
- Figure 37: Europe Residential Air Quality Sensors Revenue Share (%), by Country 2025 & 2033
- Figure 38: Europe Residential Air Quality Sensors Volume Share (%), by Country 2025 & 2033
- Figure 39: Middle East & Africa Residential Air Quality Sensors Revenue (undefined), by Application 2025 & 2033
- Figure 40: Middle East & Africa Residential Air Quality Sensors Volume (K), by Application 2025 & 2033
- Figure 41: Middle East & Africa Residential Air Quality Sensors Revenue Share (%), by Application 2025 & 2033
- Figure 42: Middle East & Africa Residential Air Quality Sensors Volume Share (%), by Application 2025 & 2033
- Figure 43: Middle East & Africa Residential Air Quality Sensors Revenue (undefined), by Types 2025 & 2033
- Figure 44: Middle East & Africa Residential Air Quality Sensors Volume (K), by Types 2025 & 2033
- Figure 45: Middle East & Africa Residential Air Quality Sensors Revenue Share (%), by Types 2025 & 2033
- Figure 46: Middle East & Africa Residential Air Quality Sensors Volume Share (%), by Types 2025 & 2033
- Figure 47: Middle East & Africa Residential Air Quality Sensors Revenue (undefined), by Country 2025 & 2033
- Figure 48: Middle East & Africa Residential Air Quality Sensors Volume (K), by Country 2025 & 2033
- Figure 49: Middle East & Africa Residential Air Quality Sensors Revenue Share (%), by Country 2025 & 2033
- Figure 50: Middle East & Africa Residential Air Quality Sensors Volume Share (%), by Country 2025 & 2033
- Figure 51: Asia Pacific Residential Air Quality Sensors Revenue (undefined), by Application 2025 & 2033
- Figure 52: Asia Pacific Residential Air Quality Sensors Volume (K), by Application 2025 & 2033
- Figure 53: Asia Pacific Residential Air Quality Sensors Revenue Share (%), by Application 2025 & 2033
- Figure 54: Asia Pacific Residential Air Quality Sensors Volume Share (%), by Application 2025 & 2033
- Figure 55: Asia Pacific Residential Air Quality Sensors Revenue (undefined), by Types 2025 & 2033
- Figure 56: Asia Pacific Residential Air Quality Sensors Volume (K), by Types 2025 & 2033
- Figure 57: Asia Pacific Residential Air Quality Sensors Revenue Share (%), by Types 2025 & 2033
- Figure 58: Asia Pacific Residential Air Quality Sensors Volume Share (%), by Types 2025 & 2033
- Figure 59: Asia Pacific Residential Air Quality Sensors Revenue (undefined), by Country 2025 & 2033
- Figure 60: Asia Pacific Residential Air Quality Sensors Volume (K), by Country 2025 & 2033
- Figure 61: Asia Pacific Residential Air Quality Sensors Revenue Share (%), by Country 2025 & 2033
- Figure 62: Asia Pacific Residential Air Quality Sensors Volume Share (%), by Country 2025 & 2033
List of Tables
- Table 1: Global Residential Air Quality Sensors Revenue undefined Forecast, by Application 2020 & 2033
- Table 2: Global Residential Air Quality Sensors Volume K Forecast, by Application 2020 & 2033
- Table 3: Global Residential Air Quality Sensors Revenue undefined Forecast, by Types 2020 & 2033
- Table 4: Global Residential Air Quality Sensors Volume K Forecast, by Types 2020 & 2033
- Table 5: Global Residential Air Quality Sensors Revenue undefined Forecast, by Region 2020 & 2033
- Table 6: Global Residential Air Quality Sensors Volume K Forecast, by Region 2020 & 2033
- Table 7: Global Residential Air Quality Sensors Revenue undefined Forecast, by Application 2020 & 2033
- Table 8: Global Residential Air Quality Sensors Volume K Forecast, by Application 2020 & 2033
- Table 9: Global Residential Air Quality Sensors Revenue undefined Forecast, by Types 2020 & 2033
- Table 10: Global Residential Air Quality Sensors Volume K Forecast, by Types 2020 & 2033
- Table 11: Global Residential Air Quality Sensors Revenue undefined Forecast, by Country 2020 & 2033
- Table 12: Global Residential Air Quality Sensors Volume K Forecast, by Country 2020 & 2033
- Table 13: United States Residential Air Quality Sensors Revenue (undefined) Forecast, by Application 2020 & 2033
- Table 14: United States Residential Air Quality Sensors Volume (K) Forecast, by Application 2020 & 2033
- Table 15: Canada Residential Air Quality Sensors Revenue (undefined) Forecast, by Application 2020 & 2033
- Table 16: Canada Residential Air Quality Sensors Volume (K) Forecast, by Application 2020 & 2033
- Table 17: Mexico Residential Air Quality Sensors Revenue (undefined) Forecast, by Application 2020 & 2033
- Table 18: Mexico Residential Air Quality Sensors Volume (K) Forecast, by Application 2020 & 2033
- Table 19: Global Residential Air Quality Sensors Revenue undefined Forecast, by Application 2020 & 2033
- Table 20: Global Residential Air Quality Sensors Volume K Forecast, by Application 2020 & 2033
- Table 21: Global Residential Air Quality Sensors Revenue undefined Forecast, by Types 2020 & 2033
- Table 22: Global Residential Air Quality Sensors Volume K Forecast, by Types 2020 & 2033
- Table 23: Global Residential Air Quality Sensors Revenue undefined Forecast, by Country 2020 & 2033
- Table 24: Global Residential Air Quality Sensors Volume K Forecast, by Country 2020 & 2033
- Table 25: Brazil Residential Air Quality Sensors Revenue (undefined) Forecast, by Application 2020 & 2033
- Table 26: Brazil Residential Air Quality Sensors Volume (K) Forecast, by Application 2020 & 2033
- Table 27: Argentina Residential Air Quality Sensors Revenue (undefined) Forecast, by Application 2020 & 2033
- Table 28: Argentina Residential Air Quality Sensors Volume (K) Forecast, by Application 2020 & 2033
- Table 29: Rest of South America Residential Air Quality Sensors Revenue (undefined) Forecast, by Application 2020 & 2033
- Table 30: Rest of South America Residential Air Quality Sensors Volume (K) Forecast, by Application 2020 & 2033
- Table 31: Global Residential Air Quality Sensors Revenue undefined Forecast, by Application 2020 & 2033
- Table 32: Global Residential Air Quality Sensors Volume K Forecast, by Application 2020 & 2033
- Table 33: Global Residential Air Quality Sensors Revenue undefined Forecast, by Types 2020 & 2033
- Table 34: Global Residential Air Quality Sensors Volume K Forecast, by Types 2020 & 2033
- Table 35: Global Residential Air Quality Sensors Revenue undefined Forecast, by Country 2020 & 2033
- Table 36: Global Residential Air Quality Sensors Volume K Forecast, by Country 2020 & 2033
- Table 37: United Kingdom Residential Air Quality Sensors Revenue (undefined) Forecast, by Application 2020 & 2033
- Table 38: United Kingdom Residential Air Quality Sensors Volume (K) Forecast, by Application 2020 & 2033
- Table 39: Germany Residential Air Quality Sensors Revenue (undefined) Forecast, by Application 2020 & 2033
- Table 40: Germany Residential Air Quality Sensors Volume (K) Forecast, by Application 2020 & 2033
- Table 41: France Residential Air Quality Sensors Revenue (undefined) Forecast, by Application 2020 & 2033
- Table 42: France Residential Air Quality Sensors Volume (K) Forecast, by Application 2020 & 2033
- Table 43: Italy Residential Air Quality Sensors Revenue (undefined) Forecast, by Application 2020 & 2033
- Table 44: Italy Residential Air Quality Sensors Volume (K) Forecast, by Application 2020 & 2033
- Table 45: Spain Residential Air Quality Sensors Revenue (undefined) Forecast, by Application 2020 & 2033
- Table 46: Spain Residential Air Quality Sensors Volume (K) Forecast, by Application 2020 & 2033
- Table 47: Russia Residential Air Quality Sensors Revenue (undefined) Forecast, by Application 2020 & 2033
- Table 48: Russia Residential Air Quality Sensors Volume (K) Forecast, by Application 2020 & 2033
- Table 49: Benelux Residential Air Quality Sensors Revenue (undefined) Forecast, by Application 2020 & 2033
- Table 50: Benelux Residential Air Quality Sensors Volume (K) Forecast, by Application 2020 & 2033
- Table 51: Nordics Residential Air Quality Sensors Revenue (undefined) Forecast, by Application 2020 & 2033
- Table 52: Nordics Residential Air Quality Sensors Volume (K) Forecast, by Application 2020 & 2033
- Table 53: Rest of Europe Residential Air Quality Sensors Revenue (undefined) Forecast, by Application 2020 & 2033
- Table 54: Rest of Europe Residential Air Quality Sensors Volume (K) Forecast, by Application 2020 & 2033
- Table 55: Global Residential Air Quality Sensors Revenue undefined Forecast, by Application 2020 & 2033
- Table 56: Global Residential Air Quality Sensors Volume K Forecast, by Application 2020 & 2033
- Table 57: Global Residential Air Quality Sensors Revenue undefined Forecast, by Types 2020 & 2033
- Table 58: Global Residential Air Quality Sensors Volume K Forecast, by Types 2020 & 2033
- Table 59: Global Residential Air Quality Sensors Revenue undefined Forecast, by Country 2020 & 2033
- Table 60: Global Residential Air Quality Sensors Volume K Forecast, by Country 2020 & 2033
- Table 61: Turkey Residential Air Quality Sensors Revenue (undefined) Forecast, by Application 2020 & 2033
- Table 62: Turkey Residential Air Quality Sensors Volume (K) Forecast, by Application 2020 & 2033
- Table 63: Israel Residential Air Quality Sensors Revenue (undefined) Forecast, by Application 2020 & 2033
- Table 64: Israel Residential Air Quality Sensors Volume (K) Forecast, by Application 2020 & 2033
- Table 65: GCC Residential Air Quality Sensors Revenue (undefined) Forecast, by Application 2020 & 2033
- Table 66: GCC Residential Air Quality Sensors Volume (K) Forecast, by Application 2020 & 2033
- Table 67: North Africa Residential Air Quality Sensors Revenue (undefined) Forecast, by Application 2020 & 2033
- Table 68: North Africa Residential Air Quality Sensors Volume (K) Forecast, by Application 2020 & 2033
- Table 69: South Africa Residential Air Quality Sensors Revenue (undefined) Forecast, by Application 2020 & 2033
- Table 70: South Africa Residential Air Quality Sensors Volume (K) Forecast, by Application 2020 & 2033
- Table 71: Rest of Middle East & Africa Residential Air Quality Sensors Revenue (undefined) Forecast, by Application 2020 & 2033
- Table 72: Rest of Middle East & Africa Residential Air Quality Sensors Volume (K) Forecast, by Application 2020 & 2033
- Table 73: Global Residential Air Quality Sensors Revenue undefined Forecast, by Application 2020 & 2033
- Table 74: Global Residential Air Quality Sensors Volume K Forecast, by Application 2020 & 2033
- Table 75: Global Residential Air Quality Sensors Revenue undefined Forecast, by Types 2020 & 2033
- Table 76: Global Residential Air Quality Sensors Volume K Forecast, by Types 2020 & 2033
- Table 77: Global Residential Air Quality Sensors Revenue undefined Forecast, by Country 2020 & 2033
- Table 78: Global Residential Air Quality Sensors Volume K Forecast, by Country 2020 & 2033
- Table 79: China Residential Air Quality Sensors Revenue (undefined) Forecast, by Application 2020 & 2033
- Table 80: China Residential Air Quality Sensors Volume (K) Forecast, by Application 2020 & 2033
- Table 81: India Residential Air Quality Sensors Revenue (undefined) Forecast, by Application 2020 & 2033
- Table 82: India Residential Air Quality Sensors Volume (K) Forecast, by Application 2020 & 2033
- Table 83: Japan Residential Air Quality Sensors Revenue (undefined) Forecast, by Application 2020 & 2033
- Table 84: Japan Residential Air Quality Sensors Volume (K) Forecast, by Application 2020 & 2033
- Table 85: South Korea Residential Air Quality Sensors Revenue (undefined) Forecast, by Application 2020 & 2033
- Table 86: South Korea Residential Air Quality Sensors Volume (K) Forecast, by Application 2020 & 2033
- Table 87: ASEAN Residential Air Quality Sensors Revenue (undefined) Forecast, by Application 2020 & 2033
- Table 88: ASEAN Residential Air Quality Sensors Volume (K) Forecast, by Application 2020 & 2033
- Table 89: Oceania Residential Air Quality Sensors Revenue (undefined) Forecast, by Application 2020 & 2033
- Table 90: Oceania Residential Air Quality Sensors Volume (K) Forecast, by Application 2020 & 2033
- Table 91: Rest of Asia Pacific Residential Air Quality Sensors Revenue (undefined) Forecast, by Application 2020 & 2033
- Table 92: Rest of Asia Pacific Residential Air Quality Sensors Volume (K) Forecast, by Application 2020 & 2033
Frequently Asked Questions
1. What is the projected Compound Annual Growth Rate (CAGR) of the Residential Air Quality Sensors?
The projected CAGR is approximately 8.3%.
2. Which companies are prominent players in the Residential Air Quality Sensors?
Key companies in the market include Foobot, Airbeam (AirCasting), Nest, Air Guard K, Air Mentor, Laser Egg, PRANUS, Sensology, Birdi, CubeSensors, Haier, Moji, Uhoo.
3. What are the main segments of the Residential Air Quality Sensors?
The market segments include Application, Types.
4. Can you provide details about the market size?
The market size is estimated to be USD XXX N/A as of 2022.
5. What are some drivers contributing to market growth?
N/A
6. What are the notable trends driving market growth?
N/A
7. Are there any restraints impacting market growth?
N/A
8. Can you provide examples of recent developments in the market?
N/A
9. What pricing options are available for accessing the report?
Pricing options include single-user, multi-user, and enterprise licenses priced at USD 3350.00, USD 5025.00, and USD 6700.00 respectively.
10. Is the market size provided in terms of value or volume?
The market size is provided in terms of value, measured in N/A and volume, measured in K.
11. Are there any specific market keywords associated with the report?
Yes, the market keyword associated with the report is "Residential Air Quality Sensors," which aids in identifying and referencing the specific market segment covered.
12. How do I determine which pricing option suits my needs best?
The pricing options vary based on user requirements and access needs. Individual users may opt for single-user licenses, while businesses requiring broader access may choose multi-user or enterprise licenses for cost-effective access to the report.
13. Are there any additional resources or data provided in the Residential Air Quality Sensors report?
While the report offers comprehensive insights, it's advisable to review the specific contents or supplementary materials provided to ascertain if additional resources or data are available.
14. How can I stay updated on further developments or reports in the Residential Air Quality Sensors?
To stay informed about further developments, trends, and reports in the Residential Air Quality Sensors, consider subscribing to industry newsletters, following relevant companies and organizations, or regularly checking reputable industry news sources and publications.
Methodology
Step 1 - Identification of Relevant Samples Size from Population Database


Step 2 - Approaches for Defining Global Market Size (Value, Volume* & Price*)

Note*: In applicable scenarios
Step 3 - Data Sources
Primary Research
- Web Analytics
- Survey Reports
- Research Institute
- Latest Research Reports
- Opinion Leaders
Secondary Research
- Annual Reports
- White Paper
- Latest Press Release
- Industry Association
- Paid Database
- Investor Presentations

Step 4 - Data Triangulation
Involves using different sources of information in order to increase the validity of a study
These sources are likely to be stakeholders in a program - participants, other researchers, program staff, other community members, and so on.
Then we put all data in single framework & apply various statistical tools to find out the dynamic on the market.
During the analysis stage, feedback from the stakeholder groups would be compared to determine areas of agreement as well as areas of divergence