

Key Insights
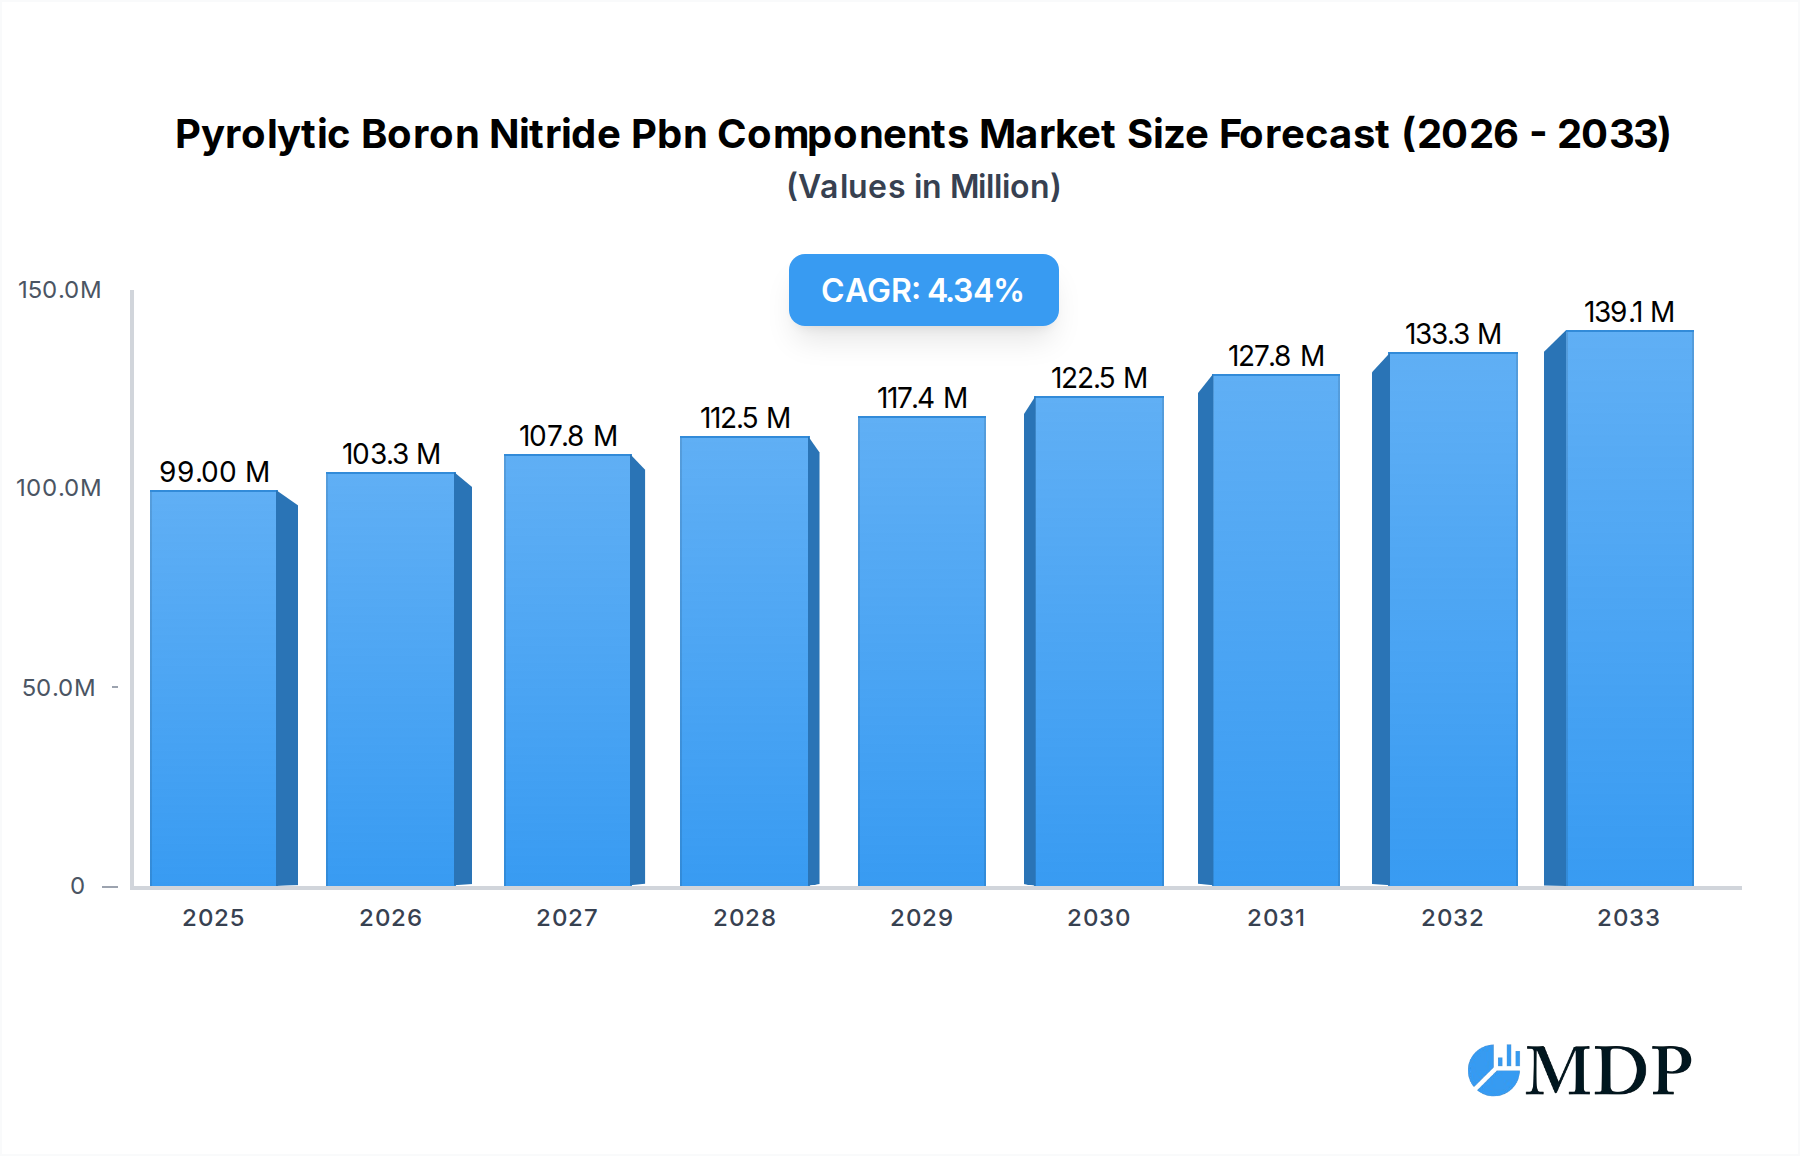
The global Pyrolytic Boron Nitride (PBN) Components market is poised for significant expansion, with an estimated market size of 99 million USD in 2025. Projected to grow at a robust CAGR of 4.3% from 2025 to 2033, the market's trajectory is largely shaped by the escalating demand from the semiconductor industry and the burgeoning OLED sector. PBN's exceptional thermal stability, electrical insulation, and chemical inertness make it indispensable for critical applications in high-temperature manufacturing processes, wafer handling, and the production of advanced electronic components. The increasing complexity and miniaturization of semiconductors, coupled with the rapid adoption of OLED displays in consumer electronics, smartphones, and televisions, are primary growth drivers. Furthermore, the "Others" application segment, encompassing areas like advanced ceramics and aerospace, is also expected to contribute to market growth as PBN's unique properties find new avenues of application.

Pyrolytic Boron Nitride Pbn Components Market Size (In Million)
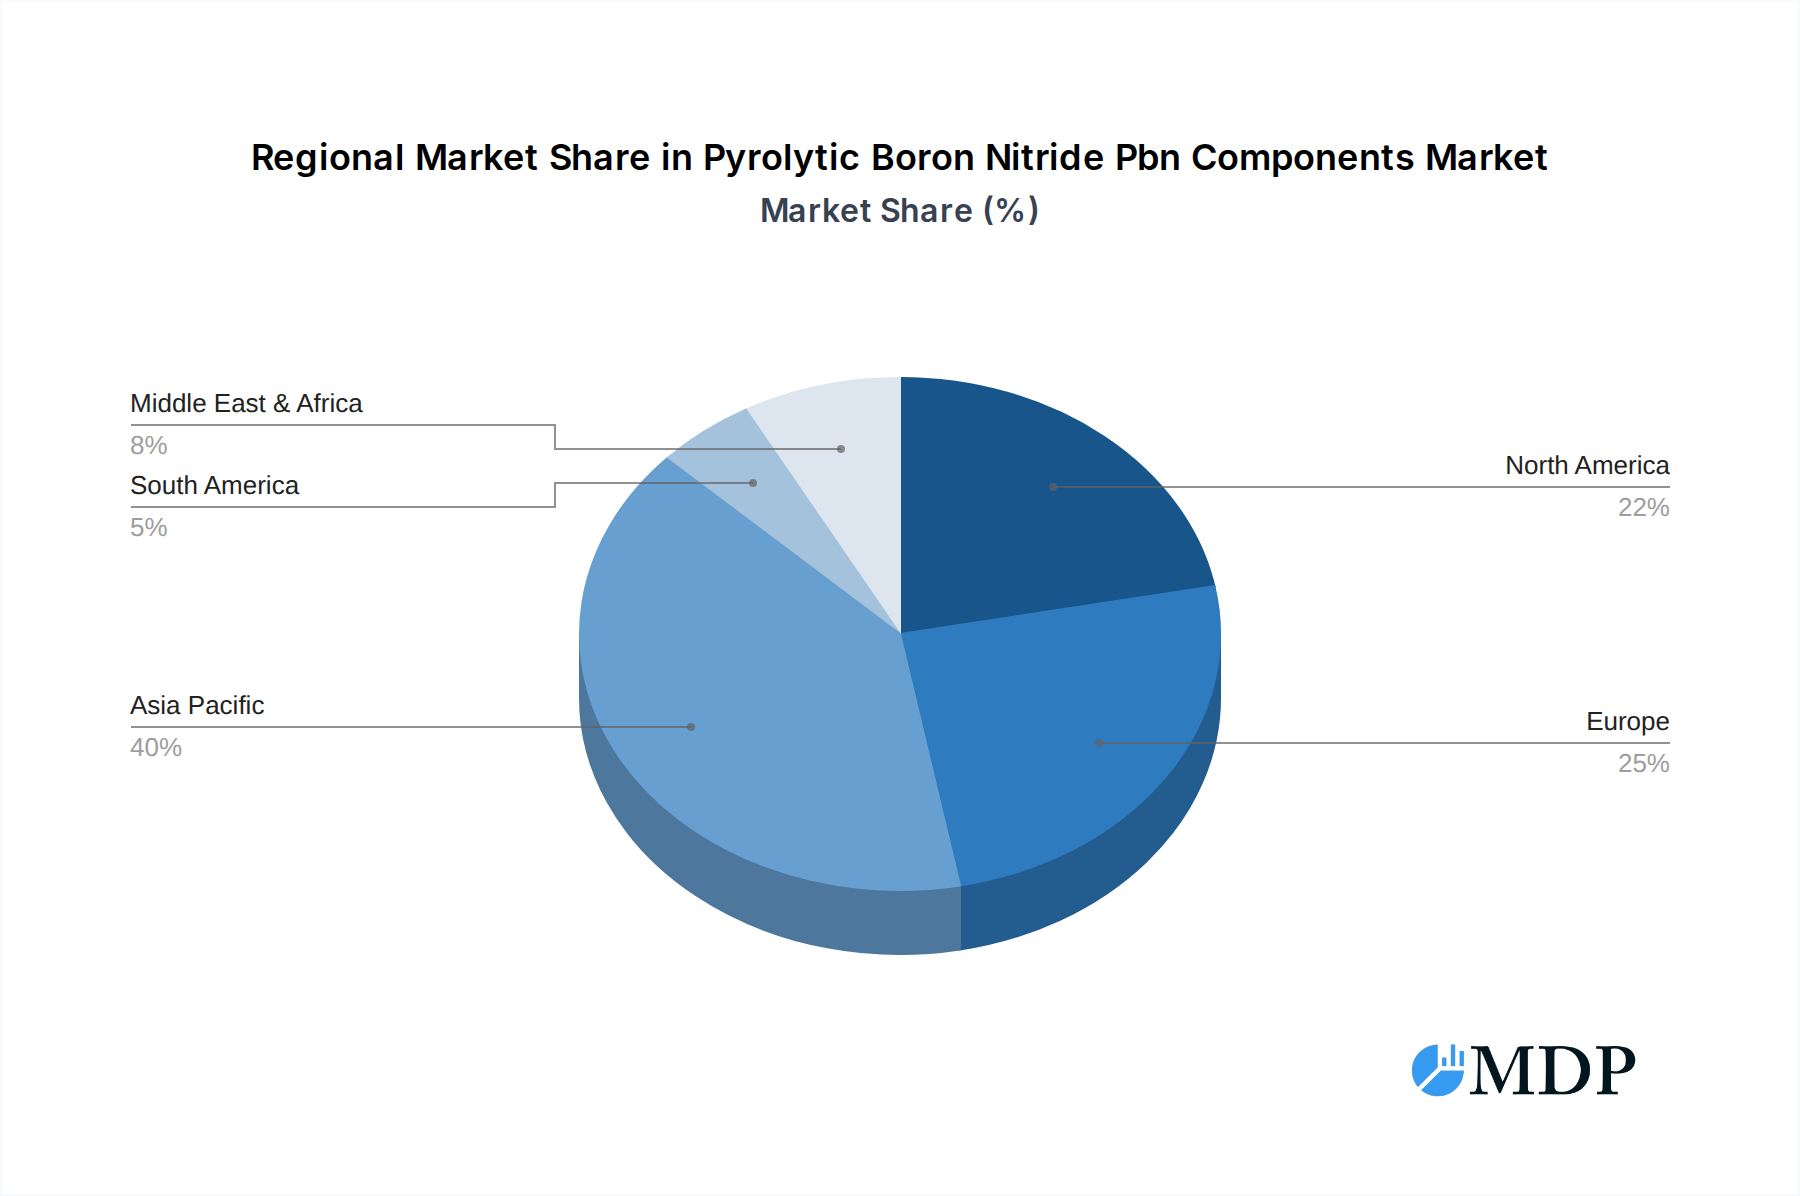
The PBN Components market is characterized by a diverse range of product types, with PBN Sheets/Plates, PBN Crucibles, and PBN Heaters holding substantial market share due to their widespread use in semiconductor fabrication and material processing. Emerging applications for PBN Coatings and PBN Boats are also contributing to market dynamism. Geographically, Asia Pacific, led by China and Japan, is expected to dominate the market, driven by its extensive manufacturing base for semiconductors and electronics. North America and Europe remain crucial markets, fueled by innovation in advanced materials and high-tech manufacturing. Key industry players are actively investing in research and development to enhance PBN material properties and expand production capabilities to meet the growing global demand. While the high cost of raw materials and complex manufacturing processes present some restraints, the indispensable role of PBN in advanced technology manufacturing ensures sustained market growth and innovation.
Pyrolytic Boron Nitride Pbn Components Company Market Share
Pyrolytic Boron Nitride (PBN) Components Market Report: Strategic Insights and Future Outlook (2019-2033)
This comprehensive report provides an in-depth analysis of the global Pyrolytic Boron Nitride (PBN) components market, covering its dynamics, trends, leading segments, product innovations, growth drivers, challenges, opportunities, and key players. With a study period spanning from 2019 to 2033, and a base year of 2025, this report offers critical insights for stakeholders in the semiconductor, OLED, and other advanced material industries.
Pyrolytic Boron Nitride Pbn Components Market Dynamics & Concentration
The Pyrolytic Boron Nitride (PBN) components market is characterized by a moderate to high concentration, with a few dominant players holding significant market share. Beijing Boyu Semiconductor and Shin-Etsu Chemical are prominent leaders, each estimated to command market shares exceeding xx million. Momentive Technologies and Guojing New Material also hold substantial positions, contributing to the market's competitive landscape. Innovation is a key driver, fueled by advancements in semiconductor manufacturing processes and the increasing demand for high-performance materials in extreme environments. Regulatory frameworks, while generally supportive of advanced materials, can influence production standards and material certifications. Product substitutes, such as Silicon Carbide (SiC) and Alumina (Al2O3), exist but often fall short in critical performance metrics like thermal conductivity and electrical insulation at high temperatures, limiting their direct replacement potential in demanding applications. End-user trends are heavily influenced by the rapid growth of the semiconductor industry, particularly in areas like high-power electronics and advanced chip fabrication. The OLED sector also represents a significant and growing application area. Merger and acquisition (M&A) activities have been moderate, with an estimated xx M&A deals recorded between 2019 and 2024, primarily aimed at consolidating market presence, expanding product portfolios, and acquiring proprietary technologies.
Pyrolytic Boron Nitride Pbn Components Industry Trends & Analysis
The global Pyrolytic Boron Nitride (PBN) components market is experiencing robust growth, driven by an insatiable demand from the burgeoning semiconductor industry. The Compound Annual Growth Rate (CAGR) is projected to be around xx% during the forecast period of 2025-2033. This significant expansion is intrinsically linked to the increasing complexity and miniaturization of semiconductor devices, which necessitate materials with superior thermal management and electrical insulation properties. PBN's exceptional resistance to high temperatures, chemical inertness, and excellent dielectric strength make it an indispensable material for critical applications such as susceptors, crucibles, and heater elements used in crystal growth and wafer processing. Furthermore, the escalating adoption of OLED technology in displays for smartphones, televisions, and other electronic gadgets is a substantial market penetration driver. PBN components play a crucial role in the precise deposition processes required for OLED manufacturing, ensuring high yields and device longevity. Technological disruptions, including advancements in PBN synthesis techniques and fabrication processes, are continuously enhancing material purity, uniformity, and cost-effectiveness, further stimulating market growth. Consumer preferences are indirectly shaping the market through the demand for more efficient, durable, and high-performance electronic devices. The competitive dynamics are intensifying, with existing players investing heavily in research and development to enhance product offerings and expand their manufacturing capacities. Companies like Zhejiang Nuohua Ceramic and Yantai HeFuxiang Ceramics are emerging as key contributors, challenging established market leaders through innovation and strategic market penetration.
Leading Markets & Segments in Pyrolytic Boron Nitride Pbn Components
The Semiconductor Industry is the undisputed dominant segment within the Pyrolytic Boron Nitride (PBN) components market, accounting for an estimated xx% of the total market value in the base year 2025. This dominance is driven by the ever-increasing demand for advanced semiconductor manufacturing equipment that requires high-purity, high-temperature, and chemically inert materials.
- Dominant Region & Country: Asia-Pacific, particularly China and Taiwan, represents the leading regional market for PBN components due to its massive concentration of semiconductor fabrication facilities and a robust electronics manufacturing ecosystem. South Korea and Japan also contribute significantly to regional demand. The United States is another key market, driven by its advanced research and development in semiconductor technology and a growing domestic manufacturing base.
- Key Drivers for Semiconductor Industry Dominance:
- Economic Policies: Government initiatives and investments in the semiconductor sector across Asia-Pacific, aiming for self-sufficiency and technological leadership.
- Infrastructure: Extensive development of semiconductor foundries and R&D centers across the region.
- Technological Advancement: The continuous push for smaller, faster, and more powerful microchips necessitates sophisticated materials like PBN for critical process steps.
- High-Purity Requirements: PBN's inherent purity minimizes contamination in sensitive semiconductor fabrication processes.
- Dominant Type: PBN Sheet/Plates: Within the semiconductor application, PBN Sheet/Plates are a leading product type, essential for constructing susceptors and wafer holders used in epitaxy and chemical vapor deposition (CVD) processes. PBN Crucibles are also highly significant, utilized for crystal growth in the production of silicon and other semiconductor materials. PBN Heaters are critical for achieving and maintaining the precise high temperatures required for various semiconductor fabrication steps.
The OLED segment is a rapidly growing secondary market, exhibiting a strong CAGR of xx% during the forecast period. PBN components are integral to the manufacturing of OLED displays, particularly in processes that require precise temperature control and prevention of contamination.
- Key Drivers for OLED Segment Growth:
- Consumer Electronics Demand: The widespread adoption of OLED technology in premium smartphones, televisions, and wearable devices.
- Technological Innovation: Ongoing advancements in OLED display technology leading to larger, more flexible, and energy-efficient screens.
- Material Purity: PBN's inertness is vital for preventing degradation of sensitive organic materials used in OLEDs.
Others segment encompasses niche applications in aerospace, medical devices, and high-temperature industrial furnaces. While smaller in current market share, this segment is poised for steady growth as industries explore PBN's unique material properties for specialized applications.
Pyrolytic Boron Nitride Pbn Components Product Developments
Recent product developments in the Pyrolytic Boron Nitride (PBN) components market focus on enhancing material purity, improving thermal shock resistance, and achieving tighter dimensional tolerances. Innovations in PBN synthesis and processing techniques have led to the development of higher-grade PBN materials suitable for more demanding applications in advanced semiconductor nodes and next-generation display technologies. Companies are also introducing customized PBN component designs tailored to specific equipment and process requirements, offering significant competitive advantages through optimized performance and extended component lifespan. The increasing demand for PBN Coating services for various substrates is another notable development, providing enhanced protection against corrosion and wear in extreme environments.
Key Drivers of Pyrolytic Boron Nitride Pbn Components Growth
The Pyrolytic Boron Nitride (PBN) components market is propelled by several key growth drivers. Foremost is the unwavering expansion of the semiconductor industry, driven by the insatiable demand for advanced electronics, AI, and 5G technologies. The increasing complexity of semiconductor manufacturing processes necessitates materials like PBN for their exceptional thermal conductivity, electrical insulation, and chemical inertness at ultra-high temperatures. Secondly, the growing adoption of OLED technology in consumer electronics, from smartphones to large-screen televisions, directly fuels demand for PBN components used in their manufacturing. Lastly, technological advancements in PBN production techniques, leading to higher purity, better consistency, and more cost-effective manufacturing, are making PBN components more accessible and attractive for a wider range of applications.
Challenges in the Pyrolytic Boron Nitride Pbn Components Market
The Pyrolytic Boron Nitride (PBN) components market faces several challenges that could impede its growth trajectory. High production costs associated with the complex PBN manufacturing process remain a significant barrier, limiting its adoption in less demanding applications. Supply chain vulnerabilities, particularly concerning the availability of high-purity boron and nitrogen precursors, can lead to price volatility and production delays. Furthermore, the limited number of highly skilled manufacturers capable of producing high-quality PBN components can create bottlenecks in meeting escalating demand. Finally, while PBN offers superior performance, the emergence of advanced ceramic materials and composite alternatives could, in some instances, present competitive pressure, though direct substitution in critical applications remains difficult.
Emerging Opportunities in Pyrolytic Boron Nitride Pbn Components
The Pyrolytic Boron Nitride (PBN) components market is ripe with emerging opportunities driven by ongoing technological breakthroughs and evolving industry needs. The rapid advancement in next-generation semiconductor technologies, such as advanced packaging and extreme ultraviolet (EUV) lithography, creates a substantial demand for PBN components with even higher purity and tighter specifications. The growth of the electric vehicle (EV) market and renewable energy sector presents new opportunities for PBN in power electronics and high-temperature energy storage solutions. Furthermore, strategic partnerships and collaborations between PBN manufacturers and end-users, such as semiconductor equipment makers and display manufacturers, can lead to the development of tailor-made solutions and accelerate market penetration. Expansion into emerging geographical markets with developing electronics manufacturing capabilities also represents a significant growth avenue.
Leading Players in the Pyrolytic Boron Nitride Pbn Components Sector
- Beijing Boyu Semiconductor
- Shin-Etsu Chemical
- Momentive Technologies
- Guojing New Material
- Zhejiang Nuohua Ceramic
- CVT GmbH & Co. KG
- Yantai HeFuxiang Ceramics
- Morgan Advanced Materials
- Stanford Advanced Materials
- Thermic Edge
Key Milestones in Pyrolytic Boron Nitride Pbn Components Industry
- 2019: Increased demand for PBN crucibles for advanced silicon crystal growth.
- 2020: Enhanced PBN coating techniques for improved wear resistance in semiconductor processing equipment.
- 2021: Significant investment in R&D by major players to develop higher purity PBN for next-generation semiconductor nodes.
- 2022: Growing adoption of PBN sheets and plates in advanced OLED manufacturing processes.
- 2023: Strategic partnerships formed to expand PBN production capacity to meet rising global demand.
- 2024: Introduction of new PBN heater designs for more efficient and precise temperature control in epitaxy.
Strategic Outlook for Pyrolytic Boron Nitride Pbn Components Market
The strategic outlook for the Pyrolytic Boron Nitride (PBN) components market remains highly positive, driven by sustained demand from its core applications and the emergence of new growth avenues. Future market success will hinge on continuous innovation in material science and manufacturing processes to achieve even higher purity, superior performance characteristics, and cost-effectiveness. Companies that can establish robust and resilient supply chains for raw materials will be well-positioned to navigate potential disruptions. Strategic partnerships with key end-users, focusing on co-development of customized PBN solutions, will be crucial for capturing market share. Furthermore, exploring diversification into emerging high-growth sectors like advanced power electronics and next-generation display technologies will be vital for long-term market leadership and sustained growth.
Pyrolytic Boron Nitride Pbn Components Segmentation
-
1. Application
- 1.1. Semiconductor Industry
- 1.2. OLED
- 1.3. Others
-
2. Type
- 2.1. PBN Sheet/Plates
- 2.2. PBN Crucibles
- 2.3. PBN Heaters
- 2.4. PBN Boat
- 2.5. PBN Coating
- 2.6. Others
Pyrolytic Boron Nitride Pbn Components Segmentation By Geography
-
1. North America
- 1.1. United States
- 1.2. Canada
- 1.3. Mexico
-
2. South America
- 2.1. Brazil
- 2.2. Argentina
- 2.3. Rest of South America
-
3. Europe
- 3.1. United Kingdom
- 3.2. Germany
- 3.3. France
- 3.4. Italy
- 3.5. Spain
- 3.6. Russia
- 3.7. Benelux
- 3.8. Nordics
- 3.9. Rest of Europe
-
4. Middle East & Africa
- 4.1. Turkey
- 4.2. Israel
- 4.3. GCC
- 4.4. North Africa
- 4.5. South Africa
- 4.6. Rest of Middle East & Africa
-
5. Asia Pacific
- 5.1. China
- 5.2. India
- 5.3. Japan
- 5.4. South Korea
- 5.5. ASEAN
- 5.6. Oceania
- 5.7. Rest of Asia Pacific
Pyrolytic Boron Nitride Pbn Components Regional Market Share
Geographic Coverage of Pyrolytic Boron Nitride Pbn Components
Pyrolytic Boron Nitride Pbn Components REPORT HIGHLIGHTS
| Aspects | Details |
|---|---|
| Study Period | 2020-2034 |
| Base Year | 2025 |
| Estimated Year | 2026 |
| Forecast Period | 2026-2034 |
| Historical Period | 2020-2025 |
| Growth Rate | CAGR of 4.3% from 2020-2034 |
| Segmentation |
|
Table of Contents
- 1. Introduction
- 1.1. Research Scope
- 1.2. Market Segmentation
- 1.3. Research Methodology
- 1.4. Definitions and Assumptions
- 2. Executive Summary
- 2.1. Introduction
- 3. Market Dynamics
- 3.1. Introduction
- 3.2. Market Drivers
- 3.3. Market Restrains
- 3.4. Market Trends
- 4. Market Factor Analysis
- 4.1. Porters Five Forces
- 4.2. Supply/Value Chain
- 4.3. PESTEL analysis
- 4.4. Market Entropy
- 4.5. Patent/Trademark Analysis
- 5. Global Pyrolytic Boron Nitride Pbn Components Analysis, Insights and Forecast, 2020-2032
- 5.1. Market Analysis, Insights and Forecast - by Application
- 5.1.1. Semiconductor Industry
- 5.1.2. OLED
- 5.1.3. Others
- 5.2. Market Analysis, Insights and Forecast - by Type
- 5.2.1. PBN Sheet/Plates
- 5.2.2. PBN Crucibles
- 5.2.3. PBN Heaters
- 5.2.4. PBN Boat
- 5.2.5. PBN Coating
- 5.2.6. Others
- 5.3. Market Analysis, Insights and Forecast - by Region
- 5.3.1. North America
- 5.3.2. South America
- 5.3.3. Europe
- 5.3.4. Middle East & Africa
- 5.3.5. Asia Pacific
- 5.1. Market Analysis, Insights and Forecast - by Application
- 6. North America Pyrolytic Boron Nitride Pbn Components Analysis, Insights and Forecast, 2020-2032
- 6.1. Market Analysis, Insights and Forecast - by Application
- 6.1.1. Semiconductor Industry
- 6.1.2. OLED
- 6.1.3. Others
- 6.2. Market Analysis, Insights and Forecast - by Type
- 6.2.1. PBN Sheet/Plates
- 6.2.2. PBN Crucibles
- 6.2.3. PBN Heaters
- 6.2.4. PBN Boat
- 6.2.5. PBN Coating
- 6.2.6. Others
- 6.1. Market Analysis, Insights and Forecast - by Application
- 7. South America Pyrolytic Boron Nitride Pbn Components Analysis, Insights and Forecast, 2020-2032
- 7.1. Market Analysis, Insights and Forecast - by Application
- 7.1.1. Semiconductor Industry
- 7.1.2. OLED
- 7.1.3. Others
- 7.2. Market Analysis, Insights and Forecast - by Type
- 7.2.1. PBN Sheet/Plates
- 7.2.2. PBN Crucibles
- 7.2.3. PBN Heaters
- 7.2.4. PBN Boat
- 7.2.5. PBN Coating
- 7.2.6. Others
- 7.1. Market Analysis, Insights and Forecast - by Application
- 8. Europe Pyrolytic Boron Nitride Pbn Components Analysis, Insights and Forecast, 2020-2032
- 8.1. Market Analysis, Insights and Forecast - by Application
- 8.1.1. Semiconductor Industry
- 8.1.2. OLED
- 8.1.3. Others
- 8.2. Market Analysis, Insights and Forecast - by Type
- 8.2.1. PBN Sheet/Plates
- 8.2.2. PBN Crucibles
- 8.2.3. PBN Heaters
- 8.2.4. PBN Boat
- 8.2.5. PBN Coating
- 8.2.6. Others
- 8.1. Market Analysis, Insights and Forecast - by Application
- 9. Middle East & Africa Pyrolytic Boron Nitride Pbn Components Analysis, Insights and Forecast, 2020-2032
- 9.1. Market Analysis, Insights and Forecast - by Application
- 9.1.1. Semiconductor Industry
- 9.1.2. OLED
- 9.1.3. Others
- 9.2. Market Analysis, Insights and Forecast - by Type
- 9.2.1. PBN Sheet/Plates
- 9.2.2. PBN Crucibles
- 9.2.3. PBN Heaters
- 9.2.4. PBN Boat
- 9.2.5. PBN Coating
- 9.2.6. Others
- 9.1. Market Analysis, Insights and Forecast - by Application
- 10. Asia Pacific Pyrolytic Boron Nitride Pbn Components Analysis, Insights and Forecast, 2020-2032
- 10.1. Market Analysis, Insights and Forecast - by Application
- 10.1.1. Semiconductor Industry
- 10.1.2. OLED
- 10.1.3. Others
- 10.2. Market Analysis, Insights and Forecast - by Type
- 10.2.1. PBN Sheet/Plates
- 10.2.2. PBN Crucibles
- 10.2.3. PBN Heaters
- 10.2.4. PBN Boat
- 10.2.5. PBN Coating
- 10.2.6. Others
- 10.1. Market Analysis, Insights and Forecast - by Application
- 11. Competitive Analysis
- 11.1. Global Market Share Analysis 2025
- 11.2. Company Profiles
- 11.2.1 Beijing Boyu Semiconductor
- 11.2.1.1. Overview
- 11.2.1.2. Products
- 11.2.1.3. SWOT Analysis
- 11.2.1.4. Recent Developments
- 11.2.1.5. Financials (Based on Availability)
- 11.2.2 Shin-Etsu Chemical
- 11.2.2.1. Overview
- 11.2.2.2. Products
- 11.2.2.3. SWOT Analysis
- 11.2.2.4. Recent Developments
- 11.2.2.5. Financials (Based on Availability)
- 11.2.3 Momentive Technologies
- 11.2.3.1. Overview
- 11.2.3.2. Products
- 11.2.3.3. SWOT Analysis
- 11.2.3.4. Recent Developments
- 11.2.3.5. Financials (Based on Availability)
- 11.2.4 Guojing New Material
- 11.2.4.1. Overview
- 11.2.4.2. Products
- 11.2.4.3. SWOT Analysis
- 11.2.4.4. Recent Developments
- 11.2.4.5. Financials (Based on Availability)
- 11.2.5 Zhejiang Nuohua Ceramic
- 11.2.5.1. Overview
- 11.2.5.2. Products
- 11.2.5.3. SWOT Analysis
- 11.2.5.4. Recent Developments
- 11.2.5.5. Financials (Based on Availability)
- 11.2.6 CVT GmbH & Co. KG
- 11.2.6.1. Overview
- 11.2.6.2. Products
- 11.2.6.3. SWOT Analysis
- 11.2.6.4. Recent Developments
- 11.2.6.5. Financials (Based on Availability)
- 11.2.7 Yantai HeFuxiang Ceramics
- 11.2.7.1. Overview
- 11.2.7.2. Products
- 11.2.7.3. SWOT Analysis
- 11.2.7.4. Recent Developments
- 11.2.7.5. Financials (Based on Availability)
- 11.2.8 Morgan Advanced Materials
- 11.2.8.1. Overview
- 11.2.8.2. Products
- 11.2.8.3. SWOT Analysis
- 11.2.8.4. Recent Developments
- 11.2.8.5. Financials (Based on Availability)
- 11.2.9 Stanford Advanced Materials
- 11.2.9.1. Overview
- 11.2.9.2. Products
- 11.2.9.3. SWOT Analysis
- 11.2.9.4. Recent Developments
- 11.2.9.5. Financials (Based on Availability)
- 11.2.10 Thermic Edge
- 11.2.10.1. Overview
- 11.2.10.2. Products
- 11.2.10.3. SWOT Analysis
- 11.2.10.4. Recent Developments
- 11.2.10.5. Financials (Based on Availability)
- 11.2.1 Beijing Boyu Semiconductor
List of Figures
- Figure 1: Global Pyrolytic Boron Nitride Pbn Components Revenue Breakdown (million, %) by Region 2025 & 2033
- Figure 2: Global Pyrolytic Boron Nitride Pbn Components Volume Breakdown (K, %) by Region 2025 & 2033
- Figure 3: North America Pyrolytic Boron Nitride Pbn Components Revenue (million), by Application 2025 & 2033
- Figure 4: North America Pyrolytic Boron Nitride Pbn Components Volume (K), by Application 2025 & 2033
- Figure 5: North America Pyrolytic Boron Nitride Pbn Components Revenue Share (%), by Application 2025 & 2033
- Figure 6: North America Pyrolytic Boron Nitride Pbn Components Volume Share (%), by Application 2025 & 2033
- Figure 7: North America Pyrolytic Boron Nitride Pbn Components Revenue (million), by Type 2025 & 2033
- Figure 8: North America Pyrolytic Boron Nitride Pbn Components Volume (K), by Type 2025 & 2033
- Figure 9: North America Pyrolytic Boron Nitride Pbn Components Revenue Share (%), by Type 2025 & 2033
- Figure 10: North America Pyrolytic Boron Nitride Pbn Components Volume Share (%), by Type 2025 & 2033
- Figure 11: North America Pyrolytic Boron Nitride Pbn Components Revenue (million), by Country 2025 & 2033
- Figure 12: North America Pyrolytic Boron Nitride Pbn Components Volume (K), by Country 2025 & 2033
- Figure 13: North America Pyrolytic Boron Nitride Pbn Components Revenue Share (%), by Country 2025 & 2033
- Figure 14: North America Pyrolytic Boron Nitride Pbn Components Volume Share (%), by Country 2025 & 2033
- Figure 15: South America Pyrolytic Boron Nitride Pbn Components Revenue (million), by Application 2025 & 2033
- Figure 16: South America Pyrolytic Boron Nitride Pbn Components Volume (K), by Application 2025 & 2033
- Figure 17: South America Pyrolytic Boron Nitride Pbn Components Revenue Share (%), by Application 2025 & 2033
- Figure 18: South America Pyrolytic Boron Nitride Pbn Components Volume Share (%), by Application 2025 & 2033
- Figure 19: South America Pyrolytic Boron Nitride Pbn Components Revenue (million), by Type 2025 & 2033
- Figure 20: South America Pyrolytic Boron Nitride Pbn Components Volume (K), by Type 2025 & 2033
- Figure 21: South America Pyrolytic Boron Nitride Pbn Components Revenue Share (%), by Type 2025 & 2033
- Figure 22: South America Pyrolytic Boron Nitride Pbn Components Volume Share (%), by Type 2025 & 2033
- Figure 23: South America Pyrolytic Boron Nitride Pbn Components Revenue (million), by Country 2025 & 2033
- Figure 24: South America Pyrolytic Boron Nitride Pbn Components Volume (K), by Country 2025 & 2033
- Figure 25: South America Pyrolytic Boron Nitride Pbn Components Revenue Share (%), by Country 2025 & 2033
- Figure 26: South America Pyrolytic Boron Nitride Pbn Components Volume Share (%), by Country 2025 & 2033
- Figure 27: Europe Pyrolytic Boron Nitride Pbn Components Revenue (million), by Application 2025 & 2033
- Figure 28: Europe Pyrolytic Boron Nitride Pbn Components Volume (K), by Application 2025 & 2033
- Figure 29: Europe Pyrolytic Boron Nitride Pbn Components Revenue Share (%), by Application 2025 & 2033
- Figure 30: Europe Pyrolytic Boron Nitride Pbn Components Volume Share (%), by Application 2025 & 2033
- Figure 31: Europe Pyrolytic Boron Nitride Pbn Components Revenue (million), by Type 2025 & 2033
- Figure 32: Europe Pyrolytic Boron Nitride Pbn Components Volume (K), by Type 2025 & 2033
- Figure 33: Europe Pyrolytic Boron Nitride Pbn Components Revenue Share (%), by Type 2025 & 2033
- Figure 34: Europe Pyrolytic Boron Nitride Pbn Components Volume Share (%), by Type 2025 & 2033
- Figure 35: Europe Pyrolytic Boron Nitride Pbn Components Revenue (million), by Country 2025 & 2033
- Figure 36: Europe Pyrolytic Boron Nitride Pbn Components Volume (K), by Country 2025 & 2033
- Figure 37: Europe Pyrolytic Boron Nitride Pbn Components Revenue Share (%), by Country 2025 & 2033
- Figure 38: Europe Pyrolytic Boron Nitride Pbn Components Volume Share (%), by Country 2025 & 2033
- Figure 39: Middle East & Africa Pyrolytic Boron Nitride Pbn Components Revenue (million), by Application 2025 & 2033
- Figure 40: Middle East & Africa Pyrolytic Boron Nitride Pbn Components Volume (K), by Application 2025 & 2033
- Figure 41: Middle East & Africa Pyrolytic Boron Nitride Pbn Components Revenue Share (%), by Application 2025 & 2033
- Figure 42: Middle East & Africa Pyrolytic Boron Nitride Pbn Components Volume Share (%), by Application 2025 & 2033
- Figure 43: Middle East & Africa Pyrolytic Boron Nitride Pbn Components Revenue (million), by Type 2025 & 2033
- Figure 44: Middle East & Africa Pyrolytic Boron Nitride Pbn Components Volume (K), by Type 2025 & 2033
- Figure 45: Middle East & Africa Pyrolytic Boron Nitride Pbn Components Revenue Share (%), by Type 2025 & 2033
- Figure 46: Middle East & Africa Pyrolytic Boron Nitride Pbn Components Volume Share (%), by Type 2025 & 2033
- Figure 47: Middle East & Africa Pyrolytic Boron Nitride Pbn Components Revenue (million), by Country 2025 & 2033
- Figure 48: Middle East & Africa Pyrolytic Boron Nitride Pbn Components Volume (K), by Country 2025 & 2033
- Figure 49: Middle East & Africa Pyrolytic Boron Nitride Pbn Components Revenue Share (%), by Country 2025 & 2033
- Figure 50: Middle East & Africa Pyrolytic Boron Nitride Pbn Components Volume Share (%), by Country 2025 & 2033
- Figure 51: Asia Pacific Pyrolytic Boron Nitride Pbn Components Revenue (million), by Application 2025 & 2033
- Figure 52: Asia Pacific Pyrolytic Boron Nitride Pbn Components Volume (K), by Application 2025 & 2033
- Figure 53: Asia Pacific Pyrolytic Boron Nitride Pbn Components Revenue Share (%), by Application 2025 & 2033
- Figure 54: Asia Pacific Pyrolytic Boron Nitride Pbn Components Volume Share (%), by Application 2025 & 2033
- Figure 55: Asia Pacific Pyrolytic Boron Nitride Pbn Components Revenue (million), by Type 2025 & 2033
- Figure 56: Asia Pacific Pyrolytic Boron Nitride Pbn Components Volume (K), by Type 2025 & 2033
- Figure 57: Asia Pacific Pyrolytic Boron Nitride Pbn Components Revenue Share (%), by Type 2025 & 2033
- Figure 58: Asia Pacific Pyrolytic Boron Nitride Pbn Components Volume Share (%), by Type 2025 & 2033
- Figure 59: Asia Pacific Pyrolytic Boron Nitride Pbn Components Revenue (million), by Country 2025 & 2033
- Figure 60: Asia Pacific Pyrolytic Boron Nitride Pbn Components Volume (K), by Country 2025 & 2033
- Figure 61: Asia Pacific Pyrolytic Boron Nitride Pbn Components Revenue Share (%), by Country 2025 & 2033
- Figure 62: Asia Pacific Pyrolytic Boron Nitride Pbn Components Volume Share (%), by Country 2025 & 2033
List of Tables
- Table 1: Global Pyrolytic Boron Nitride Pbn Components Revenue million Forecast, by Application 2020 & 2033
- Table 2: Global Pyrolytic Boron Nitride Pbn Components Volume K Forecast, by Application 2020 & 2033
- Table 3: Global Pyrolytic Boron Nitride Pbn Components Revenue million Forecast, by Type 2020 & 2033
- Table 4: Global Pyrolytic Boron Nitride Pbn Components Volume K Forecast, by Type 2020 & 2033
- Table 5: Global Pyrolytic Boron Nitride Pbn Components Revenue million Forecast, by Region 2020 & 2033
- Table 6: Global Pyrolytic Boron Nitride Pbn Components Volume K Forecast, by Region 2020 & 2033
- Table 7: Global Pyrolytic Boron Nitride Pbn Components Revenue million Forecast, by Application 2020 & 2033
- Table 8: Global Pyrolytic Boron Nitride Pbn Components Volume K Forecast, by Application 2020 & 2033
- Table 9: Global Pyrolytic Boron Nitride Pbn Components Revenue million Forecast, by Type 2020 & 2033
- Table 10: Global Pyrolytic Boron Nitride Pbn Components Volume K Forecast, by Type 2020 & 2033
- Table 11: Global Pyrolytic Boron Nitride Pbn Components Revenue million Forecast, by Country 2020 & 2033
- Table 12: Global Pyrolytic Boron Nitride Pbn Components Volume K Forecast, by Country 2020 & 2033
- Table 13: United States Pyrolytic Boron Nitride Pbn Components Revenue (million) Forecast, by Application 2020 & 2033
- Table 14: United States Pyrolytic Boron Nitride Pbn Components Volume (K) Forecast, by Application 2020 & 2033
- Table 15: Canada Pyrolytic Boron Nitride Pbn Components Revenue (million) Forecast, by Application 2020 & 2033
- Table 16: Canada Pyrolytic Boron Nitride Pbn Components Volume (K) Forecast, by Application 2020 & 2033
- Table 17: Mexico Pyrolytic Boron Nitride Pbn Components Revenue (million) Forecast, by Application 2020 & 2033
- Table 18: Mexico Pyrolytic Boron Nitride Pbn Components Volume (K) Forecast, by Application 2020 & 2033
- Table 19: Global Pyrolytic Boron Nitride Pbn Components Revenue million Forecast, by Application 2020 & 2033
- Table 20: Global Pyrolytic Boron Nitride Pbn Components Volume K Forecast, by Application 2020 & 2033
- Table 21: Global Pyrolytic Boron Nitride Pbn Components Revenue million Forecast, by Type 2020 & 2033
- Table 22: Global Pyrolytic Boron Nitride Pbn Components Volume K Forecast, by Type 2020 & 2033
- Table 23: Global Pyrolytic Boron Nitride Pbn Components Revenue million Forecast, by Country 2020 & 2033
- Table 24: Global Pyrolytic Boron Nitride Pbn Components Volume K Forecast, by Country 2020 & 2033
- Table 25: Brazil Pyrolytic Boron Nitride Pbn Components Revenue (million) Forecast, by Application 2020 & 2033
- Table 26: Brazil Pyrolytic Boron Nitride Pbn Components Volume (K) Forecast, by Application 2020 & 2033
- Table 27: Argentina Pyrolytic Boron Nitride Pbn Components Revenue (million) Forecast, by Application 2020 & 2033
- Table 28: Argentina Pyrolytic Boron Nitride Pbn Components Volume (K) Forecast, by Application 2020 & 2033
- Table 29: Rest of South America Pyrolytic Boron Nitride Pbn Components Revenue (million) Forecast, by Application 2020 & 2033
- Table 30: Rest of South America Pyrolytic Boron Nitride Pbn Components Volume (K) Forecast, by Application 2020 & 2033
- Table 31: Global Pyrolytic Boron Nitride Pbn Components Revenue million Forecast, by Application 2020 & 2033
- Table 32: Global Pyrolytic Boron Nitride Pbn Components Volume K Forecast, by Application 2020 & 2033
- Table 33: Global Pyrolytic Boron Nitride Pbn Components Revenue million Forecast, by Type 2020 & 2033
- Table 34: Global Pyrolytic Boron Nitride Pbn Components Volume K Forecast, by Type 2020 & 2033
- Table 35: Global Pyrolytic Boron Nitride Pbn Components Revenue million Forecast, by Country 2020 & 2033
- Table 36: Global Pyrolytic Boron Nitride Pbn Components Volume K Forecast, by Country 2020 & 2033
- Table 37: United Kingdom Pyrolytic Boron Nitride Pbn Components Revenue (million) Forecast, by Application 2020 & 2033
- Table 38: United Kingdom Pyrolytic Boron Nitride Pbn Components Volume (K) Forecast, by Application 2020 & 2033
- Table 39: Germany Pyrolytic Boron Nitride Pbn Components Revenue (million) Forecast, by Application 2020 & 2033
- Table 40: Germany Pyrolytic Boron Nitride Pbn Components Volume (K) Forecast, by Application 2020 & 2033
- Table 41: France Pyrolytic Boron Nitride Pbn Components Revenue (million) Forecast, by Application 2020 & 2033
- Table 42: France Pyrolytic Boron Nitride Pbn Components Volume (K) Forecast, by Application 2020 & 2033
- Table 43: Italy Pyrolytic Boron Nitride Pbn Components Revenue (million) Forecast, by Application 2020 & 2033
- Table 44: Italy Pyrolytic Boron Nitride Pbn Components Volume (K) Forecast, by Application 2020 & 2033
- Table 45: Spain Pyrolytic Boron Nitride Pbn Components Revenue (million) Forecast, by Application 2020 & 2033
- Table 46: Spain Pyrolytic Boron Nitride Pbn Components Volume (K) Forecast, by Application 2020 & 2033
- Table 47: Russia Pyrolytic Boron Nitride Pbn Components Revenue (million) Forecast, by Application 2020 & 2033
- Table 48: Russia Pyrolytic Boron Nitride Pbn Components Volume (K) Forecast, by Application 2020 & 2033
- Table 49: Benelux Pyrolytic Boron Nitride Pbn Components Revenue (million) Forecast, by Application 2020 & 2033
- Table 50: Benelux Pyrolytic Boron Nitride Pbn Components Volume (K) Forecast, by Application 2020 & 2033
- Table 51: Nordics Pyrolytic Boron Nitride Pbn Components Revenue (million) Forecast, by Application 2020 & 2033
- Table 52: Nordics Pyrolytic Boron Nitride Pbn Components Volume (K) Forecast, by Application 2020 & 2033
- Table 53: Rest of Europe Pyrolytic Boron Nitride Pbn Components Revenue (million) Forecast, by Application 2020 & 2033
- Table 54: Rest of Europe Pyrolytic Boron Nitride Pbn Components Volume (K) Forecast, by Application 2020 & 2033
- Table 55: Global Pyrolytic Boron Nitride Pbn Components Revenue million Forecast, by Application 2020 & 2033
- Table 56: Global Pyrolytic Boron Nitride Pbn Components Volume K Forecast, by Application 2020 & 2033
- Table 57: Global Pyrolytic Boron Nitride Pbn Components Revenue million Forecast, by Type 2020 & 2033
- Table 58: Global Pyrolytic Boron Nitride Pbn Components Volume K Forecast, by Type 2020 & 2033
- Table 59: Global Pyrolytic Boron Nitride Pbn Components Revenue million Forecast, by Country 2020 & 2033
- Table 60: Global Pyrolytic Boron Nitride Pbn Components Volume K Forecast, by Country 2020 & 2033
- Table 61: Turkey Pyrolytic Boron Nitride Pbn Components Revenue (million) Forecast, by Application 2020 & 2033
- Table 62: Turkey Pyrolytic Boron Nitride Pbn Components Volume (K) Forecast, by Application 2020 & 2033
- Table 63: Israel Pyrolytic Boron Nitride Pbn Components Revenue (million) Forecast, by Application 2020 & 2033
- Table 64: Israel Pyrolytic Boron Nitride Pbn Components Volume (K) Forecast, by Application 2020 & 2033
- Table 65: GCC Pyrolytic Boron Nitride Pbn Components Revenue (million) Forecast, by Application 2020 & 2033
- Table 66: GCC Pyrolytic Boron Nitride Pbn Components Volume (K) Forecast, by Application 2020 & 2033
- Table 67: North Africa Pyrolytic Boron Nitride Pbn Components Revenue (million) Forecast, by Application 2020 & 2033
- Table 68: North Africa Pyrolytic Boron Nitride Pbn Components Volume (K) Forecast, by Application 2020 & 2033
- Table 69: South Africa Pyrolytic Boron Nitride Pbn Components Revenue (million) Forecast, by Application 2020 & 2033
- Table 70: South Africa Pyrolytic Boron Nitride Pbn Components Volume (K) Forecast, by Application 2020 & 2033
- Table 71: Rest of Middle East & Africa Pyrolytic Boron Nitride Pbn Components Revenue (million) Forecast, by Application 2020 & 2033
- Table 72: Rest of Middle East & Africa Pyrolytic Boron Nitride Pbn Components Volume (K) Forecast, by Application 2020 & 2033
- Table 73: Global Pyrolytic Boron Nitride Pbn Components Revenue million Forecast, by Application 2020 & 2033
- Table 74: Global Pyrolytic Boron Nitride Pbn Components Volume K Forecast, by Application 2020 & 2033
- Table 75: Global Pyrolytic Boron Nitride Pbn Components Revenue million Forecast, by Type 2020 & 2033
- Table 76: Global Pyrolytic Boron Nitride Pbn Components Volume K Forecast, by Type 2020 & 2033
- Table 77: Global Pyrolytic Boron Nitride Pbn Components Revenue million Forecast, by Country 2020 & 2033
- Table 78: Global Pyrolytic Boron Nitride Pbn Components Volume K Forecast, by Country 2020 & 2033
- Table 79: China Pyrolytic Boron Nitride Pbn Components Revenue (million) Forecast, by Application 2020 & 2033
- Table 80: China Pyrolytic Boron Nitride Pbn Components Volume (K) Forecast, by Application 2020 & 2033
- Table 81: India Pyrolytic Boron Nitride Pbn Components Revenue (million) Forecast, by Application 2020 & 2033
- Table 82: India Pyrolytic Boron Nitride Pbn Components Volume (K) Forecast, by Application 2020 & 2033
- Table 83: Japan Pyrolytic Boron Nitride Pbn Components Revenue (million) Forecast, by Application 2020 & 2033
- Table 84: Japan Pyrolytic Boron Nitride Pbn Components Volume (K) Forecast, by Application 2020 & 2033
- Table 85: South Korea Pyrolytic Boron Nitride Pbn Components Revenue (million) Forecast, by Application 2020 & 2033
- Table 86: South Korea Pyrolytic Boron Nitride Pbn Components Volume (K) Forecast, by Application 2020 & 2033
- Table 87: ASEAN Pyrolytic Boron Nitride Pbn Components Revenue (million) Forecast, by Application 2020 & 2033
- Table 88: ASEAN Pyrolytic Boron Nitride Pbn Components Volume (K) Forecast, by Application 2020 & 2033
- Table 89: Oceania Pyrolytic Boron Nitride Pbn Components Revenue (million) Forecast, by Application 2020 & 2033
- Table 90: Oceania Pyrolytic Boron Nitride Pbn Components Volume (K) Forecast, by Application 2020 & 2033
- Table 91: Rest of Asia Pacific Pyrolytic Boron Nitride Pbn Components Revenue (million) Forecast, by Application 2020 & 2033
- Table 92: Rest of Asia Pacific Pyrolytic Boron Nitride Pbn Components Volume (K) Forecast, by Application 2020 & 2033
Frequently Asked Questions
1. What is the projected Compound Annual Growth Rate (CAGR) of the Pyrolytic Boron Nitride Pbn Components?
The projected CAGR is approximately 4.3%.
2. Which companies are prominent players in the Pyrolytic Boron Nitride Pbn Components?
Key companies in the market include Beijing Boyu Semiconductor, Shin-Etsu Chemical, Momentive Technologies, Guojing New Material, Zhejiang Nuohua Ceramic, CVT GmbH & Co. KG, Yantai HeFuxiang Ceramics, Morgan Advanced Materials, Stanford Advanced Materials, Thermic Edge.
3. What are the main segments of the Pyrolytic Boron Nitride Pbn Components?
The market segments include Application, Type.
4. Can you provide details about the market size?
The market size is estimated to be USD 99 million as of 2022.
5. What are some drivers contributing to market growth?
N/A
6. What are the notable trends driving market growth?
N/A
7. Are there any restraints impacting market growth?
N/A
8. Can you provide examples of recent developments in the market?
N/A
9. What pricing options are available for accessing the report?
Pricing options include single-user, multi-user, and enterprise licenses priced at USD 3950.00, USD 5925.00, and USD 7900.00 respectively.
10. Is the market size provided in terms of value or volume?
The market size is provided in terms of value, measured in million and volume, measured in K.
11. Are there any specific market keywords associated with the report?
Yes, the market keyword associated with the report is "Pyrolytic Boron Nitride Pbn Components," which aids in identifying and referencing the specific market segment covered.
12. How do I determine which pricing option suits my needs best?
The pricing options vary based on user requirements and access needs. Individual users may opt for single-user licenses, while businesses requiring broader access may choose multi-user or enterprise licenses for cost-effective access to the report.
13. Are there any additional resources or data provided in the Pyrolytic Boron Nitride Pbn Components report?
While the report offers comprehensive insights, it's advisable to review the specific contents or supplementary materials provided to ascertain if additional resources or data are available.
14. How can I stay updated on further developments or reports in the Pyrolytic Boron Nitride Pbn Components?
To stay informed about further developments, trends, and reports in the Pyrolytic Boron Nitride Pbn Components, consider subscribing to industry newsletters, following relevant companies and organizations, or regularly checking reputable industry news sources and publications.
Methodology
Step 1 - Identification of Relevant Samples Size from Population Database


Step 2 - Approaches for Defining Global Market Size (Value, Volume* & Price*)

Note*: In applicable scenarios
Step 3 - Data Sources
Primary Research
- Web Analytics
- Survey Reports
- Research Institute
- Latest Research Reports
- Opinion Leaders
Secondary Research
- Annual Reports
- White Paper
- Latest Press Release
- Industry Association
- Paid Database
- Investor Presentations

Step 4 - Data Triangulation
Involves using different sources of information in order to increase the validity of a study
These sources are likely to be stakeholders in a program - participants, other researchers, program staff, other community members, and so on.
Then we put all data in single framework & apply various statistical tools to find out the dynamic on the market.
During the analysis stage, feedback from the stakeholder groups would be compared to determine areas of agreement as well as areas of divergence