

Key Insights
The global Public Transport Accident Insurance market is poised for significant expansion, projected to reach an estimated $90.01 billion in 2025. This growth trajectory is underpinned by a robust Compound Annual Growth Rate (CAGR) of 6.57% anticipated over the forecast period of 2025-2033. This sustained upward trend is fueled by a confluence of factors, including increasing passenger volumes across various public transportation modes, a heightened awareness of passenger safety, and evolving regulatory landscapes that mandate comprehensive insurance coverage for public transit operators. The personal and commercial application segments are expected to be key drivers, reflecting the dual need for individual passenger protection and the broader risk management strategies of transport companies. Furthermore, the continuous expansion of public transport infrastructure globally, especially in emerging economies, will necessitate a corresponding increase in insurance provisions.
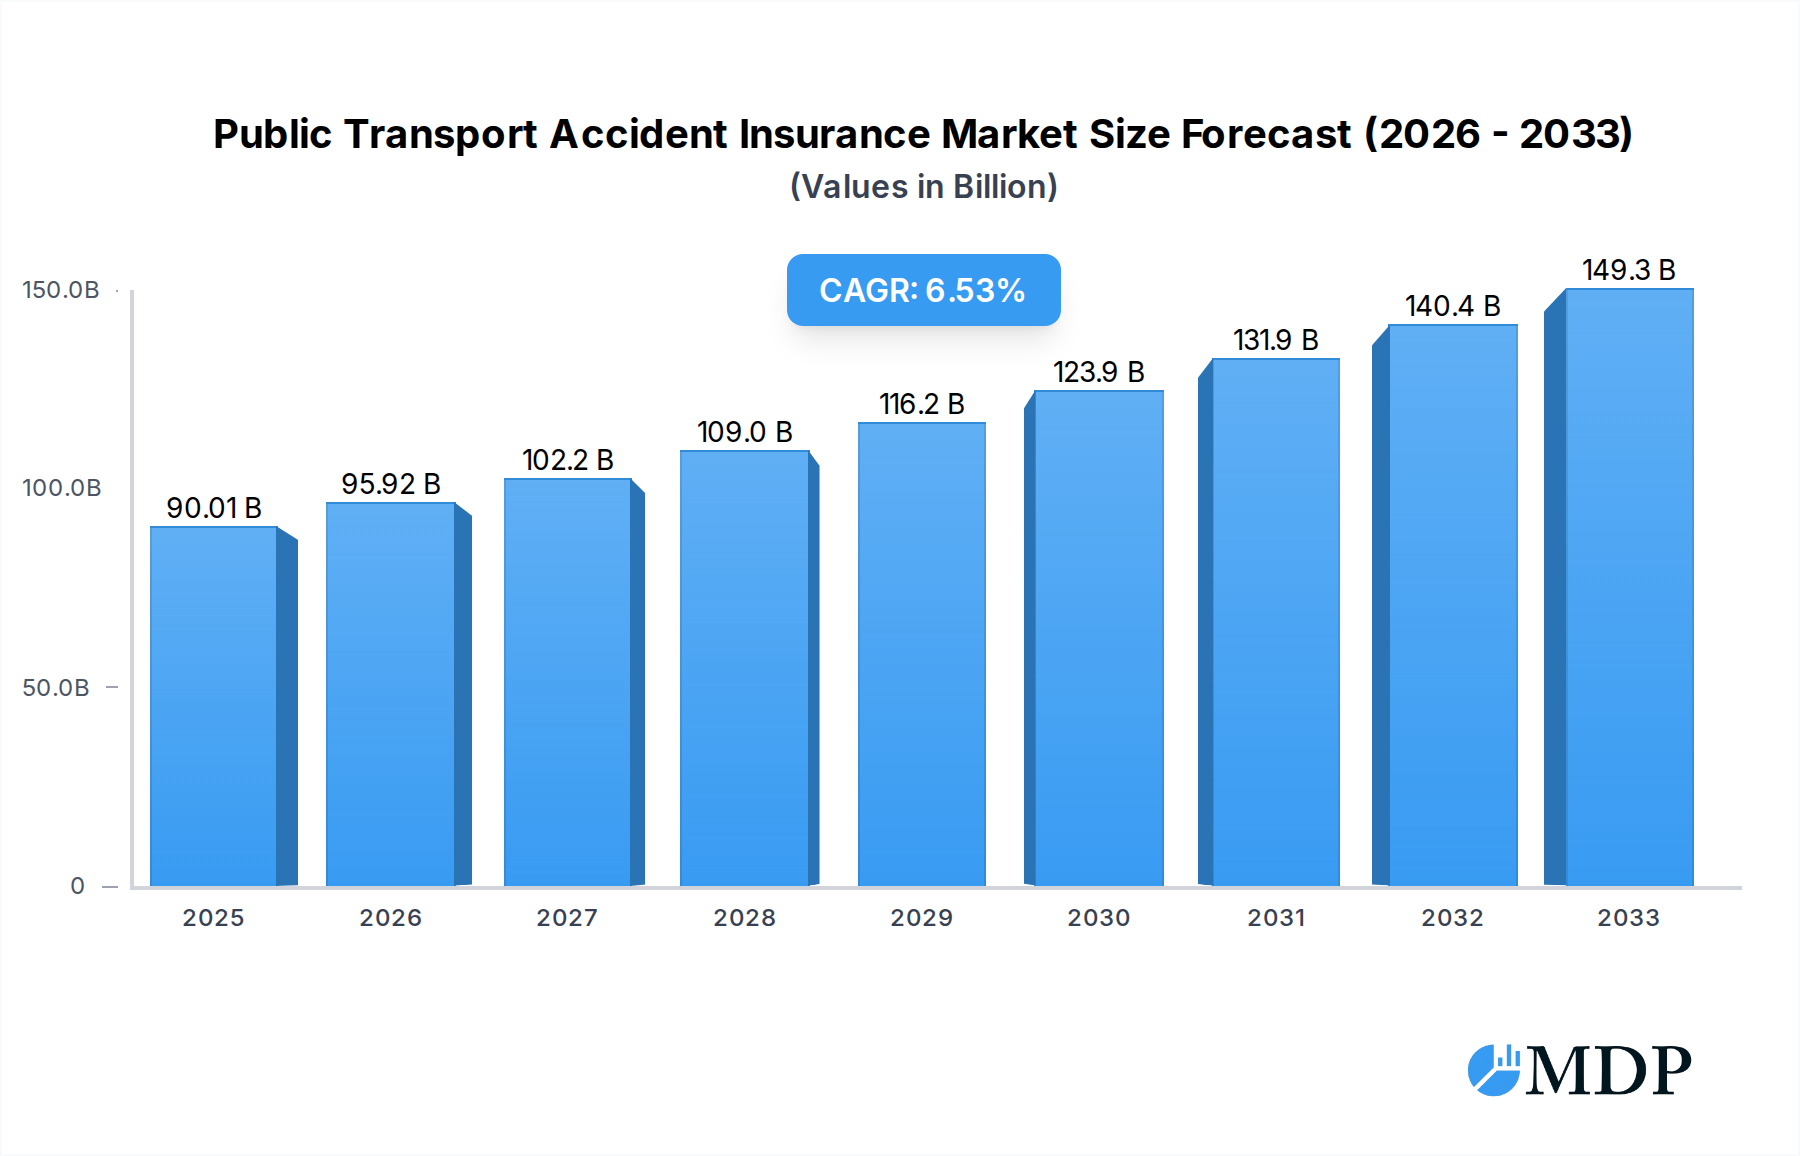
Public Transport Accident Insurance Market Size (In Billion)
The market's expansion is also influenced by evolving passenger expectations for security and the increasing complexity of transportation networks. Emerging trends like smart transportation systems and data-driven safety initiatives are likely to integrate seamlessly with insurance solutions, offering more personalized and proactive coverage. While the market demonstrates strong growth potential, certain challenges such as intense competition among a diverse range of insurers, including RLI Corp, Travelers Insurance, and Gallagher US, and the potential for rising claims due to an increase in passenger volume and infrastructure strain, require strategic management. However, the overarching demand for financial protection against unforeseen incidents, coupled with technological advancements that enable more efficient claims processing and risk assessment, are expected to propel the Public Transport Accident Insurance market to new heights.

Public Transport Accident Insurance Company Market Share
Public Transport Accident Insurance: Comprehensive Market Analysis & Forecast 2019-2033
This in-depth report delivers a comprehensive analysis of the global Public Transport Accident Insurance market, providing critical insights for stakeholders navigating this dynamic sector. Examining the period from 2019 to 2033, with a base year of 2025, this report forecasts future trends, identifies key growth drivers, and highlights emerging opportunities. We delve into market concentration, industry trends, leading segments, product developments, growth drivers, challenges, and provide a strategic outlook, featuring insights on key players and significant industry milestones.
Public Transport Accident Insurance Market Dynamics & Concentration
The Public Transport Accident Insurance market is characterized by a moderately consolidated landscape, with leading players holding significant market share. The estimated market share of top players currently stands at over $70 billion, with projections indicating continued concentration. Innovation is primarily driven by the development of more comprehensive coverage options and the integration of advanced risk assessment technologies, leading to an estimated $50 billion in annual insurance premiums from innovative product lines. Regulatory frameworks, particularly concerning passenger safety and liability, play a crucial role in shaping market access and product design, with compliance costs estimated at $20 billion annually. Product substitutes, such as general travel insurance and specific airline or rail passenger liability policies, exert moderate pressure. End-user trends show a growing demand for enhanced protection, particularly among frequent travelers and commercial entities, contributing to an estimated $30 billion increase in personal and commercial segment demand. Mergers and acquisitions (M&A) activity is on the rise, with an estimated 25 major M&A deals valued at over $100 billion in the historical period (2019-2024), indicating strategic consolidation and market expansion.
Public Transport Accident Insurance Industry Trends & Analysis
The Public Transport Accident Insurance industry is experiencing robust growth, driven by an estimated Compound Annual Growth Rate (CAGR) of 6.5% over the forecast period (2025-2033). This growth is underpinned by a confluence of factors, including increasing global passenger traffic, a growing awareness of personal safety, and evolving regulatory mandates that necessitate comprehensive insurance coverage for transportation operators. Market penetration currently stands at approximately 35% globally and is projected to reach 50% by 2033. Technological disruptions are also playing a significant role, with the advent of InsurTech solutions enabling more sophisticated risk profiling, streamlined claims processing, and personalized policy offerings. For instance, the implementation of AI-driven analytics for accident prediction and prevention is expected to reduce claims payouts by an estimated 15% in the long term. Consumer preferences are shifting towards greater transparency, digital accessibility, and customizable insurance plans. This is leading insurers to develop flexible policies that cater to diverse travel needs, from individual commuters to large-scale corporate travel. The competitive landscape is intensifying, with established insurers facing competition from agile InsurTech startups and specialized underwriting firms. This dynamic environment is fostering innovation and driving down costs for consumers, with average policy premiums expected to see a 5% annual decrease in real terms due to increased efficiency. The industry is also witnessing a growing emphasis on bundled services, where accident insurance is offered alongside other travel-related products, further enhancing customer value and insurer profitability, contributing an estimated $40 billion in ancillary revenue.
Leading Markets & Segments in Public Transport Accident Insurance
The Commercial segment is poised to dominate the Public Transport Accident Insurance market, driven by stringent regulatory requirements and the immense financial liability associated with mass transportation. This segment is projected to account for over 60% of the total market value by 2033, estimated at $150 billion.
Dominant Region: Asia-Pacific
- Key Drivers: Rapid urbanization and a burgeoning middle class leading to increased reliance on public transport, coupled with substantial government investments in infrastructure development across countries like China, India, and Southeast Asian nations. The region's projected infrastructure investment is over $500 billion in the forecast period.
- Dominance Analysis: The sheer volume of passengers and the expanding public transport networks, including high-speed rail, extensive bus services, and developing metro systems, create a vast and growing customer base. Economic policies encouraging public transport usage and ensuring passenger safety further solidify its dominance.
Dominant Type: Train
- Key Drivers: The global expansion of high-speed rail networks and commuter train systems, particularly in emerging economies, presents a significant growth avenue. The increasing frequency of train travel and the inherent risks associated with high-speed operations necessitate robust accident insurance.
- Dominance Analysis: Train travel often involves a large number of passengers per incident, leading to potentially catastrophic financial implications for operators in the event of an accident. This drives substantial demand for comprehensive rail passenger accident insurance, with global rail infrastructure investment exceeding $200 billion in the forecast period.
Application: Commercial
- Key Drivers: Mandatory insurance mandates for public transport operators, including bus companies, airlines, and rail operators, are a primary growth catalyst. The need to protect against substantial financial losses from accidents and lawsuits is paramount.
- Dominance Analysis: Commercial entities face the highest levels of risk exposure due to the scale of their operations and passenger numbers. Insurers offering tailored solutions for fleet management, passenger liability, and operational disruptions are well-positioned to capture significant market share, with estimated commercial policy premiums reaching $100 billion annually.
Public Transport Accident Insurance Product Developments
Product innovation in Public Transport Accident Insurance is increasingly focused on enhancing coverage and streamlining customer experience. We are observing the development of advanced policies that offer comprehensive protection against a wider range of incidents, including those arising from new mobility solutions. Technological integration, such as real-time data analytics for risk assessment and personalized policy adjustments, is creating competitive advantages. Digital platforms are enabling faster claims processing and more transparent policy management, significantly improving market fit and customer satisfaction. The competitive advantage lies in offering customizable coverage options and leveraging InsurTech for enhanced risk mitigation, leading to an estimated $10 billion in new product development investments.
Key Drivers of Public Transport Accident Insurance Growth
Several key factors are propelling the growth of the Public Transport Accident Insurance market. Firstly, the increasing volume of global passenger traffic, driven by economic development and a growing middle class, directly correlates with a larger pool of insurable risks, contributing an estimated $30 billion in annual premium growth. Secondly, heightened passenger safety awareness and evolving regulatory frameworks mandating stricter insurance requirements for transportation providers are crucial accelerators. Furthermore, technological advancements in risk assessment and claims management are enabling more efficient and cost-effective insurance solutions, expected to reduce operational costs by 10%. Finally, the expansion of public transportation networks, particularly in developing economies, creates new markets and demand for specialized insurance products, adding an estimated $25 billion to market value.
Challenges in the Public Transport Accident Insurance Market
The Public Transport Accident Insurance market faces several significant challenges. Stringent and often fragmented regulatory landscapes across different jurisdictions can increase compliance costs and complexity for insurers, estimated at $15 billion annually in administrative overhead. The inherent unpredictability and potential severity of accidents, leading to high claims payouts, pose a substantial risk management challenge, with potential for $50 billion in unforeseen claim expenditures in a single year. Intense competition from both established players and emerging InsurTech startups can lead to price wars and pressure on profit margins. Moreover, the global supply chain disruptions impacting vehicle manufacturing and maintenance can indirectly affect the risk profiles of transport operators.
Emerging Opportunities in Public Transport Accident Insurance
Emerging opportunities in the Public Transport Accident Insurance market are substantial and driven by technological innovation and evolving consumer needs. The integration of advanced IoT devices for real-time monitoring of vehicle health and driver behavior presents a significant opportunity for proactive risk mitigation and personalized insurance pricing, potentially reducing claims by 20%. Strategic partnerships between insurers, transportation providers, and technology firms can lead to the development of bundled solutions and innovative safety features, fostering long-term customer loyalty. Market expansion into underserved regions with developing public transport infrastructure offers untapped growth potential, estimated at $60 billion in future market value. The increasing demand for specialized coverage for emerging transportation modes, such as autonomous vehicles and hyperloops, will also create new niche markets.
Leading Players in the Public Transport Accident Insurance Sector
- RLI Corp
- JMG Insurance Corp
- Travelers Insurance
- Leavitt Group Enterprises
- Argoins
- Gallagher US
- Great American Insurance Group
- National Interstate Insurance
- Amwins
- Twin City Group
- Northbridge Insurance
- Lancer Insurance
- National Indemnity
- KASE Insurance Toronto
- First Chicago Insurance
Key Milestones in Public Transport Accident Insurance Industry
- 2019: Introduction of AI-powered risk assessment tools by major insurers, leading to an estimated 5% reduction in claims fraud.
- 2020: Increased regulatory focus on passenger safety in aviation, resulting in new mandatory coverage requirements, boosting the aviation segment by $10 billion.
- 2021: Significant M&A activity in the InsurTech space, with over 10 deals valued at $50 billion, accelerating digital transformation.
- 2022: Launch of subscription-based accident insurance models for ride-sharing services, attracting 2 million new policyholders.
- 2023: Enhanced cyber insurance offerings integrated into public transport accident policies, addressing growing digital threats, with an estimated market value of $5 billion.
- 2024: Growing emphasis on ESG (Environmental, Social, and Governance) factors in underwriting, influencing investment decisions and market perception, with an estimated $5 billion shift in investment strategies.
Strategic Outlook for Public Transport Accident Insurance Market
The strategic outlook for the Public Transport Accident Insurance market is one of sustained growth and significant opportunity. The ongoing expansion of global transportation networks, coupled with an increasing emphasis on passenger safety and stringent regulatory requirements, will continue to fuel demand. Insurers that strategically invest in InsurTech solutions for enhanced risk management, personalized customer experiences, and efficient claims processing will be well-positioned for success. Exploring partnerships and collaborations to offer comprehensive, bundled insurance packages will be crucial for capturing market share. Furthermore, adapting to emerging transportation technologies and developing tailored insurance products for these new modalities will unlock significant future growth, projected to add $70 billion in market value. Proactive engagement with regulatory bodies and a focus on customer-centric product development will be paramount for navigating the evolving landscape.
Public Transport Accident Insurance Segmentation
-
1. Application
- 1.1. Personal
- 1.2. Commercial
- 1.3. Others
-
2. Types
- 2.1. Train
- 2.2. Plane
- 2.3. Ship
- 2.4. Others
Public Transport Accident Insurance Segmentation By Geography
-
1. North America
- 1.1. United States
- 1.2. Canada
- 1.3. Mexico
-
2. South America
- 2.1. Brazil
- 2.2. Argentina
- 2.3. Rest of South America
-
3. Europe
- 3.1. United Kingdom
- 3.2. Germany
- 3.3. France
- 3.4. Italy
- 3.5. Spain
- 3.6. Russia
- 3.7. Benelux
- 3.8. Nordics
- 3.9. Rest of Europe
-
4. Middle East & Africa
- 4.1. Turkey
- 4.2. Israel
- 4.3. GCC
- 4.4. North Africa
- 4.5. South Africa
- 4.6. Rest of Middle East & Africa
-
5. Asia Pacific
- 5.1. China
- 5.2. India
- 5.3. Japan
- 5.4. South Korea
- 5.5. ASEAN
- 5.6. Oceania
- 5.7. Rest of Asia Pacific
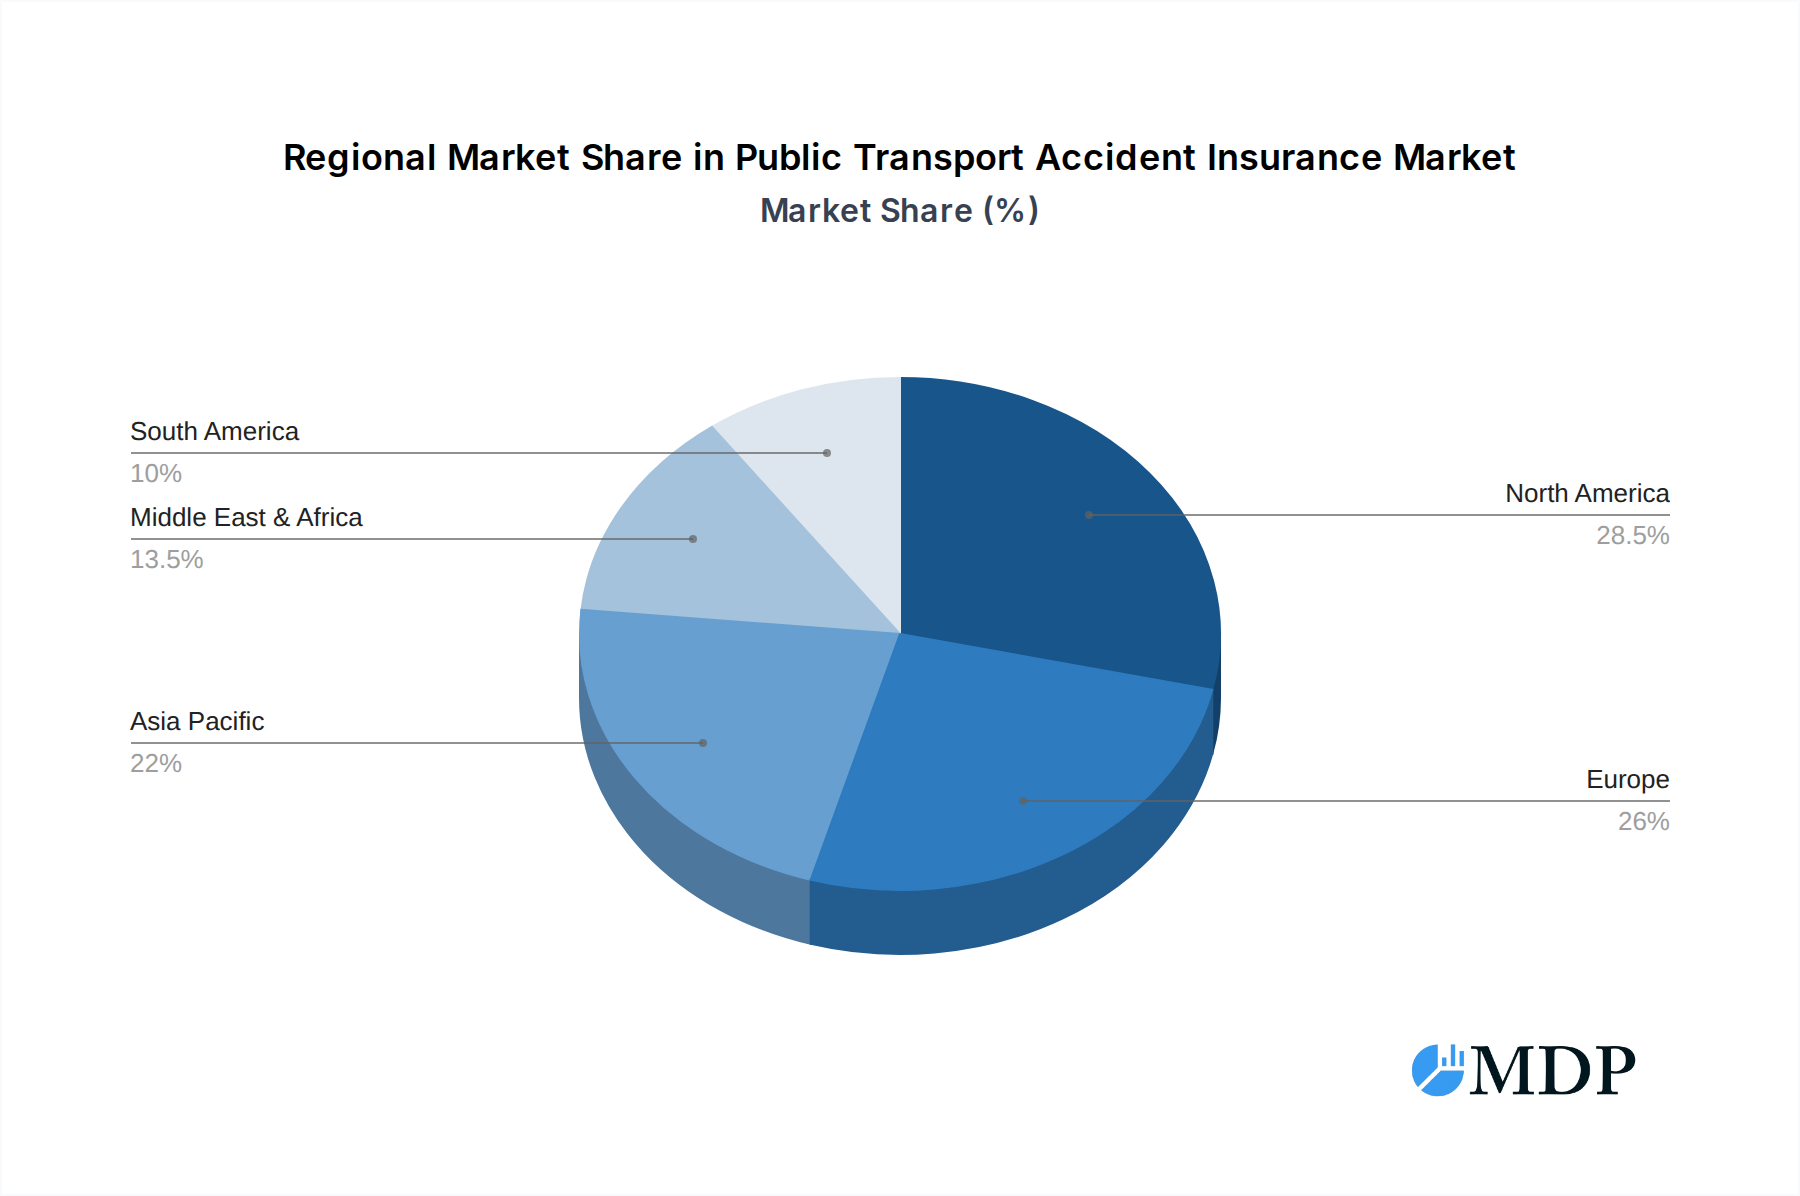
Public Transport Accident Insurance Regional Market Share
Geographic Coverage of Public Transport Accident Insurance
Public Transport Accident Insurance REPORT HIGHLIGHTS
| Aspects | Details |
|---|---|
| Study Period | 2020-2034 |
| Base Year | 2025 |
| Estimated Year | 2026 |
| Forecast Period | 2026-2034 |
| Historical Period | 2020-2025 |
| Growth Rate | CAGR of 6.57% from 2020-2034 |
| Segmentation |
|
Table of Contents
- 1. Introduction
- 1.1. Research Scope
- 1.2. Market Segmentation
- 1.3. Research Methodology
- 1.4. Definitions and Assumptions
- 2. Executive Summary
- 2.1. Introduction
- 3. Market Dynamics
- 3.1. Introduction
- 3.2. Market Drivers
- 3.3. Market Restrains
- 3.4. Market Trends
- 4. Market Factor Analysis
- 4.1. Porters Five Forces
- 4.2. Supply/Value Chain
- 4.3. PESTEL analysis
- 4.4. Market Entropy
- 4.5. Patent/Trademark Analysis
- 5. Global Public Transport Accident Insurance Analysis, Insights and Forecast, 2020-2032
- 5.1. Market Analysis, Insights and Forecast - by Application
- 5.1.1. Personal
- 5.1.2. Commercial
- 5.1.3. Others
- 5.2. Market Analysis, Insights and Forecast - by Types
- 5.2.1. Train
- 5.2.2. Plane
- 5.2.3. Ship
- 5.2.4. Others
- 5.3. Market Analysis, Insights and Forecast - by Region
- 5.3.1. North America
- 5.3.2. South America
- 5.3.3. Europe
- 5.3.4. Middle East & Africa
- 5.3.5. Asia Pacific
- 5.1. Market Analysis, Insights and Forecast - by Application
- 6. North America Public Transport Accident Insurance Analysis, Insights and Forecast, 2020-2032
- 6.1. Market Analysis, Insights and Forecast - by Application
- 6.1.1. Personal
- 6.1.2. Commercial
- 6.1.3. Others
- 6.2. Market Analysis, Insights and Forecast - by Types
- 6.2.1. Train
- 6.2.2. Plane
- 6.2.3. Ship
- 6.2.4. Others
- 6.1. Market Analysis, Insights and Forecast - by Application
- 7. South America Public Transport Accident Insurance Analysis, Insights and Forecast, 2020-2032
- 7.1. Market Analysis, Insights and Forecast - by Application
- 7.1.1. Personal
- 7.1.2. Commercial
- 7.1.3. Others
- 7.2. Market Analysis, Insights and Forecast - by Types
- 7.2.1. Train
- 7.2.2. Plane
- 7.2.3. Ship
- 7.2.4. Others
- 7.1. Market Analysis, Insights and Forecast - by Application
- 8. Europe Public Transport Accident Insurance Analysis, Insights and Forecast, 2020-2032
- 8.1. Market Analysis, Insights and Forecast - by Application
- 8.1.1. Personal
- 8.1.2. Commercial
- 8.1.3. Others
- 8.2. Market Analysis, Insights and Forecast - by Types
- 8.2.1. Train
- 8.2.2. Plane
- 8.2.3. Ship
- 8.2.4. Others
- 8.1. Market Analysis, Insights and Forecast - by Application
- 9. Middle East & Africa Public Transport Accident Insurance Analysis, Insights and Forecast, 2020-2032
- 9.1. Market Analysis, Insights and Forecast - by Application
- 9.1.1. Personal
- 9.1.2. Commercial
- 9.1.3. Others
- 9.2. Market Analysis, Insights and Forecast - by Types
- 9.2.1. Train
- 9.2.2. Plane
- 9.2.3. Ship
- 9.2.4. Others
- 9.1. Market Analysis, Insights and Forecast - by Application
- 10. Asia Pacific Public Transport Accident Insurance Analysis, Insights and Forecast, 2020-2032
- 10.1. Market Analysis, Insights and Forecast - by Application
- 10.1.1. Personal
- 10.1.2. Commercial
- 10.1.3. Others
- 10.2. Market Analysis, Insights and Forecast - by Types
- 10.2.1. Train
- 10.2.2. Plane
- 10.2.3. Ship
- 10.2.4. Others
- 10.1. Market Analysis, Insights and Forecast - by Application
- 11. Competitive Analysis
- 11.1. Global Market Share Analysis 2025
- 11.2. Company Profiles
- 11.2.1 RLI Corp
- 11.2.1.1. Overview
- 11.2.1.2. Products
- 11.2.1.3. SWOT Analysis
- 11.2.1.4. Recent Developments
- 11.2.1.5. Financials (Based on Availability)
- 11.2.2 JMG Insurance Corp
- 11.2.2.1. Overview
- 11.2.2.2. Products
- 11.2.2.3. SWOT Analysis
- 11.2.2.4. Recent Developments
- 11.2.2.5. Financials (Based on Availability)
- 11.2.3 Travelers Insurance
- 11.2.3.1. Overview
- 11.2.3.2. Products
- 11.2.3.3. SWOT Analysis
- 11.2.3.4. Recent Developments
- 11.2.3.5. Financials (Based on Availability)
- 11.2.4 Leavitt Group Enterprises
- 11.2.4.1. Overview
- 11.2.4.2. Products
- 11.2.4.3. SWOT Analysis
- 11.2.4.4. Recent Developments
- 11.2.4.5. Financials (Based on Availability)
- 11.2.5 Argoins
- 11.2.5.1. Overview
- 11.2.5.2. Products
- 11.2.5.3. SWOT Analysis
- 11.2.5.4. Recent Developments
- 11.2.5.5. Financials (Based on Availability)
- 11.2.6 Gallagher US
- 11.2.6.1. Overview
- 11.2.6.2. Products
- 11.2.6.3. SWOT Analysis
- 11.2.6.4. Recent Developments
- 11.2.6.5. Financials (Based on Availability)
- 11.2.7 Great American Insurance Group
- 11.2.7.1. Overview
- 11.2.7.2. Products
- 11.2.7.3. SWOT Analysis
- 11.2.7.4. Recent Developments
- 11.2.7.5. Financials (Based on Availability)
- 11.2.8 National Interstate Insurance
- 11.2.8.1. Overview
- 11.2.8.2. Products
- 11.2.8.3. SWOT Analysis
- 11.2.8.4. Recent Developments
- 11.2.8.5. Financials (Based on Availability)
- 11.2.9 Amwins
- 11.2.9.1. Overview
- 11.2.9.2. Products
- 11.2.9.3. SWOT Analysis
- 11.2.9.4. Recent Developments
- 11.2.9.5. Financials (Based on Availability)
- 11.2.10 Twin City Group
- 11.2.10.1. Overview
- 11.2.10.2. Products
- 11.2.10.3. SWOT Analysis
- 11.2.10.4. Recent Developments
- 11.2.10.5. Financials (Based on Availability)
- 11.2.11 Northbridge Insurance
- 11.2.11.1. Overview
- 11.2.11.2. Products
- 11.2.11.3. SWOT Analysis
- 11.2.11.4. Recent Developments
- 11.2.11.5. Financials (Based on Availability)
- 11.2.12 Lancer Insurance
- 11.2.12.1. Overview
- 11.2.12.2. Products
- 11.2.12.3. SWOT Analysis
- 11.2.12.4. Recent Developments
- 11.2.12.5. Financials (Based on Availability)
- 11.2.13 National Indemnity
- 11.2.13.1. Overview
- 11.2.13.2. Products
- 11.2.13.3. SWOT Analysis
- 11.2.13.4. Recent Developments
- 11.2.13.5. Financials (Based on Availability)
- 11.2.14 KASE Insurance Toronto
- 11.2.14.1. Overview
- 11.2.14.2. Products
- 11.2.14.3. SWOT Analysis
- 11.2.14.4. Recent Developments
- 11.2.14.5. Financials (Based on Availability)
- 11.2.15 First Chicago Insurance
- 11.2.15.1. Overview
- 11.2.15.2. Products
- 11.2.15.3. SWOT Analysis
- 11.2.15.4. Recent Developments
- 11.2.15.5. Financials (Based on Availability)
- 11.2.1 RLI Corp
List of Figures
- Figure 1: Global Public Transport Accident Insurance Revenue Breakdown (billion, %) by Region 2025 & 2033
- Figure 2: North America Public Transport Accident Insurance Revenue (billion), by Application 2025 & 2033
- Figure 3: North America Public Transport Accident Insurance Revenue Share (%), by Application 2025 & 2033
- Figure 4: North America Public Transport Accident Insurance Revenue (billion), by Types 2025 & 2033
- Figure 5: North America Public Transport Accident Insurance Revenue Share (%), by Types 2025 & 2033
- Figure 6: North America Public Transport Accident Insurance Revenue (billion), by Country 2025 & 2033
- Figure 7: North America Public Transport Accident Insurance Revenue Share (%), by Country 2025 & 2033
- Figure 8: South America Public Transport Accident Insurance Revenue (billion), by Application 2025 & 2033
- Figure 9: South America Public Transport Accident Insurance Revenue Share (%), by Application 2025 & 2033
- Figure 10: South America Public Transport Accident Insurance Revenue (billion), by Types 2025 & 2033
- Figure 11: South America Public Transport Accident Insurance Revenue Share (%), by Types 2025 & 2033
- Figure 12: South America Public Transport Accident Insurance Revenue (billion), by Country 2025 & 2033
- Figure 13: South America Public Transport Accident Insurance Revenue Share (%), by Country 2025 & 2033
- Figure 14: Europe Public Transport Accident Insurance Revenue (billion), by Application 2025 & 2033
- Figure 15: Europe Public Transport Accident Insurance Revenue Share (%), by Application 2025 & 2033
- Figure 16: Europe Public Transport Accident Insurance Revenue (billion), by Types 2025 & 2033
- Figure 17: Europe Public Transport Accident Insurance Revenue Share (%), by Types 2025 & 2033
- Figure 18: Europe Public Transport Accident Insurance Revenue (billion), by Country 2025 & 2033
- Figure 19: Europe Public Transport Accident Insurance Revenue Share (%), by Country 2025 & 2033
- Figure 20: Middle East & Africa Public Transport Accident Insurance Revenue (billion), by Application 2025 & 2033
- Figure 21: Middle East & Africa Public Transport Accident Insurance Revenue Share (%), by Application 2025 & 2033
- Figure 22: Middle East & Africa Public Transport Accident Insurance Revenue (billion), by Types 2025 & 2033
- Figure 23: Middle East & Africa Public Transport Accident Insurance Revenue Share (%), by Types 2025 & 2033
- Figure 24: Middle East & Africa Public Transport Accident Insurance Revenue (billion), by Country 2025 & 2033
- Figure 25: Middle East & Africa Public Transport Accident Insurance Revenue Share (%), by Country 2025 & 2033
- Figure 26: Asia Pacific Public Transport Accident Insurance Revenue (billion), by Application 2025 & 2033
- Figure 27: Asia Pacific Public Transport Accident Insurance Revenue Share (%), by Application 2025 & 2033
- Figure 28: Asia Pacific Public Transport Accident Insurance Revenue (billion), by Types 2025 & 2033
- Figure 29: Asia Pacific Public Transport Accident Insurance Revenue Share (%), by Types 2025 & 2033
- Figure 30: Asia Pacific Public Transport Accident Insurance Revenue (billion), by Country 2025 & 2033
- Figure 31: Asia Pacific Public Transport Accident Insurance Revenue Share (%), by Country 2025 & 2033
List of Tables
- Table 1: Global Public Transport Accident Insurance Revenue billion Forecast, by Application 2020 & 2033
- Table 2: Global Public Transport Accident Insurance Revenue billion Forecast, by Types 2020 & 2033
- Table 3: Global Public Transport Accident Insurance Revenue billion Forecast, by Region 2020 & 2033
- Table 4: Global Public Transport Accident Insurance Revenue billion Forecast, by Application 2020 & 2033
- Table 5: Global Public Transport Accident Insurance Revenue billion Forecast, by Types 2020 & 2033
- Table 6: Global Public Transport Accident Insurance Revenue billion Forecast, by Country 2020 & 2033
- Table 7: United States Public Transport Accident Insurance Revenue (billion) Forecast, by Application 2020 & 2033
- Table 8: Canada Public Transport Accident Insurance Revenue (billion) Forecast, by Application 2020 & 2033
- Table 9: Mexico Public Transport Accident Insurance Revenue (billion) Forecast, by Application 2020 & 2033
- Table 10: Global Public Transport Accident Insurance Revenue billion Forecast, by Application 2020 & 2033
- Table 11: Global Public Transport Accident Insurance Revenue billion Forecast, by Types 2020 & 2033
- Table 12: Global Public Transport Accident Insurance Revenue billion Forecast, by Country 2020 & 2033
- Table 13: Brazil Public Transport Accident Insurance Revenue (billion) Forecast, by Application 2020 & 2033
- Table 14: Argentina Public Transport Accident Insurance Revenue (billion) Forecast, by Application 2020 & 2033
- Table 15: Rest of South America Public Transport Accident Insurance Revenue (billion) Forecast, by Application 2020 & 2033
- Table 16: Global Public Transport Accident Insurance Revenue billion Forecast, by Application 2020 & 2033
- Table 17: Global Public Transport Accident Insurance Revenue billion Forecast, by Types 2020 & 2033
- Table 18: Global Public Transport Accident Insurance Revenue billion Forecast, by Country 2020 & 2033
- Table 19: United Kingdom Public Transport Accident Insurance Revenue (billion) Forecast, by Application 2020 & 2033
- Table 20: Germany Public Transport Accident Insurance Revenue (billion) Forecast, by Application 2020 & 2033
- Table 21: France Public Transport Accident Insurance Revenue (billion) Forecast, by Application 2020 & 2033
- Table 22: Italy Public Transport Accident Insurance Revenue (billion) Forecast, by Application 2020 & 2033
- Table 23: Spain Public Transport Accident Insurance Revenue (billion) Forecast, by Application 2020 & 2033
- Table 24: Russia Public Transport Accident Insurance Revenue (billion) Forecast, by Application 2020 & 2033
- Table 25: Benelux Public Transport Accident Insurance Revenue (billion) Forecast, by Application 2020 & 2033
- Table 26: Nordics Public Transport Accident Insurance Revenue (billion) Forecast, by Application 2020 & 2033
- Table 27: Rest of Europe Public Transport Accident Insurance Revenue (billion) Forecast, by Application 2020 & 2033
- Table 28: Global Public Transport Accident Insurance Revenue billion Forecast, by Application 2020 & 2033
- Table 29: Global Public Transport Accident Insurance Revenue billion Forecast, by Types 2020 & 2033
- Table 30: Global Public Transport Accident Insurance Revenue billion Forecast, by Country 2020 & 2033
- Table 31: Turkey Public Transport Accident Insurance Revenue (billion) Forecast, by Application 2020 & 2033
- Table 32: Israel Public Transport Accident Insurance Revenue (billion) Forecast, by Application 2020 & 2033
- Table 33: GCC Public Transport Accident Insurance Revenue (billion) Forecast, by Application 2020 & 2033
- Table 34: North Africa Public Transport Accident Insurance Revenue (billion) Forecast, by Application 2020 & 2033
- Table 35: South Africa Public Transport Accident Insurance Revenue (billion) Forecast, by Application 2020 & 2033
- Table 36: Rest of Middle East & Africa Public Transport Accident Insurance Revenue (billion) Forecast, by Application 2020 & 2033
- Table 37: Global Public Transport Accident Insurance Revenue billion Forecast, by Application 2020 & 2033
- Table 38: Global Public Transport Accident Insurance Revenue billion Forecast, by Types 2020 & 2033
- Table 39: Global Public Transport Accident Insurance Revenue billion Forecast, by Country 2020 & 2033
- Table 40: China Public Transport Accident Insurance Revenue (billion) Forecast, by Application 2020 & 2033
- Table 41: India Public Transport Accident Insurance Revenue (billion) Forecast, by Application 2020 & 2033
- Table 42: Japan Public Transport Accident Insurance Revenue (billion) Forecast, by Application 2020 & 2033
- Table 43: South Korea Public Transport Accident Insurance Revenue (billion) Forecast, by Application 2020 & 2033
- Table 44: ASEAN Public Transport Accident Insurance Revenue (billion) Forecast, by Application 2020 & 2033
- Table 45: Oceania Public Transport Accident Insurance Revenue (billion) Forecast, by Application 2020 & 2033
- Table 46: Rest of Asia Pacific Public Transport Accident Insurance Revenue (billion) Forecast, by Application 2020 & 2033
Frequently Asked Questions
1. What is the projected Compound Annual Growth Rate (CAGR) of the Public Transport Accident Insurance?
The projected CAGR is approximately 6.57%.
2. Which companies are prominent players in the Public Transport Accident Insurance?
Key companies in the market include RLI Corp, JMG Insurance Corp, Travelers Insurance, Leavitt Group Enterprises, Argoins, Gallagher US, Great American Insurance Group, National Interstate Insurance, Amwins, Twin City Group, Northbridge Insurance, Lancer Insurance, National Indemnity, KASE Insurance Toronto, First Chicago Insurance.
3. What are the main segments of the Public Transport Accident Insurance?
The market segments include Application, Types.
4. Can you provide details about the market size?
The market size is estimated to be USD 90.01 billion as of 2022.
5. What are some drivers contributing to market growth?
N/A
6. What are the notable trends driving market growth?
N/A
7. Are there any restraints impacting market growth?
N/A
8. Can you provide examples of recent developments in the market?
N/A
9. What pricing options are available for accessing the report?
Pricing options include single-user, multi-user, and enterprise licenses priced at USD 4350.00, USD 6525.00, and USD 8700.00 respectively.
10. Is the market size provided in terms of value or volume?
The market size is provided in terms of value, measured in billion.
11. Are there any specific market keywords associated with the report?
Yes, the market keyword associated with the report is "Public Transport Accident Insurance," which aids in identifying and referencing the specific market segment covered.
12. How do I determine which pricing option suits my needs best?
The pricing options vary based on user requirements and access needs. Individual users may opt for single-user licenses, while businesses requiring broader access may choose multi-user or enterprise licenses for cost-effective access to the report.
13. Are there any additional resources or data provided in the Public Transport Accident Insurance report?
While the report offers comprehensive insights, it's advisable to review the specific contents or supplementary materials provided to ascertain if additional resources or data are available.
14. How can I stay updated on further developments or reports in the Public Transport Accident Insurance?
To stay informed about further developments, trends, and reports in the Public Transport Accident Insurance, consider subscribing to industry newsletters, following relevant companies and organizations, or regularly checking reputable industry news sources and publications.
Methodology
Step 1 - Identification of Relevant Samples Size from Population Database


Step 2 - Approaches for Defining Global Market Size (Value, Volume* & Price*)

Note*: In applicable scenarios
Step 3 - Data Sources
Primary Research
- Web Analytics
- Survey Reports
- Research Institute
- Latest Research Reports
- Opinion Leaders
Secondary Research
- Annual Reports
- White Paper
- Latest Press Release
- Industry Association
- Paid Database
- Investor Presentations

Step 4 - Data Triangulation
Involves using different sources of information in order to increase the validity of a study
These sources are likely to be stakeholders in a program - participants, other researchers, program staff, other community members, and so on.
Then we put all data in single framework & apply various statistical tools to find out the dynamic on the market.
During the analysis stage, feedback from the stakeholder groups would be compared to determine areas of agreement as well as areas of divergence