

Key Insights
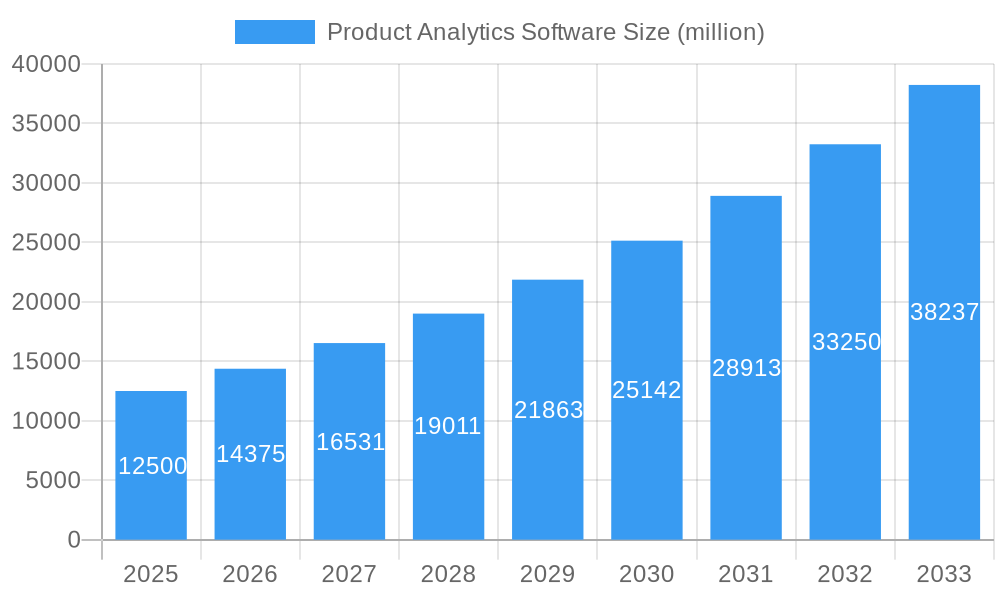
The Product Analytics Software market is poised for significant expansion, projected to reach an estimated market size of $12,500 million by 2025 and grow at a robust Compound Annual Growth Rate (CAGR) of 15% through 2033. This substantial growth is fueled by an increasing imperative for businesses to understand user behavior, optimize product development, and drive customer retention in an increasingly competitive digital landscape. Large enterprises, in particular, are investing heavily in sophisticated product analytics solutions to gain deeper insights into complex user journeys and to personalize experiences at scale. Simultaneously, Small and Medium-sized Enterprises (SMEs) are recognizing the democratization of these tools, with cloud-based and web-based solutions becoming more accessible and affordable, enabling them to compete more effectively by making data-driven product decisions. The shift towards actionable insights derived from user data is a primary driver, empowering product managers and marketing teams to refine features, identify pain points, and enhance overall user satisfaction.
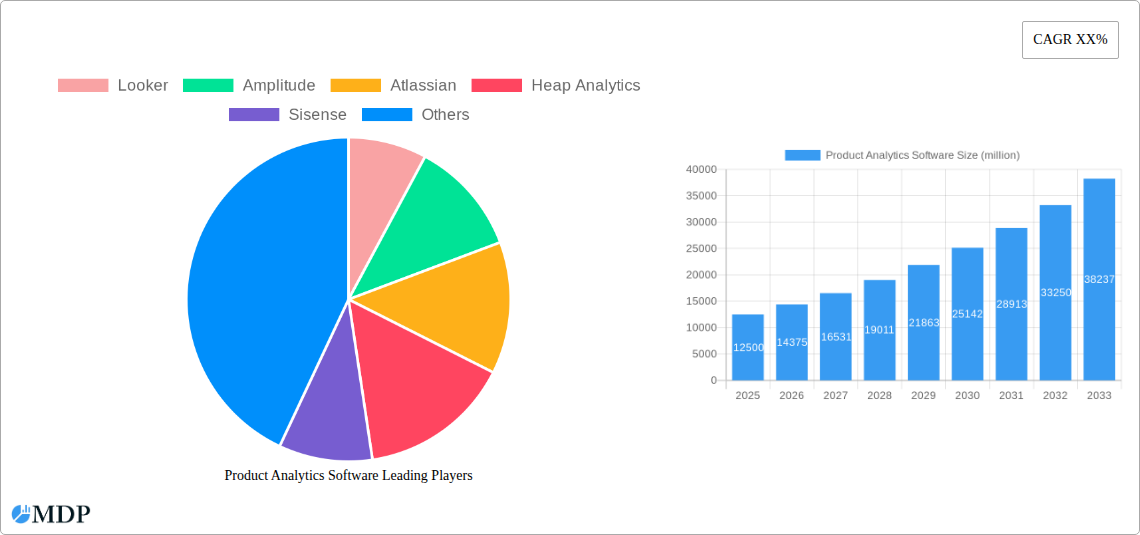
Product Analytics Software Market Size (In Billion)
Key trends shaping the product analytics software market include the growing adoption of AI and machine learning for predictive analytics, enabling businesses to anticipate user needs and churn before they occur. The demand for real-time data processing and visualization is also escalating, allowing for immediate response to market shifts and user feedback. Furthermore, there is a discernible trend towards integrated platforms that offer a holistic view of the customer lifecycle, combining product analytics with other customer data sources like CRM and marketing automation. While the market is characterized by strong growth, potential restraints include data privacy concerns and the complexity of integrating new analytics tools with existing legacy systems. However, the increasing availability of user-friendly interfaces and dedicated support services from leading vendors like Looker, Amplitude, and Mixpanel is mitigating these challenges, paving the way for continued innovation and market penetration across all business segments.
Product Analytics Software Company Market Share
This in-depth report offers a definitive analysis of the global Product Analytics Software market, projecting robust growth driven by escalating demand for data-driven decision-making across enterprises. Covering a study period from 2019 to 2033, with a base and estimated year of 2025, this comprehensive report delves into market dynamics, key trends, leading segments, and future opportunities. We analyze critical market forces, including the rise of SaaS product analytics, customer journey mapping software, and user behavior analytics, essential for businesses aiming to optimize product engagement and retention. This report is an indispensable resource for product managers, data analysts, marketing leaders, and investors seeking to understand the competitive landscape and capitalize on emerging trends in the product analytics platform space.
Product Analytics Software Market Dynamics & Concentration
The Product Analytics Software market exhibits a dynamic landscape characterized by increasing innovation and a moderate to high concentration, driven by the escalating need for actionable insights into user behavior. Leading players such as Looker, Amplitude, Atlassian, Heap Analytics, Sisense, Woopra, Pendo, Mixpanel, Glassbox, LogRocket, Contentsquare, FullStory, Gainsight PX, Whatfix, and PostHog are actively shaping the market. Innovation drivers include advancements in AI and machine learning for predictive analytics, real-time data processing capabilities, and enhanced user segmentation tools. Regulatory frameworks, particularly concerning data privacy (e.g., GDPR, CCPA), are increasingly influencing product development and data handling practices, demanding robust compliance features. Product substitutes, while present in the form of broader business intelligence tools, are increasingly being differentiated by specialized product analytics functionalities. End-user trends strongly favor cloud-based solutions due to their scalability, flexibility, and cost-effectiveness. Merger and acquisition (M&A) activities are a significant feature, with an estimated 35 M&A deals recorded in the historical period. Key players are strategically acquiring smaller, innovative companies to expand their feature sets and market reach, further consolidating the market. Market share is progressively tilting towards platforms offering comprehensive capabilities in user journey analysis, A/B testing integration, and feature adoption tracking.
Product Analytics Software Industry Trends & Analysis
The global Product Analytics Software market is poised for significant expansion, with an estimated Compound Annual Growth Rate (CAGR) of 18.5% projected over the forecast period. This growth is fueled by the pervasive shift towards data-driven strategies across all business functions. The increasing adoption of cloud-based solutions continues to be a dominant trend, offering unparalleled scalability and accessibility for businesses of all sizes. Web-based analytics remains a cornerstone, but the rise of mobile app analytics and the integration of in-app analytics are crucial for understanding multifaceted user journeys. Technological disruptions are at the forefront, with the integration of Artificial Intelligence (AI) and Machine Learning (ML) transforming raw data into predictive insights and intelligent recommendations. This enables companies to proactively identify user pain points, optimize feature adoption, and personalize user experiences. Consumer preferences are increasingly dictating product development, with a demand for intuitive interfaces, seamless integration with existing tech stacks, and robust data visualization capabilities. The competitive dynamics are intensifying, pushing vendors to differentiate through specialized features such as cohort analysis, funnel optimization, and session replays. Market penetration is expected to surge, particularly within SMEs, as accessible and affordable product analytics tools become more prevalent. The growing emphasis on customer retention and lifetime value maximization is a primary market growth driver, compelling businesses to invest in understanding their user base at a deeper level. The demand for real-time analytics is also rising, enabling immediate response to user behavior shifts and performance anomalies.
Leading Markets & Segments in Product Analytics Software
The Large Enterprises segment is currently the dominant force within the Product Analytics Software market, accounting for an estimated 62% of the total market share in the base year. This dominance is attributed to their substantial data volumes, complex operational needs, and the significant return on investment they realize from sophisticated analytical insights. The economic policies in developed regions, such as North America and Europe, which emphasize innovation and digital transformation, further bolster the adoption of advanced analytics solutions by large enterprises. Infrastructure development, including robust cloud computing capabilities and widespread internet penetration, also supports the seamless deployment and utilization of these platforms.
The Cloud Based type segment is the prevailing choice, capturing an estimated 78% of the market. This preference is driven by the inherent advantages of cloud solutions:
- Scalability: Ability to handle massive datasets and growing user bases without significant upfront infrastructure investment.
- Cost-Effectiveness: Pay-as-you-go models reduce capital expenditure and offer predictable operational costs.
- Accessibility: Remote access and collaborative features facilitate efficient teamwork across distributed organizations.
- Automatic Updates: Vendors manage software updates and maintenance, allowing enterprises to focus on core business functions.
While SMEs represent a smaller but rapidly growing segment, their adoption is being accelerated by the increasing availability of feature-rich yet affordable product analytics software for small businesses. The Web Based segment, though substantial, is increasingly being complemented and sometimes superseded by hybrid cloud solutions that offer greater flexibility and integration capabilities. Key drivers for dominance in these segments include:
- Data Volume and Complexity: Large enterprises generate vast amounts of user data, necessitating powerful analytics tools.
- Competitive Pressures: The need to stay ahead in competitive markets drives investment in understanding customer behavior.
- Digital Transformation Initiatives: Widespread digital transformation efforts necessitate robust data analysis capabilities.
- Focus on User Experience: Companies across all sizes are prioritizing exceptional user experiences to drive engagement and loyalty.
Product Analytics Software Product Developments
The Product Analytics Software sector is witnessing a rapid evolution characterized by sophisticated product innovations. Key developments include the integration of AI-powered predictive analytics for user churn, the expansion of visual analytics tools for intuitive data exploration, and enhanced capabilities for real-time event tracking and segmentation. Product offerings are increasingly focusing on actionable insights rather than raw data, enabling product teams to directly inform development sprints and marketing campaigns. Competitive advantages are being carved out through seamless integration with CRM, marketing automation, and development tools, creating a unified view of the customer. The emphasis is on providing end-to-end solutions, from data collection to actionable recommendations, thereby enhancing market fit for businesses seeking to optimize their digital products and user engagement strategies.
Key Drivers of Product Analytics Software Growth
The growth of the Product Analytics Software market is propelled by several key factors. Technologically, the burgeoning advancements in AI and machine learning are enabling more sophisticated predictive analytics, anomaly detection, and personalized user experiences. Economically, the global drive towards digital transformation across industries, coupled with the increasing recognition of data as a critical business asset, fuels demand. Regulatory shifts, such as enhanced data privacy laws, paradoxically drive adoption by necessitating better tools for understanding and managing user consent and behavior. Furthermore, the growing emphasis on customer retention and lifetime value maximization compels businesses to invest in tools that provide deep user insights, making user behavior analytics software and product engagement platforms indispensable.
Challenges in the Product Analytics Software Market
Despite robust growth, the Product Analytics Software market faces several challenges. Regulatory hurdles, particularly concerning data privacy and compliance, can be complex and costly to navigate. The increasing number of sophisticated solutions can lead to market saturation and intense competitive pressures, making it difficult for smaller players to gain traction. Furthermore, the integration of new analytics tools with existing legacy systems can be a significant technical challenge for many organizations, potentially leading to implementation delays and increased costs. Supply chain issues, though less direct for software, can impact hardware dependencies for on-premise solutions or partner integrations. The sheer volume of data also presents a challenge, requiring robust infrastructure and sophisticated processing capabilities.
Emerging Opportunities in Product Analytics Software
Emerging opportunities in the Product Analytics Software market are primarily driven by technological breakthroughs and evolving business strategies. The continued maturation of AI and ML algorithms offers opportunities for hyper-personalization of user experiences and proactive issue resolution. Strategic partnerships between analytics vendors and other MarTech or FinTech companies are creating integrated ecosystems that offer more comprehensive solutions. Market expansion into emerging economies and the development of tailored solutions for niche industries, such as healthcare or gaming, represent significant growth avenues. The increasing demand for low-code/no-code analytics platforms also presents an opportunity to democratize data analysis for a wider range of users within organizations.
Leading Players in the Product Analytics Software Sector
The leading players in the Product Analytics Software sector include: Looker Amplitude Atlassian Heap Analytics Sisense Woopra Pendo Mixpanel Glassbox LogRocket Contentsquare FullStory Gainsight PX Whatfix PostHog
Key Milestones in Product Analytics Software Industry
2019: Increased adoption of AI/ML for predictive analytics. 2020: Surge in demand for remote analytics solutions due to global events. 2021: Greater emphasis on privacy-centric analytics and compliance features. 2022: Expansion of no-code/low-code analytics platforms for broader accessibility. 2023: Significant M&A activity with several key acquisitions by larger players. 2024: Maturation of cross-platform analytics, integrating web, mobile, and in-app data. 2025: Continued integration of real-time analytics and actionable insights generation. 2026: Expected emergence of more sophisticated AI-driven user journey optimization tools. 2027: Growing demand for specialized analytics for emerging technologies like AR/VR. 2028: Consolidation and specialized offerings in the enterprise segment. 2029: Increased focus on ethical AI in analytics and user data interpretation. 2030: Widespread adoption of predictive customer lifecycle management. 2031: Development of more robust solutions for edge analytics. 2032: Integration of advanced natural language processing for analytics queries. 2033: Potential for fully autonomous product optimization driven by AI analytics.
Strategic Outlook for Product Analytics Software Market
The strategic outlook for the Product Analytics Software market is exceptionally positive, driven by sustained digital transformation and the imperative for data-driven decision-making. Growth accelerators include the ongoing innovation in AI and ML, enabling more intelligent and predictive analytics capabilities that directly impact product strategy and user experience. The increasing demand for personalized customer journeys and enhanced product engagement will continue to fuel investment in advanced analytics platforms. Strategic opportunities lie in expanding into underserved market segments, developing specialized solutions for emerging technologies, and fostering strategic partnerships to create comprehensive data ecosystems. The focus will remain on providing actionable insights, simplifying data analysis, and ensuring seamless integration with existing business workflows, solidifying the market's trajectory for significant long-term growth.
Product Analytics Software Segmentation
-
1. Application
- 1.1. Large Enterprises
- 1.2. SMEs
-
2. Types
- 2.1. Cloud Based
- 2.2. Web Based
Product Analytics Software Segmentation By Geography
-
1. North America
- 1.1. United States
- 1.2. Canada
- 1.3. Mexico
-
2. South America
- 2.1. Brazil
- 2.2. Argentina
- 2.3. Rest of South America
-
3. Europe
- 3.1. United Kingdom
- 3.2. Germany
- 3.3. France
- 3.4. Italy
- 3.5. Spain
- 3.6. Russia
- 3.7. Benelux
- 3.8. Nordics
- 3.9. Rest of Europe
-
4. Middle East & Africa
- 4.1. Turkey
- 4.2. Israel
- 4.3. GCC
- 4.4. North Africa
- 4.5. South Africa
- 4.6. Rest of Middle East & Africa
-
5. Asia Pacific
- 5.1. China
- 5.2. India
- 5.3. Japan
- 5.4. South Korea
- 5.5. ASEAN
- 5.6. Oceania
- 5.7. Rest of Asia Pacific
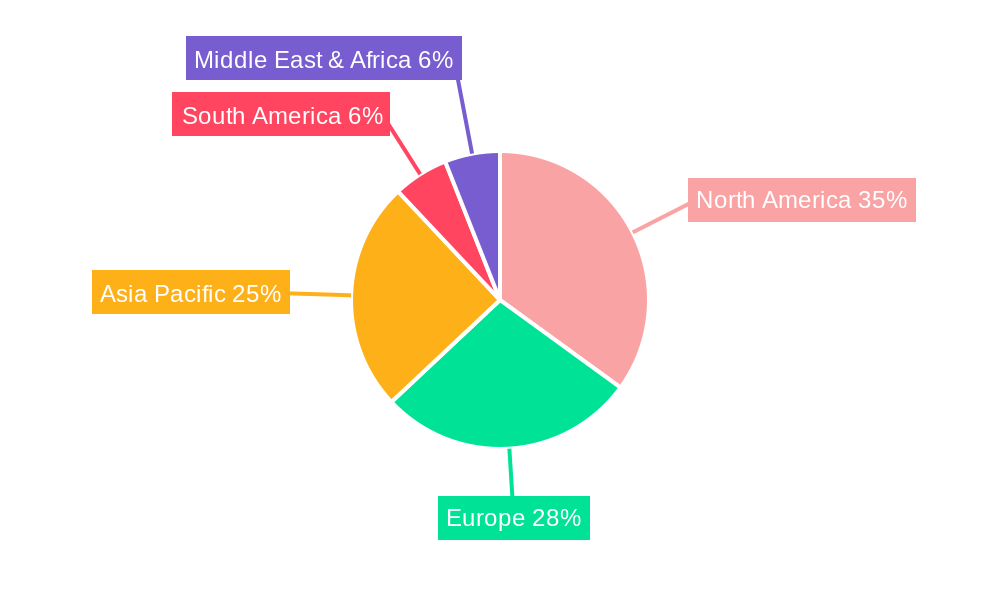
Product Analytics Software Regional Market Share
Geographic Coverage of Product Analytics Software
Product Analytics Software REPORT HIGHLIGHTS
| Aspects | Details |
|---|---|
| Study Period | 2020-2034 |
| Base Year | 2025 |
| Estimated Year | 2026 |
| Forecast Period | 2026-2034 |
| Historical Period | 2020-2025 |
| Growth Rate | CAGR of XX% from 2020-2034 |
| Segmentation |
|
Table of Contents
- 1. Introduction
- 1.1. Research Scope
- 1.2. Market Segmentation
- 1.3. Research Methodology
- 1.4. Definitions and Assumptions
- 2. Executive Summary
- 2.1. Introduction
- 3. Market Dynamics
- 3.1. Introduction
- 3.2. Market Drivers
- 3.3. Market Restrains
- 3.4. Market Trends
- 4. Market Factor Analysis
- 4.1. Porters Five Forces
- 4.2. Supply/Value Chain
- 4.3. PESTEL analysis
- 4.4. Market Entropy
- 4.5. Patent/Trademark Analysis
- 5. Global Product Analytics Software Analysis, Insights and Forecast, 2020-2032
- 5.1. Market Analysis, Insights and Forecast - by Application
- 5.1.1. Large Enterprises
- 5.1.2. SMEs
- 5.2. Market Analysis, Insights and Forecast - by Types
- 5.2.1. Cloud Based
- 5.2.2. Web Based
- 5.3. Market Analysis, Insights and Forecast - by Region
- 5.3.1. North America
- 5.3.2. South America
- 5.3.3. Europe
- 5.3.4. Middle East & Africa
- 5.3.5. Asia Pacific
- 5.1. Market Analysis, Insights and Forecast - by Application
- 6. North America Product Analytics Software Analysis, Insights and Forecast, 2020-2032
- 6.1. Market Analysis, Insights and Forecast - by Application
- 6.1.1. Large Enterprises
- 6.1.2. SMEs
- 6.2. Market Analysis, Insights and Forecast - by Types
- 6.2.1. Cloud Based
- 6.2.2. Web Based
- 6.1. Market Analysis, Insights and Forecast - by Application
- 7. South America Product Analytics Software Analysis, Insights and Forecast, 2020-2032
- 7.1. Market Analysis, Insights and Forecast - by Application
- 7.1.1. Large Enterprises
- 7.1.2. SMEs
- 7.2. Market Analysis, Insights and Forecast - by Types
- 7.2.1. Cloud Based
- 7.2.2. Web Based
- 7.1. Market Analysis, Insights and Forecast - by Application
- 8. Europe Product Analytics Software Analysis, Insights and Forecast, 2020-2032
- 8.1. Market Analysis, Insights and Forecast - by Application
- 8.1.1. Large Enterprises
- 8.1.2. SMEs
- 8.2. Market Analysis, Insights and Forecast - by Types
- 8.2.1. Cloud Based
- 8.2.2. Web Based
- 8.1. Market Analysis, Insights and Forecast - by Application
- 9. Middle East & Africa Product Analytics Software Analysis, Insights and Forecast, 2020-2032
- 9.1. Market Analysis, Insights and Forecast - by Application
- 9.1.1. Large Enterprises
- 9.1.2. SMEs
- 9.2. Market Analysis, Insights and Forecast - by Types
- 9.2.1. Cloud Based
- 9.2.2. Web Based
- 9.1. Market Analysis, Insights and Forecast - by Application
- 10. Asia Pacific Product Analytics Software Analysis, Insights and Forecast, 2020-2032
- 10.1. Market Analysis, Insights and Forecast - by Application
- 10.1.1. Large Enterprises
- 10.1.2. SMEs
- 10.2. Market Analysis, Insights and Forecast - by Types
- 10.2.1. Cloud Based
- 10.2.2. Web Based
- 10.1. Market Analysis, Insights and Forecast - by Application
- 11. Competitive Analysis
- 11.1. Global Market Share Analysis 2025
- 11.2. Company Profiles
- 11.2.1 Looker
- 11.2.1.1. Overview
- 11.2.1.2. Products
- 11.2.1.3. SWOT Analysis
- 11.2.1.4. Recent Developments
- 11.2.1.5. Financials (Based on Availability)
- 11.2.2 Amplitude
- 11.2.2.1. Overview
- 11.2.2.2. Products
- 11.2.2.3. SWOT Analysis
- 11.2.2.4. Recent Developments
- 11.2.2.5. Financials (Based on Availability)
- 11.2.3 Atlassian
- 11.2.3.1. Overview
- 11.2.3.2. Products
- 11.2.3.3. SWOT Analysis
- 11.2.3.4. Recent Developments
- 11.2.3.5. Financials (Based on Availability)
- 11.2.4 Heap Analytics
- 11.2.4.1. Overview
- 11.2.4.2. Products
- 11.2.4.3. SWOT Analysis
- 11.2.4.4. Recent Developments
- 11.2.4.5. Financials (Based on Availability)
- 11.2.5 Sisense
- 11.2.5.1. Overview
- 11.2.5.2. Products
- 11.2.5.3. SWOT Analysis
- 11.2.5.4. Recent Developments
- 11.2.5.5. Financials (Based on Availability)
- 11.2.6 Woopra
- 11.2.6.1. Overview
- 11.2.6.2. Products
- 11.2.6.3. SWOT Analysis
- 11.2.6.4. Recent Developments
- 11.2.6.5. Financials (Based on Availability)
- 11.2.7 Pendo
- 11.2.7.1. Overview
- 11.2.7.2. Products
- 11.2.7.3. SWOT Analysis
- 11.2.7.4. Recent Developments
- 11.2.7.5. Financials (Based on Availability)
- 11.2.8 Mixpanel
- 11.2.8.1. Overview
- 11.2.8.2. Products
- 11.2.8.3. SWOT Analysis
- 11.2.8.4. Recent Developments
- 11.2.8.5. Financials (Based on Availability)
- 11.2.9 Glassbox
- 11.2.9.1. Overview
- 11.2.9.2. Products
- 11.2.9.3. SWOT Analysis
- 11.2.9.4. Recent Developments
- 11.2.9.5. Financials (Based on Availability)
- 11.2.10 LogRocket
- 11.2.10.1. Overview
- 11.2.10.2. Products
- 11.2.10.3. SWOT Analysis
- 11.2.10.4. Recent Developments
- 11.2.10.5. Financials (Based on Availability)
- 11.2.11 Contentsquare
- 11.2.11.1. Overview
- 11.2.11.2. Products
- 11.2.11.3. SWOT Analysis
- 11.2.11.4. Recent Developments
- 11.2.11.5. Financials (Based on Availability)
- 11.2.12 FullStory
- 11.2.12.1. Overview
- 11.2.12.2. Products
- 11.2.12.3. SWOT Analysis
- 11.2.12.4. Recent Developments
- 11.2.12.5. Financials (Based on Availability)
- 11.2.13 Gainsight PX
- 11.2.13.1. Overview
- 11.2.13.2. Products
- 11.2.13.3. SWOT Analysis
- 11.2.13.4. Recent Developments
- 11.2.13.5. Financials (Based on Availability)
- 11.2.14 Whatfix
- 11.2.14.1. Overview
- 11.2.14.2. Products
- 11.2.14.3. SWOT Analysis
- 11.2.14.4. Recent Developments
- 11.2.14.5. Financials (Based on Availability)
- 11.2.15 PostHog
- 11.2.15.1. Overview
- 11.2.15.2. Products
- 11.2.15.3. SWOT Analysis
- 11.2.15.4. Recent Developments
- 11.2.15.5. Financials (Based on Availability)
- 11.2.1 Looker
List of Figures
- Figure 1: Global Product Analytics Software Revenue Breakdown (million, %) by Region 2025 & 2033
- Figure 2: North America Product Analytics Software Revenue (million), by Application 2025 & 2033
- Figure 3: North America Product Analytics Software Revenue Share (%), by Application 2025 & 2033
- Figure 4: North America Product Analytics Software Revenue (million), by Types 2025 & 2033
- Figure 5: North America Product Analytics Software Revenue Share (%), by Types 2025 & 2033
- Figure 6: North America Product Analytics Software Revenue (million), by Country 2025 & 2033
- Figure 7: North America Product Analytics Software Revenue Share (%), by Country 2025 & 2033
- Figure 8: South America Product Analytics Software Revenue (million), by Application 2025 & 2033
- Figure 9: South America Product Analytics Software Revenue Share (%), by Application 2025 & 2033
- Figure 10: South America Product Analytics Software Revenue (million), by Types 2025 & 2033
- Figure 11: South America Product Analytics Software Revenue Share (%), by Types 2025 & 2033
- Figure 12: South America Product Analytics Software Revenue (million), by Country 2025 & 2033
- Figure 13: South America Product Analytics Software Revenue Share (%), by Country 2025 & 2033
- Figure 14: Europe Product Analytics Software Revenue (million), by Application 2025 & 2033
- Figure 15: Europe Product Analytics Software Revenue Share (%), by Application 2025 & 2033
- Figure 16: Europe Product Analytics Software Revenue (million), by Types 2025 & 2033
- Figure 17: Europe Product Analytics Software Revenue Share (%), by Types 2025 & 2033
- Figure 18: Europe Product Analytics Software Revenue (million), by Country 2025 & 2033
- Figure 19: Europe Product Analytics Software Revenue Share (%), by Country 2025 & 2033
- Figure 20: Middle East & Africa Product Analytics Software Revenue (million), by Application 2025 & 2033
- Figure 21: Middle East & Africa Product Analytics Software Revenue Share (%), by Application 2025 & 2033
- Figure 22: Middle East & Africa Product Analytics Software Revenue (million), by Types 2025 & 2033
- Figure 23: Middle East & Africa Product Analytics Software Revenue Share (%), by Types 2025 & 2033
- Figure 24: Middle East & Africa Product Analytics Software Revenue (million), by Country 2025 & 2033
- Figure 25: Middle East & Africa Product Analytics Software Revenue Share (%), by Country 2025 & 2033
- Figure 26: Asia Pacific Product Analytics Software Revenue (million), by Application 2025 & 2033
- Figure 27: Asia Pacific Product Analytics Software Revenue Share (%), by Application 2025 & 2033
- Figure 28: Asia Pacific Product Analytics Software Revenue (million), by Types 2025 & 2033
- Figure 29: Asia Pacific Product Analytics Software Revenue Share (%), by Types 2025 & 2033
- Figure 30: Asia Pacific Product Analytics Software Revenue (million), by Country 2025 & 2033
- Figure 31: Asia Pacific Product Analytics Software Revenue Share (%), by Country 2025 & 2033
List of Tables
- Table 1: Global Product Analytics Software Revenue million Forecast, by Application 2020 & 2033
- Table 2: Global Product Analytics Software Revenue million Forecast, by Types 2020 & 2033
- Table 3: Global Product Analytics Software Revenue million Forecast, by Region 2020 & 2033
- Table 4: Global Product Analytics Software Revenue million Forecast, by Application 2020 & 2033
- Table 5: Global Product Analytics Software Revenue million Forecast, by Types 2020 & 2033
- Table 6: Global Product Analytics Software Revenue million Forecast, by Country 2020 & 2033
- Table 7: United States Product Analytics Software Revenue (million) Forecast, by Application 2020 & 2033
- Table 8: Canada Product Analytics Software Revenue (million) Forecast, by Application 2020 & 2033
- Table 9: Mexico Product Analytics Software Revenue (million) Forecast, by Application 2020 & 2033
- Table 10: Global Product Analytics Software Revenue million Forecast, by Application 2020 & 2033
- Table 11: Global Product Analytics Software Revenue million Forecast, by Types 2020 & 2033
- Table 12: Global Product Analytics Software Revenue million Forecast, by Country 2020 & 2033
- Table 13: Brazil Product Analytics Software Revenue (million) Forecast, by Application 2020 & 2033
- Table 14: Argentina Product Analytics Software Revenue (million) Forecast, by Application 2020 & 2033
- Table 15: Rest of South America Product Analytics Software Revenue (million) Forecast, by Application 2020 & 2033
- Table 16: Global Product Analytics Software Revenue million Forecast, by Application 2020 & 2033
- Table 17: Global Product Analytics Software Revenue million Forecast, by Types 2020 & 2033
- Table 18: Global Product Analytics Software Revenue million Forecast, by Country 2020 & 2033
- Table 19: United Kingdom Product Analytics Software Revenue (million) Forecast, by Application 2020 & 2033
- Table 20: Germany Product Analytics Software Revenue (million) Forecast, by Application 2020 & 2033
- Table 21: France Product Analytics Software Revenue (million) Forecast, by Application 2020 & 2033
- Table 22: Italy Product Analytics Software Revenue (million) Forecast, by Application 2020 & 2033
- Table 23: Spain Product Analytics Software Revenue (million) Forecast, by Application 2020 & 2033
- Table 24: Russia Product Analytics Software Revenue (million) Forecast, by Application 2020 & 2033
- Table 25: Benelux Product Analytics Software Revenue (million) Forecast, by Application 2020 & 2033
- Table 26: Nordics Product Analytics Software Revenue (million) Forecast, by Application 2020 & 2033
- Table 27: Rest of Europe Product Analytics Software Revenue (million) Forecast, by Application 2020 & 2033
- Table 28: Global Product Analytics Software Revenue million Forecast, by Application 2020 & 2033
- Table 29: Global Product Analytics Software Revenue million Forecast, by Types 2020 & 2033
- Table 30: Global Product Analytics Software Revenue million Forecast, by Country 2020 & 2033
- Table 31: Turkey Product Analytics Software Revenue (million) Forecast, by Application 2020 & 2033
- Table 32: Israel Product Analytics Software Revenue (million) Forecast, by Application 2020 & 2033
- Table 33: GCC Product Analytics Software Revenue (million) Forecast, by Application 2020 & 2033
- Table 34: North Africa Product Analytics Software Revenue (million) Forecast, by Application 2020 & 2033
- Table 35: South Africa Product Analytics Software Revenue (million) Forecast, by Application 2020 & 2033
- Table 36: Rest of Middle East & Africa Product Analytics Software Revenue (million) Forecast, by Application 2020 & 2033
- Table 37: Global Product Analytics Software Revenue million Forecast, by Application 2020 & 2033
- Table 38: Global Product Analytics Software Revenue million Forecast, by Types 2020 & 2033
- Table 39: Global Product Analytics Software Revenue million Forecast, by Country 2020 & 2033
- Table 40: China Product Analytics Software Revenue (million) Forecast, by Application 2020 & 2033
- Table 41: India Product Analytics Software Revenue (million) Forecast, by Application 2020 & 2033
- Table 42: Japan Product Analytics Software Revenue (million) Forecast, by Application 2020 & 2033
- Table 43: South Korea Product Analytics Software Revenue (million) Forecast, by Application 2020 & 2033
- Table 44: ASEAN Product Analytics Software Revenue (million) Forecast, by Application 2020 & 2033
- Table 45: Oceania Product Analytics Software Revenue (million) Forecast, by Application 2020 & 2033
- Table 46: Rest of Asia Pacific Product Analytics Software Revenue (million) Forecast, by Application 2020 & 2033
Frequently Asked Questions
1. What is the projected Compound Annual Growth Rate (CAGR) of the Product Analytics Software?
The projected CAGR is approximately XX%.
2. Which companies are prominent players in the Product Analytics Software?
Key companies in the market include Looker, Amplitude, Atlassian, Heap Analytics, Sisense, Woopra, Pendo, Mixpanel, Glassbox, LogRocket, Contentsquare, FullStory, Gainsight PX, Whatfix, PostHog.
3. What are the main segments of the Product Analytics Software?
The market segments include Application, Types.
4. Can you provide details about the market size?
The market size is estimated to be USD XXX million as of 2022.
5. What are some drivers contributing to market growth?
N/A
6. What are the notable trends driving market growth?
N/A
7. Are there any restraints impacting market growth?
N/A
8. Can you provide examples of recent developments in the market?
N/A
9. What pricing options are available for accessing the report?
Pricing options include single-user, multi-user, and enterprise licenses priced at USD 3350.00, USD 5025.00, and USD 6700.00 respectively.
10. Is the market size provided in terms of value or volume?
The market size is provided in terms of value, measured in million.
11. Are there any specific market keywords associated with the report?
Yes, the market keyword associated with the report is "Product Analytics Software," which aids in identifying and referencing the specific market segment covered.
12. How do I determine which pricing option suits my needs best?
The pricing options vary based on user requirements and access needs. Individual users may opt for single-user licenses, while businesses requiring broader access may choose multi-user or enterprise licenses for cost-effective access to the report.
13. Are there any additional resources or data provided in the Product Analytics Software report?
While the report offers comprehensive insights, it's advisable to review the specific contents or supplementary materials provided to ascertain if additional resources or data are available.
14. How can I stay updated on further developments or reports in the Product Analytics Software?
To stay informed about further developments, trends, and reports in the Product Analytics Software, consider subscribing to industry newsletters, following relevant companies and organizations, or regularly checking reputable industry news sources and publications.
Methodology
Step 1 - Identification of Relevant Samples Size from Population Database


Step 2 - Approaches for Defining Global Market Size (Value, Volume* & Price*)

Note*: In applicable scenarios
Step 3 - Data Sources
Primary Research
- Web Analytics
- Survey Reports
- Research Institute
- Latest Research Reports
- Opinion Leaders
Secondary Research
- Annual Reports
- White Paper
- Latest Press Release
- Industry Association
- Paid Database
- Investor Presentations

Step 4 - Data Triangulation
Involves using different sources of information in order to increase the validity of a study
These sources are likely to be stakeholders in a program - participants, other researchers, program staff, other community members, and so on.
Then we put all data in single framework & apply various statistical tools to find out the dynamic on the market.
During the analysis stage, feedback from the stakeholder groups would be compared to determine areas of agreement as well as areas of divergence