

Key Insights
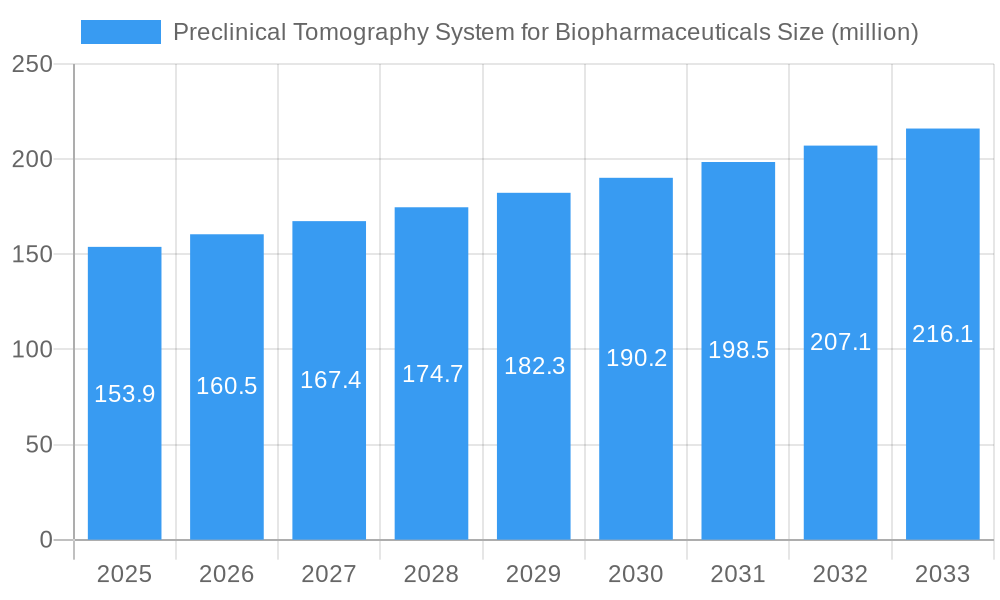
The preclinical tomography system market for biopharmaceuticals, valued at $153.9 million in 2025, is poised for robust growth, projected to expand at a compound annual growth rate (CAGR) of 4.3% from 2025 to 2033. This growth is fueled by several key factors. The increasing demand for advanced imaging technologies in drug discovery and development is a significant driver. Biopharmaceutical companies are increasingly adopting preclinical tomography systems to accelerate research and development timelines, optimize drug efficacy, and minimize development costs. Technological advancements leading to higher resolution imaging, improved sensitivity, and faster scan times are also contributing to market expansion. Furthermore, the rising prevalence of chronic diseases and the consequent need for novel therapeutic agents are further boosting market demand. Competition among key players like Bruker, MR Solutions, Scanco Medical, PerkinElmer, Trifoil Imaging, Mediso, Sedecal, and MILabs is driving innovation and fostering the adoption of more sophisticated systems.
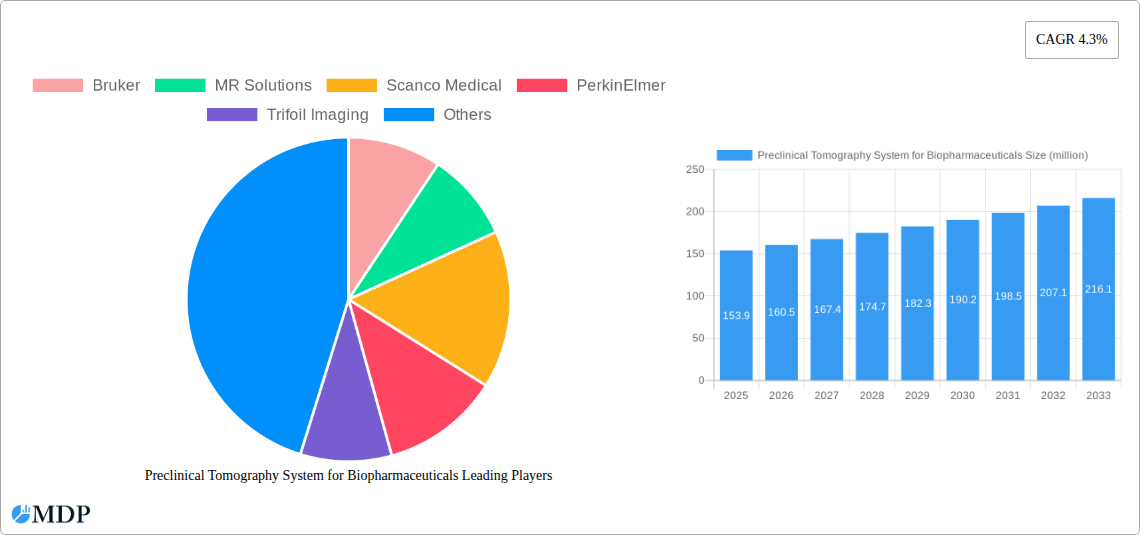
Preclinical Tomography System for Biopharmaceuticals Market Size (In Million)
However, the market faces certain challenges. High initial investment costs associated with acquiring and maintaining these sophisticated systems can be a barrier for smaller research organizations. The complex nature of the technology necessitates specialized training and expertise, which can also restrict market penetration. Nevertheless, the long-term benefits of faster drug development and enhanced research outcomes outweigh these limitations, ensuring sustained growth in the preclinical tomography system market for biopharmaceuticals throughout the forecast period. This market segment anticipates significant growth driven by the evolving needs of the biopharmaceutical industry and the continuous advancements in imaging technology.
Preclinical Tomography System for Biopharmaceuticals Company Market Share
Preclinical Tomography System for Biopharmaceuticals Market Report: 2019-2033
Unlocking Growth in the Multi-Million Dollar Preclinical Imaging Market: A Comprehensive Analysis
This comprehensive report provides an in-depth analysis of the Preclinical Tomography System for Biopharmaceuticals market, projecting a robust growth trajectory from 2019 to 2033. The report meticulously examines market dynamics, industry trends, leading players (including Bruker, MR Solutions, Scanco Medical, PerkinElmer, Trifoil Imaging, Mediso, Sedecal, and MILabs), and emerging opportunities within this vital sector of the biopharmaceutical industry. With a focus on actionable insights and data-driven predictions, this report is an essential resource for industry stakeholders, investors, and researchers. The report covers a market valued at over $XX million in 2025, with projections extending to 2033.
Preclinical Tomography System for Biopharmaceuticals Market Dynamics & Concentration
The preclinical tomography system market is characterized by a moderately concentrated landscape, with key players holding significant market share. Bruker, PerkinElmer, and MR Solutions currently command a substantial portion, estimated at approximately XX% combined in 2025. This concentration is driven by high barriers to entry, including significant R&D investment and regulatory compliance requirements. However, the market is witnessing increased innovation, particularly in areas like micro-CT and PET/SPECT systems, fostering competition.
Innovation Drivers:
- Advancements in detector technology
- Development of more sensitive and specific radiotracers
- Integration of AI and machine learning for image analysis
Regulatory Frameworks: Stringent regulatory approvals for medical devices impact market entry and growth.
Product Substitutes: While limited direct substitutes exist, alternative preclinical imaging techniques, such as MRI and ultrasound, pose indirect competition.
End-User Trends: Growing demand for personalized medicine and increased preclinical research are key growth drivers.
M&A Activities: The past five years (2019-2024) witnessed approximately XX M&A deals, reflecting industry consolidation and expansion strategies. The estimated CAGR from 2019 to 2024 for M&A activity is XX%.
Preclinical Tomography System for Biopharmaceuticals Industry Trends & Analysis
The preclinical tomography system market is experiencing significant growth, driven by a confluence of factors. The projected CAGR for the forecast period (2025-2033) is estimated at XX%. This expansion is fueled by several key trends:
- Increased demand for advanced preclinical imaging: Biopharmaceutical companies increasingly rely on sophisticated imaging techniques for drug discovery and development.
- Technological advancements: Continuous improvements in resolution, speed, and sensitivity of preclinical tomography systems are driving market expansion. Miniaturization of systems enabling in-vivo studies across diverse animal models also contributes significantly.
- Growing adoption of multimodal imaging: The integration of different imaging modalities (e.g., PET/CT, SPECT/CT) allows for more comprehensive analysis and provides a richer dataset for research.
- Rise of personalized medicine: This trend necessitates more precise and efficient preclinical testing, boosting the demand for advanced imaging solutions.
- Rising investments in research and development: Increased investments by both private and public entities into biopharmaceutical research directly translates into demand for state-of-the-art preclinical imaging equipment.
- Market penetration: The market penetration of preclinical tomography systems is expected to increase significantly, especially in emerging economies, with an estimated XX% increase from 2025 to 2033.
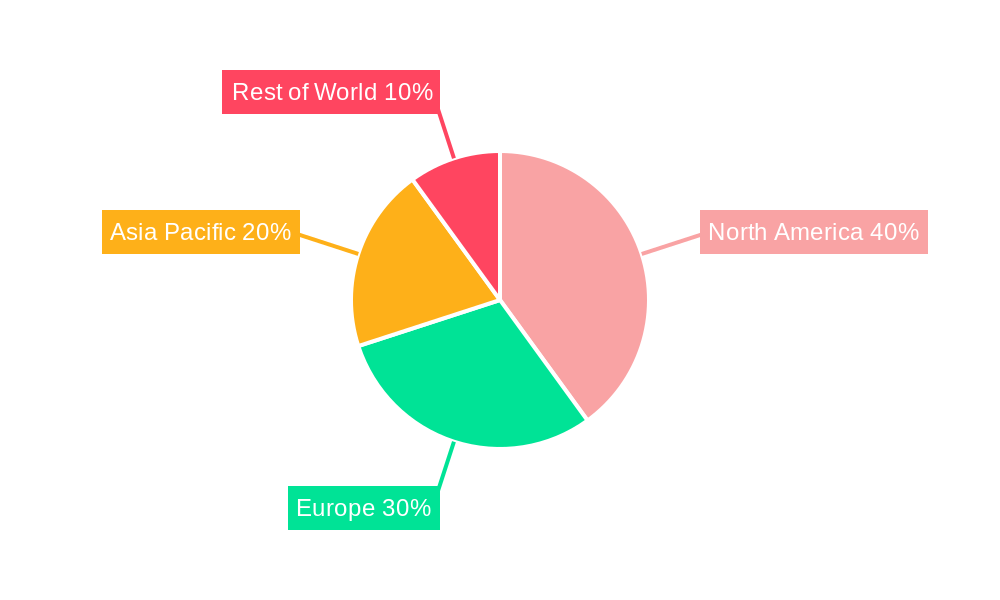
Leading Markets & Segments in Preclinical Tomography System for Biopharmaceuticals
North America currently holds the largest market share, driven by robust pharmaceutical R&D activities and high adoption rates of advanced technologies. Europe follows closely, exhibiting strong growth potential. Asia-Pacific is anticipated to witness the fastest growth due to increased investments in healthcare infrastructure and rising pharmaceutical research activities.
Key Drivers for North American Dominance:
- High concentration of biopharmaceutical companies
- Well-established regulatory frameworks
- Significant government funding for research
Europe:
- Strong presence of pharmaceutical research institutions
- Favorable regulatory environment
- Investments in advanced healthcare technologies
Asia-Pacific:
- Rapid economic growth and rising healthcare expenditure
- Government initiatives to improve healthcare infrastructure
- Growing number of pharmaceutical companies and research institutions
Preclinical Tomography System for Biopharmaceuticals Product Developments
Recent product developments have focused on enhancing image resolution, improving sensitivity, and integrating advanced analytical capabilities. For example, the introduction of systems with improved detectors and advanced reconstruction algorithms have led to improved visualization of small structures and reduced scan times. Moreover, the integration of artificial intelligence (AI) for automated image analysis accelerates research workflows. These developments are tailored to address the increasing need for efficient and high-throughput preclinical studies.
Key Drivers of Preclinical Tomography System for Biopharmaceuticals Growth
Several factors contribute to the market's growth trajectory. Technological advancements, such as improved detector technology and AI-powered image analysis, directly enhance system capabilities. Simultaneously, the increasing demand for personalized medicine is driving the adoption of advanced preclinical imaging solutions. Favorable regulatory environments and substantial investments in pharmaceutical R&D further fuel market expansion.
Challenges in the Preclinical Tomography System for Biopharmaceuticals Market
High initial investment costs for acquiring and maintaining systems present a barrier for smaller research institutions. Moreover, regulatory hurdles and the complexity of obtaining approvals for new systems can slow market penetration. Finally, intense competition among established players and the emergence of new entrants create competitive pressures. This necessitates consistent product innovation and differentiation strategies.
Emerging Opportunities in Preclinical Tomography System for Biopharmaceuticals
Significant opportunities exist for growth in the preclinical tomography system market. The integration of novel imaging modalities with existing technologies will enhance data analysis and interpretation. Strategic partnerships between instrument manufacturers and biopharmaceutical companies will drive innovation and accelerate the development of new therapeutics. Expansion into emerging markets with growing healthcare spending will unlock significant growth potential.
Leading Players in the Preclinical Tomography System for Biopharmaceuticals Sector
- Bruker
- MR Solutions
- Scanco Medical
- PerkinElmer
- Trifoil Imaging
- Mediso
- Sedecal
- MILabs
Key Milestones in Preclinical Tomography System for Biopharmaceuticals Industry
- 2020: Bruker launches a new micro-CT system with enhanced resolution.
- 2021: PerkinElmer acquires a smaller imaging company, expanding its product portfolio.
- 2022: MR Solutions introduces a new preclinical MRI system with improved sensitivity.
- 2023: Significant advancements in AI-powered image analysis software are introduced across multiple platforms.
- 2024: Mediso releases a novel combined PET/SPECT/CT system.
Strategic Outlook for Preclinical Tomography System for Biopharmaceuticals Market
The preclinical tomography system market is poised for sustained growth, driven by continuous technological innovation and the expanding needs of the biopharmaceutical industry. Strategic partnerships, focusing on developing integrated solutions, will be crucial for maintaining a competitive edge. Furthermore, expanding into emerging markets and focusing on providing comprehensive services, rather than just hardware, will prove critical to maximizing market share and long-term growth. The market anticipates a sustained XX% CAGR over the next eight years, reaching an estimated value of $XX million by 2033.
Preclinical Tomography System for Biopharmaceuticals Segmentation
-
1. Application
- 1.1. Hospital
- 1.2. Research Institute
- 1.3. Other
-
2. Types
- 2.1. CT
- 2.2. SPECT
- 2.3. Others
Preclinical Tomography System for Biopharmaceuticals Segmentation By Geography
-
1. North America
- 1.1. United States
- 1.2. Canada
- 1.3. Mexico
-
2. South America
- 2.1. Brazil
- 2.2. Argentina
- 2.3. Rest of South America
-
3. Europe
- 3.1. United Kingdom
- 3.2. Germany
- 3.3. France
- 3.4. Italy
- 3.5. Spain
- 3.6. Russia
- 3.7. Benelux
- 3.8. Nordics
- 3.9. Rest of Europe
-
4. Middle East & Africa
- 4.1. Turkey
- 4.2. Israel
- 4.3. GCC
- 4.4. North Africa
- 4.5. South Africa
- 4.6. Rest of Middle East & Africa
-
5. Asia Pacific
- 5.1. China
- 5.2. India
- 5.3. Japan
- 5.4. South Korea
- 5.5. ASEAN
- 5.6. Oceania
- 5.7. Rest of Asia Pacific
Preclinical Tomography System for Biopharmaceuticals Regional Market Share
Geographic Coverage of Preclinical Tomography System for Biopharmaceuticals
Preclinical Tomography System for Biopharmaceuticals REPORT HIGHLIGHTS
| Aspects | Details |
|---|---|
| Study Period | 2020-2034 |
| Base Year | 2025 |
| Estimated Year | 2026 |
| Forecast Period | 2026-2034 |
| Historical Period | 2020-2025 |
| Growth Rate | CAGR of 4.3% from 2020-2034 |
| Segmentation |
|
Table of Contents
- 1. Introduction
- 1.1. Research Scope
- 1.2. Market Segmentation
- 1.3. Research Objective
- 1.4. Definitions and Assumptions
- 2. Executive Summary
- 2.1. Market Snapshot
- 3. Market Dynamics
- 3.1. Market Drivers
- 3.2. Market Restrains
- 3.3. Market Trends
- 3.4. Market Opportunities
- 4. Market Factor Analysis
- 4.1. Porters Five Forces
- 4.1.1. Bargaining Power of Suppliers
- 4.1.2. Bargaining Power of Buyers
- 4.1.3. Threat of New Entrants
- 4.1.4. Threat of Substitutes
- 4.1.5. Competitive Rivalry
- 4.2. PESTEL analysis
- 4.3. BCG Analysis
- 4.3.1. Stars (High Growth, High Market Share)
- 4.3.2. Cash Cows (Low Growth, High Market Share)
- 4.3.3. Question Mark (High Growth, Low Market Share)
- 4.3.4. Dogs (Low Growth, Low Market Share)
- 4.4. Ansoff Matrix Analysis
- 4.5. Supply Chain Analysis
- 4.6. Regulatory Landscape
- 4.7. Current Market Potential and Opportunity Assessment (TAM–SAM–SOM Framework)
- 4.8. MDP Analyst Note
- 4.1. Porters Five Forces
- 5. Market Analysis, Insights and Forecast 2021-2033
- 5.1. Market Analysis, Insights and Forecast - by Application
- 5.1.1. Hospital
- 5.1.2. Research Institute
- 5.1.3. Other
- 5.2. Market Analysis, Insights and Forecast - by Types
- 5.2.1. CT
- 5.2.2. SPECT
- 5.2.3. Others
- 5.3. Market Analysis, Insights and Forecast - by Region
- 5.3.1. North America
- 5.3.2. South America
- 5.3.3. Europe
- 5.3.4. Middle East & Africa
- 5.3.5. Asia Pacific
- 5.1. Market Analysis, Insights and Forecast - by Application
- 6. Global Preclinical Tomography System for Biopharmaceuticals Analysis, Insights and Forecast, 2021-2033
- 6.1. Market Analysis, Insights and Forecast - by Application
- 6.1.1. Hospital
- 6.1.2. Research Institute
- 6.1.3. Other
- 6.2. Market Analysis, Insights and Forecast - by Types
- 6.2.1. CT
- 6.2.2. SPECT
- 6.2.3. Others
- 6.1. Market Analysis, Insights and Forecast - by Application
- 7. North America Preclinical Tomography System for Biopharmaceuticals Analysis, Insights and Forecast, 2020-2032
- 7.1. Market Analysis, Insights and Forecast - by Application
- 7.1.1. Hospital
- 7.1.2. Research Institute
- 7.1.3. Other
- 7.2. Market Analysis, Insights and Forecast - by Types
- 7.2.1. CT
- 7.2.2. SPECT
- 7.2.3. Others
- 7.1. Market Analysis, Insights and Forecast - by Application
- 8. South America Preclinical Tomography System for Biopharmaceuticals Analysis, Insights and Forecast, 2020-2032
- 8.1. Market Analysis, Insights and Forecast - by Application
- 8.1.1. Hospital
- 8.1.2. Research Institute
- 8.1.3. Other
- 8.2. Market Analysis, Insights and Forecast - by Types
- 8.2.1. CT
- 8.2.2. SPECT
- 8.2.3. Others
- 8.1. Market Analysis, Insights and Forecast - by Application
- 9. Europe Preclinical Tomography System for Biopharmaceuticals Analysis, Insights and Forecast, 2020-2032
- 9.1. Market Analysis, Insights and Forecast - by Application
- 9.1.1. Hospital
- 9.1.2. Research Institute
- 9.1.3. Other
- 9.2. Market Analysis, Insights and Forecast - by Types
- 9.2.1. CT
- 9.2.2. SPECT
- 9.2.3. Others
- 9.1. Market Analysis, Insights and Forecast - by Application
- 10. Middle East & Africa Preclinical Tomography System for Biopharmaceuticals Analysis, Insights and Forecast, 2020-2032
- 10.1. Market Analysis, Insights and Forecast - by Application
- 10.1.1. Hospital
- 10.1.2. Research Institute
- 10.1.3. Other
- 10.2. Market Analysis, Insights and Forecast - by Types
- 10.2.1. CT
- 10.2.2. SPECT
- 10.2.3. Others
- 10.1. Market Analysis, Insights and Forecast - by Application
- 11. Asia Pacific Preclinical Tomography System for Biopharmaceuticals Analysis, Insights and Forecast, 2020-2032
- 11.1. Market Analysis, Insights and Forecast - by Application
- 11.1.1. Hospital
- 11.1.2. Research Institute
- 11.1.3. Other
- 11.2. Market Analysis, Insights and Forecast - by Types
- 11.2.1. CT
- 11.2.2. SPECT
- 11.2.3. Others
- 11.1. Market Analysis, Insights and Forecast - by Application
- 12. Competitive Analysis
- 12.1. Company Profiles
- 12.1.1 Bruker
- 12.1.1.1. Company Overview
- 12.1.1.2. Products
- 12.1.1.3. Company Financials
- 12.1.1.4. SWOT Analysis
- 12.1.2 MR Solutions
- 12.1.2.1. Company Overview
- 12.1.2.2. Products
- 12.1.2.3. Company Financials
- 12.1.2.4. SWOT Analysis
- 12.1.3 Scanco Medical
- 12.1.3.1. Company Overview
- 12.1.3.2. Products
- 12.1.3.3. Company Financials
- 12.1.3.4. SWOT Analysis
- 12.1.4 PerkinElmer
- 12.1.4.1. Company Overview
- 12.1.4.2. Products
- 12.1.4.3. Company Financials
- 12.1.4.4. SWOT Analysis
- 12.1.5 Trifoil Imaging
- 12.1.5.1. Company Overview
- 12.1.5.2. Products
- 12.1.5.3. Company Financials
- 12.1.5.4. SWOT Analysis
- 12.1.6 Mediso
- 12.1.6.1. Company Overview
- 12.1.6.2. Products
- 12.1.6.3. Company Financials
- 12.1.6.4. SWOT Analysis
- 12.1.7 Sedecal
- 12.1.7.1. Company Overview
- 12.1.7.2. Products
- 12.1.7.3. Company Financials
- 12.1.7.4. SWOT Analysis
- 12.1.8 MILabs
- 12.1.8.1. Company Overview
- 12.1.8.2. Products
- 12.1.8.3. Company Financials
- 12.1.8.4. SWOT Analysis
- 12.1.1 Bruker
- 12.2. Market Entropy
- 12.2.1 Company's Key Areas Served
- 12.2.2 Recent Developments
- 12.3. Company Market Share Analysis 2025
- 12.3.1 Top 5 Companies Market Share Analysis
- 12.3.2 Top 3 Companies Market Share Analysis
- 12.4. List of Potential Customers
- 13. Research Methodology
List of Figures
- Figure 1: Global Preclinical Tomography System for Biopharmaceuticals Revenue Breakdown (million, %) by Region 2025 & 2033
- Figure 2: North America Preclinical Tomography System for Biopharmaceuticals Revenue (million), by Application 2025 & 2033
- Figure 3: North America Preclinical Tomography System for Biopharmaceuticals Revenue Share (%), by Application 2025 & 2033
- Figure 4: North America Preclinical Tomography System for Biopharmaceuticals Revenue (million), by Types 2025 & 2033
- Figure 5: North America Preclinical Tomography System for Biopharmaceuticals Revenue Share (%), by Types 2025 & 2033
- Figure 6: North America Preclinical Tomography System for Biopharmaceuticals Revenue (million), by Country 2025 & 2033
- Figure 7: North America Preclinical Tomography System for Biopharmaceuticals Revenue Share (%), by Country 2025 & 2033
- Figure 8: South America Preclinical Tomography System for Biopharmaceuticals Revenue (million), by Application 2025 & 2033
- Figure 9: South America Preclinical Tomography System for Biopharmaceuticals Revenue Share (%), by Application 2025 & 2033
- Figure 10: South America Preclinical Tomography System for Biopharmaceuticals Revenue (million), by Types 2025 & 2033
- Figure 11: South America Preclinical Tomography System for Biopharmaceuticals Revenue Share (%), by Types 2025 & 2033
- Figure 12: South America Preclinical Tomography System for Biopharmaceuticals Revenue (million), by Country 2025 & 2033
- Figure 13: South America Preclinical Tomography System for Biopharmaceuticals Revenue Share (%), by Country 2025 & 2033
- Figure 14: Europe Preclinical Tomography System for Biopharmaceuticals Revenue (million), by Application 2025 & 2033
- Figure 15: Europe Preclinical Tomography System for Biopharmaceuticals Revenue Share (%), by Application 2025 & 2033
- Figure 16: Europe Preclinical Tomography System for Biopharmaceuticals Revenue (million), by Types 2025 & 2033
- Figure 17: Europe Preclinical Tomography System for Biopharmaceuticals Revenue Share (%), by Types 2025 & 2033
- Figure 18: Europe Preclinical Tomography System for Biopharmaceuticals Revenue (million), by Country 2025 & 2033
- Figure 19: Europe Preclinical Tomography System for Biopharmaceuticals Revenue Share (%), by Country 2025 & 2033
- Figure 20: Middle East & Africa Preclinical Tomography System for Biopharmaceuticals Revenue (million), by Application 2025 & 2033
- Figure 21: Middle East & Africa Preclinical Tomography System for Biopharmaceuticals Revenue Share (%), by Application 2025 & 2033
- Figure 22: Middle East & Africa Preclinical Tomography System for Biopharmaceuticals Revenue (million), by Types 2025 & 2033
- Figure 23: Middle East & Africa Preclinical Tomography System for Biopharmaceuticals Revenue Share (%), by Types 2025 & 2033
- Figure 24: Middle East & Africa Preclinical Tomography System for Biopharmaceuticals Revenue (million), by Country 2025 & 2033
- Figure 25: Middle East & Africa Preclinical Tomography System for Biopharmaceuticals Revenue Share (%), by Country 2025 & 2033
- Figure 26: Asia Pacific Preclinical Tomography System for Biopharmaceuticals Revenue (million), by Application 2025 & 2033
- Figure 27: Asia Pacific Preclinical Tomography System for Biopharmaceuticals Revenue Share (%), by Application 2025 & 2033
- Figure 28: Asia Pacific Preclinical Tomography System for Biopharmaceuticals Revenue (million), by Types 2025 & 2033
- Figure 29: Asia Pacific Preclinical Tomography System for Biopharmaceuticals Revenue Share (%), by Types 2025 & 2033
- Figure 30: Asia Pacific Preclinical Tomography System for Biopharmaceuticals Revenue (million), by Country 2025 & 2033
- Figure 31: Asia Pacific Preclinical Tomography System for Biopharmaceuticals Revenue Share (%), by Country 2025 & 2033
List of Tables
- Table 1: Global Preclinical Tomography System for Biopharmaceuticals Revenue million Forecast, by Application 2020 & 2033
- Table 2: Global Preclinical Tomography System for Biopharmaceuticals Revenue million Forecast, by Types 2020 & 2033
- Table 3: Global Preclinical Tomography System for Biopharmaceuticals Revenue million Forecast, by Region 2020 & 2033
- Table 4: Global Preclinical Tomography System for Biopharmaceuticals Revenue million Forecast, by Application 2020 & 2033
- Table 5: Global Preclinical Tomography System for Biopharmaceuticals Revenue million Forecast, by Types 2020 & 2033
- Table 6: Global Preclinical Tomography System for Biopharmaceuticals Revenue million Forecast, by Country 2020 & 2033
- Table 7: United States Preclinical Tomography System for Biopharmaceuticals Revenue (million) Forecast, by Application 2020 & 2033
- Table 8: Canada Preclinical Tomography System for Biopharmaceuticals Revenue (million) Forecast, by Application 2020 & 2033
- Table 9: Mexico Preclinical Tomography System for Biopharmaceuticals Revenue (million) Forecast, by Application 2020 & 2033
- Table 10: Global Preclinical Tomography System for Biopharmaceuticals Revenue million Forecast, by Application 2020 & 2033
- Table 11: Global Preclinical Tomography System for Biopharmaceuticals Revenue million Forecast, by Types 2020 & 2033
- Table 12: Global Preclinical Tomography System for Biopharmaceuticals Revenue million Forecast, by Country 2020 & 2033
- Table 13: Brazil Preclinical Tomography System for Biopharmaceuticals Revenue (million) Forecast, by Application 2020 & 2033
- Table 14: Argentina Preclinical Tomography System for Biopharmaceuticals Revenue (million) Forecast, by Application 2020 & 2033
- Table 15: Rest of South America Preclinical Tomography System for Biopharmaceuticals Revenue (million) Forecast, by Application 2020 & 2033
- Table 16: Global Preclinical Tomography System for Biopharmaceuticals Revenue million Forecast, by Application 2020 & 2033
- Table 17: Global Preclinical Tomography System for Biopharmaceuticals Revenue million Forecast, by Types 2020 & 2033
- Table 18: Global Preclinical Tomography System for Biopharmaceuticals Revenue million Forecast, by Country 2020 & 2033
- Table 19: United Kingdom Preclinical Tomography System for Biopharmaceuticals Revenue (million) Forecast, by Application 2020 & 2033
- Table 20: Germany Preclinical Tomography System for Biopharmaceuticals Revenue (million) Forecast, by Application 2020 & 2033
- Table 21: France Preclinical Tomography System for Biopharmaceuticals Revenue (million) Forecast, by Application 2020 & 2033
- Table 22: Italy Preclinical Tomography System for Biopharmaceuticals Revenue (million) Forecast, by Application 2020 & 2033
- Table 23: Spain Preclinical Tomography System for Biopharmaceuticals Revenue (million) Forecast, by Application 2020 & 2033
- Table 24: Russia Preclinical Tomography System for Biopharmaceuticals Revenue (million) Forecast, by Application 2020 & 2033
- Table 25: Benelux Preclinical Tomography System for Biopharmaceuticals Revenue (million) Forecast, by Application 2020 & 2033
- Table 26: Nordics Preclinical Tomography System for Biopharmaceuticals Revenue (million) Forecast, by Application 2020 & 2033
- Table 27: Rest of Europe Preclinical Tomography System for Biopharmaceuticals Revenue (million) Forecast, by Application 2020 & 2033
- Table 28: Global Preclinical Tomography System for Biopharmaceuticals Revenue million Forecast, by Application 2020 & 2033
- Table 29: Global Preclinical Tomography System for Biopharmaceuticals Revenue million Forecast, by Types 2020 & 2033
- Table 30: Global Preclinical Tomography System for Biopharmaceuticals Revenue million Forecast, by Country 2020 & 2033
- Table 31: Turkey Preclinical Tomography System for Biopharmaceuticals Revenue (million) Forecast, by Application 2020 & 2033
- Table 32: Israel Preclinical Tomography System for Biopharmaceuticals Revenue (million) Forecast, by Application 2020 & 2033
- Table 33: GCC Preclinical Tomography System for Biopharmaceuticals Revenue (million) Forecast, by Application 2020 & 2033
- Table 34: North Africa Preclinical Tomography System for Biopharmaceuticals Revenue (million) Forecast, by Application 2020 & 2033
- Table 35: South Africa Preclinical Tomography System for Biopharmaceuticals Revenue (million) Forecast, by Application 2020 & 2033
- Table 36: Rest of Middle East & Africa Preclinical Tomography System for Biopharmaceuticals Revenue (million) Forecast, by Application 2020 & 2033
- Table 37: Global Preclinical Tomography System for Biopharmaceuticals Revenue million Forecast, by Application 2020 & 2033
- Table 38: Global Preclinical Tomography System for Biopharmaceuticals Revenue million Forecast, by Types 2020 & 2033
- Table 39: Global Preclinical Tomography System for Biopharmaceuticals Revenue million Forecast, by Country 2020 & 2033
- Table 40: China Preclinical Tomography System for Biopharmaceuticals Revenue (million) Forecast, by Application 2020 & 2033
- Table 41: India Preclinical Tomography System for Biopharmaceuticals Revenue (million) Forecast, by Application 2020 & 2033
- Table 42: Japan Preclinical Tomography System for Biopharmaceuticals Revenue (million) Forecast, by Application 2020 & 2033
- Table 43: South Korea Preclinical Tomography System for Biopharmaceuticals Revenue (million) Forecast, by Application 2020 & 2033
- Table 44: ASEAN Preclinical Tomography System for Biopharmaceuticals Revenue (million) Forecast, by Application 2020 & 2033
- Table 45: Oceania Preclinical Tomography System for Biopharmaceuticals Revenue (million) Forecast, by Application 2020 & 2033
- Table 46: Rest of Asia Pacific Preclinical Tomography System for Biopharmaceuticals Revenue (million) Forecast, by Application 2020 & 2033
Frequently Asked Questions
1. What is the projected Compound Annual Growth Rate (CAGR) of the Preclinical Tomography System for Biopharmaceuticals?
The projected CAGR is approximately 4.3%.
2. Which companies are prominent players in the Preclinical Tomography System for Biopharmaceuticals?
Key companies in the market include Bruker, MR Solutions, Scanco Medical, PerkinElmer, Trifoil Imaging, Mediso, Sedecal, MILabs.
3. What are the main segments of the Preclinical Tomography System for Biopharmaceuticals?
The market segments include Application, Types.
4. Can you provide details about the market size?
The market size is estimated to be USD 153.9 million as of 2022.
5. What are some drivers contributing to market growth?
N/A
6. What are the notable trends driving market growth?
N/A
7. Are there any restraints impacting market growth?
N/A
8. Can you provide examples of recent developments in the market?
N/A
9. What pricing options are available for accessing the report?
Pricing options include single-user, multi-user, and enterprise licenses priced at USD 2900.00, USD 4350.00, and USD 5800.00 respectively.
10. Is the market size provided in terms of value or volume?
The market size is provided in terms of value, measured in million.
11. Are there any specific market keywords associated with the report?
Yes, the market keyword associated with the report is "Preclinical Tomography System for Biopharmaceuticals," which aids in identifying and referencing the specific market segment covered.
12. How do I determine which pricing option suits my needs best?
The pricing options vary based on user requirements and access needs. Individual users may opt for single-user licenses, while businesses requiring broader access may choose multi-user or enterprise licenses for cost-effective access to the report.
13. Are there any additional resources or data provided in the Preclinical Tomography System for Biopharmaceuticals report?
While the report offers comprehensive insights, it's advisable to review the specific contents or supplementary materials provided to ascertain if additional resources or data are available.
14. How can I stay updated on further developments or reports in the Preclinical Tomography System for Biopharmaceuticals?
To stay informed about further developments, trends, and reports in the Preclinical Tomography System for Biopharmaceuticals, consider subscribing to industry newsletters, following relevant companies and organizations, or regularly checking reputable industry news sources and publications.
Methodology
Step 1 - Identification of Relevant Samples Size from Population Database


Step 2 - Approaches for Defining Global Market Size (Value, Volume* & Price*)

Note*: In applicable scenarios
Step 3 - Data Sources
Primary Research
- Web Analytics
- Survey Reports
- Research Institute
- Latest Research Reports
- Opinion Leaders
Secondary Research
- Annual Reports
- White Paper
- Latest Press Release
- Industry Association
- Paid Database
- Investor Presentations

Step 4 - Data Triangulation
Involves using different sources of information in order to increase the validity of a study
These sources are likely to be stakeholders in a program - participants, other researchers, program staff, other community members, and so on.
Then we put all data in single framework & apply various statistical tools to find out the dynamic on the market.
During the analysis stage, feedback from the stakeholder groups would be compared to determine areas of agreement as well as areas of divergence