

Key Insights
The global Power Sequencers market is poised for substantial growth, projected to reach $12.46 billion in 2025. This expansion is driven by an estimated 9.82% CAGR from 2019-2033, indicating robust demand and innovation within the sector. Key applications such as Automotive, Industrial, and Telecom are emerging as significant growth engines, fueled by the increasing complexity and power management needs of modern electronic systems. The proliferation of sophisticated automotive electronics, including advanced driver-assistance systems (ADAS) and in-car infotainment, necessitates precise power sequencing for optimal performance and reliability. Similarly, the Industrial sector's adoption of automation, IIoT devices, and advanced control systems relies heavily on efficient and controlled power distribution. The ever-growing demand for higher bandwidth and lower latency in telecommunications infrastructure further amplifies the need for advanced power sequencing solutions.
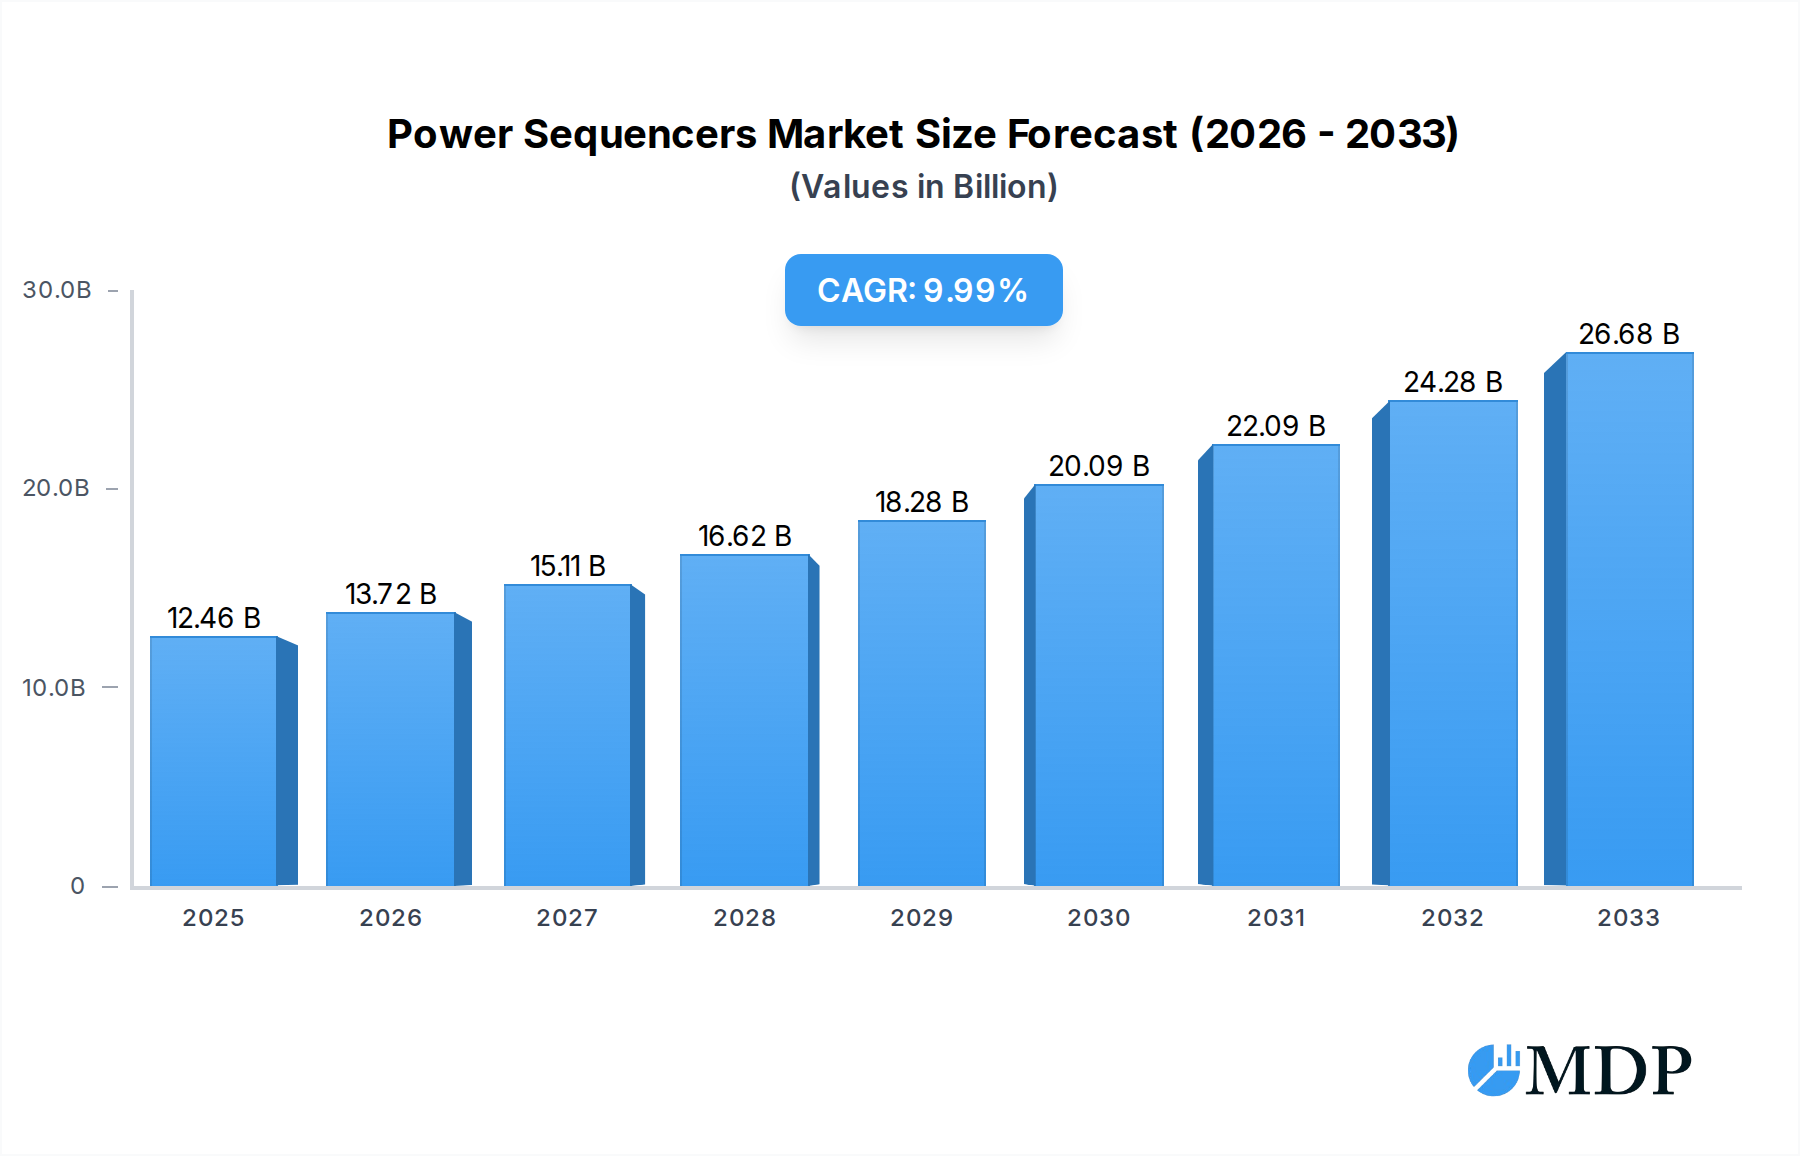
Power Sequencers Market Size (In Billion)
The market's trajectory is further shaped by evolving technological trends, including the integration of advanced AI and machine learning for predictive power management, the miniaturization of components, and the increasing emphasis on energy efficiency and power integrity. While the market benefits from these drivers, potential restraints include the upfront cost of sophisticated power sequencing solutions and the challenges associated with integrating them into existing legacy systems. However, the continuous innovation by leading companies like TI, Analog Devices, and Infineon Technologies, who are actively developing more intelligent, compact, and cost-effective power sequencing ICs, is expected to mitigate these challenges. The market is segmented into Analog and Digital Power Supply Sequencers, with digital solutions gaining prominence due to their enhanced programmability and flexibility in managing complex power rails.

Power Sequencers Company Market Share
This in-depth report provides a definitive analysis of the global power sequencers market, a critical component in modern electronic systems. Delving into market dynamics, industry trends, and competitive landscapes, this study offers unparalleled insights for stakeholders navigating the evolving power management ecosystem. With a comprehensive study period spanning 2019 to 2033, a base year of 2025, and a robust forecast period of 2025 to 2033, this report leverages historical data from 2019 to 2024 to deliver actionable intelligence. Explore the intricate interplay of technological advancements, burgeoning applications, and strategic business moves shaping the future of power sequencing solutions. This report is essential for semiconductor manufacturers, system integrators, product designers, and investors seeking to capitalize on the substantial growth anticipated in this dynamic sector.
Power Sequencers Market Dynamics & Concentration
The global power sequencers market is characterized by a moderate level of concentration, with key players like Texas Instruments (TI), Dialog Semiconductor, Analog Devices, Renesas Electronics, STMicroelectronics, Infineon Technologies, and NXP Semiconductors holding significant market share. Innovation drivers are primarily fueled by the increasing complexity of electronic devices, demanding more sophisticated power management strategies to ensure optimal performance, reliability, and energy efficiency. Regulatory frameworks, particularly those focused on energy conservation and electromagnetic compatibility (EMC), are indirectly influencing the adoption of advanced power sequencing techniques. Product substitutes, while present in simpler implementations, often fall short of the precision and control offered by dedicated power sequencers, especially in high-performance applications. End-user trends underscore a growing demand for miniaturization, increased functionality, and extended battery life across various segments. Mergers and acquisition (M&A) activities, though not consistently high in volume, have been strategic, aimed at consolidating expertise and expanding product portfolios to address emerging market needs. For instance, a notable acquisition in the historical period (2019-2024) involved a leading semiconductor firm acquiring a specialized power management IC developer to bolster its offerings in the automotive and industrial sectors. The market share of the top five players is estimated to be around 60%, with approximately 5-10 significant M&A deals observed throughout the study period, indicating a competitive yet consolidating landscape.
Power Sequencers Industry Trends & Analysis
The power sequencers industry is experiencing robust growth, projected to expand at a Compound Annual Growth Rate (CAGR) of approximately 8.5% during the forecast period 2025-2033. This expansion is propelled by several key market growth drivers. The relentless miniaturization of electronic devices, from consumer gadgets to complex industrial machinery, necessitates highly integrated and efficient power management solutions, with power sequencers playing a pivotal role in managing multiple voltage rails and power sequencing requirements. Technological disruptions, such as advancements in silicon-on-insulator (SOI) technology and the development of ultra-low quiescent current (Iq) power sequencers, are enhancing performance and reducing power consumption, thereby driving adoption. Consumer preferences are increasingly leaning towards devices with longer battery life and enhanced performance under varying load conditions, directly benefiting the integration of sophisticated power sequencing. The competitive dynamics are intensifying, with established players investing heavily in R&D to introduce next-generation sequencing solutions and new market entrants focusing on niche applications. Market penetration for advanced digital power sequencers is steadily increasing, estimated to reach over 40% by 2033, up from approximately 25% in 2025. The burgeoning demand for intelligent power management in the automotive sector, driven by the proliferation of electric vehicles (EVs) and advanced driver-assistance systems (ADAS), is a significant growth catalyst. Similarly, the industrial automation segment, with its increasing reliance on complex control systems and robotics, is also a major contributor to market expansion. The telecom infrastructure upgrade cycle, supporting 5G deployment and beyond, further fuels the demand for reliable and efficient power sequencing. The market size is projected to grow from an estimated USD 1.5 billion in 2025 to over USD 3.0 billion by 2033.
Leading Markets & Segments in Power Sequencers
The Automotive segment is currently the dominant market for power sequencers, driven by the transformative shift towards electrification and the increasing complexity of in-vehicle electronic systems. Countries like China, the United States, Germany, Japan, and South Korea represent leading markets due to their strong automotive manufacturing bases and significant investments in EV technology. Within the Automotive segment, the demand is particularly high for applications like battery management systems (BMS), infotainment systems, ADAS, and powertrain control, where precise power sequencing is critical for safety and performance.
Key drivers for this dominance include:
- Economic Policies: Government incentives for electric vehicle adoption and emission reduction targets are directly boosting the demand for advanced automotive electronics.
- Infrastructure: The development of charging infrastructure for EVs indirectly supports the broader adoption of electrified vehicles requiring sophisticated power management.
- Technological Advancement: The continuous innovation in ADAS and autonomous driving technologies necessitates a higher density of electronic components, each requiring optimized power sequencing.
The Industrial segment is a rapidly growing second-largest segment, driven by the widespread adoption of Industry 4.0 technologies, automation, and the Industrial Internet of Things (IIoT). Countries with strong industrial bases, such as Germany, the United States, and Japan, are key contributors to this segment's growth. Applications within the Industrial segment include programmable logic controllers (PLCs), robotics, industrial control systems, and power supplies for factory automation.
Key drivers for this segment include:
- Automation Initiatives: Increased investment in automated manufacturing processes requires reliable and efficient power distribution and control.
- Energy Efficiency Mandates: Stringent energy efficiency regulations in industrial settings push for optimized power consumption, where power sequencers play a crucial role.
The Telecom segment, encompassing infrastructure for 5G and future network generations, is also a significant consumer of power sequencers. The substantial investments in network upgrades worldwide are driving demand for high-performance and reliable power management solutions.
In terms of product types, Digital Power Supply Sequencers are witnessing faster growth due to their flexibility, programmability, and ability to manage complex sequencing algorithms compared to their analog counterparts. The FPGA Attach segment, though smaller, is crucial for high-performance computing and specialized applications where FPGAs require precise power sequencing for optimal operation.
Power Sequencers Product Developments
Recent product developments in the power sequencers market are focused on enhancing integration, improving energy efficiency, and offering greater programmability. Companies are actively developing multi-channel sequencers that can manage a larger number of voltage rails with reduced board space. Innovations include the introduction of sequencers with advanced fault detection and reporting capabilities, crucial for industrial and automotive safety applications. Furthermore, there is a strong trend towards ultra-low quiescent current (Iq) sequencers to maximize battery life in portable devices. Competitive advantages are being gained through increased voltage and current handling capabilities, wider operating temperature ranges, and streamlined integration with microcontrollers and FPGAs, catering to demanding application requirements.
Key Drivers of Power Sequencers Growth
The power sequencers market is propelled by several significant growth drivers. The escalating complexity of electronic systems across all sectors necessitates sophisticated power management, making power sequencers indispensable for reliable operation. Technological advancements, such as the integration of advanced digital signal processing (DSP) capabilities and the development of intelligent sequencing algorithms, are enhancing performance and efficiency. Economic factors like the growing adoption of electric vehicles and the expansion of industrial automation globally are creating substantial demand. Furthermore, regulatory mandates for energy efficiency and emissions reduction are indirectly driving the adoption of advanced power management solutions, including power sequencers. The increasing demand for portable electronics with extended battery life further amplifies the need for efficient power sequencing.
Challenges in the Power Sequencers Market
Despite the robust growth, the power sequencers market faces several challenges. Regulatory hurdles, particularly concerning power consumption standards and safety certifications in certain regions, can impact product development timelines and costs. Supply chain disruptions, as evidenced by recent global events, can affect the availability of critical components and lead to increased lead times and fluctuating prices. Intense competitive pressure among established players and emerging manufacturers drives down profit margins. The high initial investment required for research and development of cutting-edge sequencing technology can also be a barrier for smaller companies. Furthermore, the complexity of integration for some advanced sequencers into existing system architectures can pose a challenge for end-users.
Emerging Opportunities in Power Sequencers
Emerging opportunities in the power sequencers market are primarily driven by technological breakthroughs and strategic market expansion. The proliferation of artificial intelligence (AI) and machine learning (ML) in edge computing and IoT devices presents a significant opportunity for intelligent power sequencers that can adapt their power management strategies in real-time. Strategic partnerships between power sequencer manufacturers and semiconductor companies specializing in microcontrollers, FPGAs, and advanced power ICs can lead to the development of highly integrated and optimized power solutions. Market expansion into developing economies, as they increasingly adopt advanced electronics and industrial automation, offers substantial untapped potential. Furthermore, the growing demand for energy harvesting solutions and smart grid technologies opens new avenues for specialized power sequencing applications.
Leading Players in the Power Sequencers Sector
- Texas Instruments
- Dialog Semiconductor
- Analog Devices
- Renesas Electronics
- STMicroelectronics
- Infineon Technologies
- NXP Semiconductors
Key Milestones in Power Sequencers Industry
- 2019: Launch of advanced multi-channel digital power sequencers with enhanced programmability for industrial automation.
- 2020: Significant M&A activity involving a major player acquiring a niche power management IC firm to bolster its automotive offerings.
- 2021: Introduction of ultra-low quiescent current (Iq) power sequencers designed for extended battery life in consumer electronics.
- 2022: Release of highly integrated power sequencing solutions specifically targeting the growing electric vehicle market.
- 2023: Development of power sequencers with advanced fault detection and reporting for enhanced safety in industrial control systems.
- 2024 (Estimated): Increased adoption of AI/ML-enabled power sequencing for edge computing applications.
Strategic Outlook for Power Sequencers Market
The strategic outlook for the power sequencers market remains exceptionally bright, fueled by a convergence of accelerating technological advancements and expanding application landscapes. Growth accelerators include the continued miniaturization of electronics, the relentless pursuit of energy efficiency across industries, and the increasing sophistication of embedded systems in automotive, industrial, and telecommunications sectors. The trend towards digitalization and the adoption of Industry 4.0 principles will further solidify the demand for intelligent and programmable power sequencing solutions. Companies that can innovate in areas like ultra-low power consumption, advanced fault management, and seamless integration with next-generation microcontrollers and processors will be well-positioned to capture significant market share. Strategic focus on developing tailored solutions for emerging markets and high-growth segments like electric mobility and AI-driven applications will be crucial for sustained success.
Power Sequencers Segmentation
-
1. Application
- 1.1. FPGA Attach
- 1.2. Automotive
- 1.3. Industrial
- 1.4. Telecom
- 1.5. Others
-
2. Types
- 2.1. Analog Power Supply Sequencers
- 2.2. Digital Power Supply Sequencers
Power Sequencers Segmentation By Geography
-
1. North America
- 1.1. United States
- 1.2. Canada
- 1.3. Mexico
-
2. South America
- 2.1. Brazil
- 2.2. Argentina
- 2.3. Rest of South America
-
3. Europe
- 3.1. United Kingdom
- 3.2. Germany
- 3.3. France
- 3.4. Italy
- 3.5. Spain
- 3.6. Russia
- 3.7. Benelux
- 3.8. Nordics
- 3.9. Rest of Europe
-
4. Middle East & Africa
- 4.1. Turkey
- 4.2. Israel
- 4.3. GCC
- 4.4. North Africa
- 4.5. South Africa
- 4.6. Rest of Middle East & Africa
-
5. Asia Pacific
- 5.1. China
- 5.2. India
- 5.3. Japan
- 5.4. South Korea
- 5.5. ASEAN
- 5.6. Oceania
- 5.7. Rest of Asia Pacific
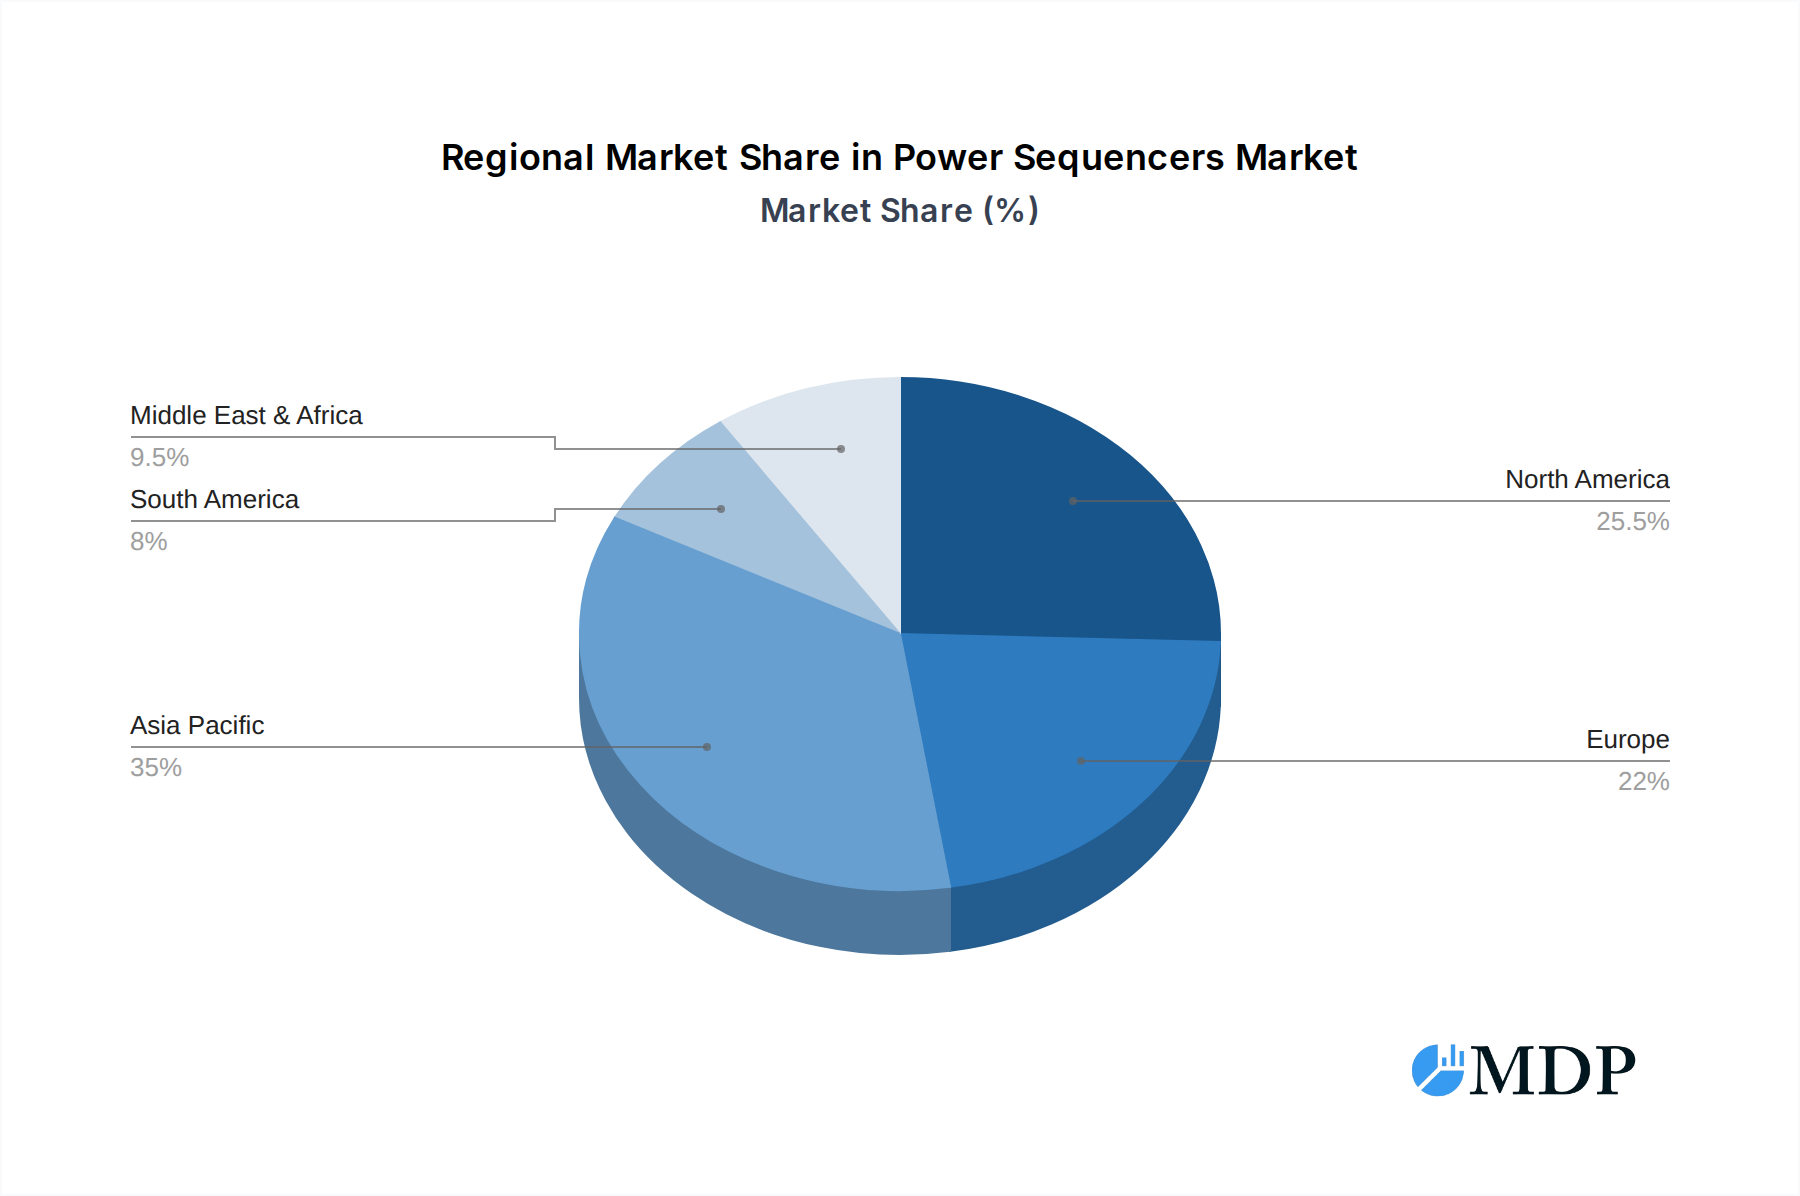
Power Sequencers Regional Market Share
Geographic Coverage of Power Sequencers
Power Sequencers REPORT HIGHLIGHTS
| Aspects | Details |
|---|---|
| Study Period | 2020-2034 |
| Base Year | 2025 |
| Estimated Year | 2026 |
| Forecast Period | 2026-2034 |
| Historical Period | 2020-2025 |
| Growth Rate | CAGR of 9.82% from 2020-2034 |
| Segmentation |
|
Table of Contents
- 1. Introduction
- 1.1. Research Scope
- 1.2. Market Segmentation
- 1.3. Research Methodology
- 1.4. Definitions and Assumptions
- 2. Executive Summary
- 2.1. Introduction
- 3. Market Dynamics
- 3.1. Introduction
- 3.2. Market Drivers
- 3.3. Market Restrains
- 3.4. Market Trends
- 4. Market Factor Analysis
- 4.1. Porters Five Forces
- 4.2. Supply/Value Chain
- 4.3. PESTEL analysis
- 4.4. Market Entropy
- 4.5. Patent/Trademark Analysis
- 5. Global Power Sequencers Analysis, Insights and Forecast, 2020-2032
- 5.1. Market Analysis, Insights and Forecast - by Application
- 5.1.1. FPGA Attach
- 5.1.2. Automotive
- 5.1.3. Industrial
- 5.1.4. Telecom
- 5.1.5. Others
- 5.2. Market Analysis, Insights and Forecast - by Types
- 5.2.1. Analog Power Supply Sequencers
- 5.2.2. Digital Power Supply Sequencers
- 5.3. Market Analysis, Insights and Forecast - by Region
- 5.3.1. North America
- 5.3.2. South America
- 5.3.3. Europe
- 5.3.4. Middle East & Africa
- 5.3.5. Asia Pacific
- 5.1. Market Analysis, Insights and Forecast - by Application
- 6. North America Power Sequencers Analysis, Insights and Forecast, 2020-2032
- 6.1. Market Analysis, Insights and Forecast - by Application
- 6.1.1. FPGA Attach
- 6.1.2. Automotive
- 6.1.3. Industrial
- 6.1.4. Telecom
- 6.1.5. Others
- 6.2. Market Analysis, Insights and Forecast - by Types
- 6.2.1. Analog Power Supply Sequencers
- 6.2.2. Digital Power Supply Sequencers
- 6.1. Market Analysis, Insights and Forecast - by Application
- 7. South America Power Sequencers Analysis, Insights and Forecast, 2020-2032
- 7.1. Market Analysis, Insights and Forecast - by Application
- 7.1.1. FPGA Attach
- 7.1.2. Automotive
- 7.1.3. Industrial
- 7.1.4. Telecom
- 7.1.5. Others
- 7.2. Market Analysis, Insights and Forecast - by Types
- 7.2.1. Analog Power Supply Sequencers
- 7.2.2. Digital Power Supply Sequencers
- 7.1. Market Analysis, Insights and Forecast - by Application
- 8. Europe Power Sequencers Analysis, Insights and Forecast, 2020-2032
- 8.1. Market Analysis, Insights and Forecast - by Application
- 8.1.1. FPGA Attach
- 8.1.2. Automotive
- 8.1.3. Industrial
- 8.1.4. Telecom
- 8.1.5. Others
- 8.2. Market Analysis, Insights and Forecast - by Types
- 8.2.1. Analog Power Supply Sequencers
- 8.2.2. Digital Power Supply Sequencers
- 8.1. Market Analysis, Insights and Forecast - by Application
- 9. Middle East & Africa Power Sequencers Analysis, Insights and Forecast, 2020-2032
- 9.1. Market Analysis, Insights and Forecast - by Application
- 9.1.1. FPGA Attach
- 9.1.2. Automotive
- 9.1.3. Industrial
- 9.1.4. Telecom
- 9.1.5. Others
- 9.2. Market Analysis, Insights and Forecast - by Types
- 9.2.1. Analog Power Supply Sequencers
- 9.2.2. Digital Power Supply Sequencers
- 9.1. Market Analysis, Insights and Forecast - by Application
- 10. Asia Pacific Power Sequencers Analysis, Insights and Forecast, 2020-2032
- 10.1. Market Analysis, Insights and Forecast - by Application
- 10.1.1. FPGA Attach
- 10.1.2. Automotive
- 10.1.3. Industrial
- 10.1.4. Telecom
- 10.1.5. Others
- 10.2. Market Analysis, Insights and Forecast - by Types
- 10.2.1. Analog Power Supply Sequencers
- 10.2.2. Digital Power Supply Sequencers
- 10.1. Market Analysis, Insights and Forecast - by Application
- 11. Competitive Analysis
- 11.1. Global Market Share Analysis 2025
- 11.2. Company Profiles
- 11.2.1 TI
- 11.2.1.1. Overview
- 11.2.1.2. Products
- 11.2.1.3. SWOT Analysis
- 11.2.1.4. Recent Developments
- 11.2.1.5. Financials (Based on Availability)
- 11.2.2 Dialog Semiconductor
- 11.2.2.1. Overview
- 11.2.2.2. Products
- 11.2.2.3. SWOT Analysis
- 11.2.2.4. Recent Developments
- 11.2.2.5. Financials (Based on Availability)
- 11.2.3 Analog Devices
- 11.2.3.1. Overview
- 11.2.3.2. Products
- 11.2.3.3. SWOT Analysis
- 11.2.3.4. Recent Developments
- 11.2.3.5. Financials (Based on Availability)
- 11.2.4 Renesas Electronics
- 11.2.4.1. Overview
- 11.2.4.2. Products
- 11.2.4.3. SWOT Analysis
- 11.2.4.4. Recent Developments
- 11.2.4.5. Financials (Based on Availability)
- 11.2.5 STMicroelectronics
- 11.2.5.1. Overview
- 11.2.5.2. Products
- 11.2.5.3. SWOT Analysis
- 11.2.5.4. Recent Developments
- 11.2.5.5. Financials (Based on Availability)
- 11.2.6 Infineon Technologies
- 11.2.6.1. Overview
- 11.2.6.2. Products
- 11.2.6.3. SWOT Analysis
- 11.2.6.4. Recent Developments
- 11.2.6.5. Financials (Based on Availability)
- 11.2.7 NXP Semiconductors
- 11.2.7.1. Overview
- 11.2.7.2. Products
- 11.2.7.3. SWOT Analysis
- 11.2.7.4. Recent Developments
- 11.2.7.5. Financials (Based on Availability)
- 11.2.1 TI
List of Figures
- Figure 1: Global Power Sequencers Revenue Breakdown (billion, %) by Region 2025 & 2033
- Figure 2: Global Power Sequencers Volume Breakdown (K, %) by Region 2025 & 2033
- Figure 3: North America Power Sequencers Revenue (billion), by Application 2025 & 2033
- Figure 4: North America Power Sequencers Volume (K), by Application 2025 & 2033
- Figure 5: North America Power Sequencers Revenue Share (%), by Application 2025 & 2033
- Figure 6: North America Power Sequencers Volume Share (%), by Application 2025 & 2033
- Figure 7: North America Power Sequencers Revenue (billion), by Types 2025 & 2033
- Figure 8: North America Power Sequencers Volume (K), by Types 2025 & 2033
- Figure 9: North America Power Sequencers Revenue Share (%), by Types 2025 & 2033
- Figure 10: North America Power Sequencers Volume Share (%), by Types 2025 & 2033
- Figure 11: North America Power Sequencers Revenue (billion), by Country 2025 & 2033
- Figure 12: North America Power Sequencers Volume (K), by Country 2025 & 2033
- Figure 13: North America Power Sequencers Revenue Share (%), by Country 2025 & 2033
- Figure 14: North America Power Sequencers Volume Share (%), by Country 2025 & 2033
- Figure 15: South America Power Sequencers Revenue (billion), by Application 2025 & 2033
- Figure 16: South America Power Sequencers Volume (K), by Application 2025 & 2033
- Figure 17: South America Power Sequencers Revenue Share (%), by Application 2025 & 2033
- Figure 18: South America Power Sequencers Volume Share (%), by Application 2025 & 2033
- Figure 19: South America Power Sequencers Revenue (billion), by Types 2025 & 2033
- Figure 20: South America Power Sequencers Volume (K), by Types 2025 & 2033
- Figure 21: South America Power Sequencers Revenue Share (%), by Types 2025 & 2033
- Figure 22: South America Power Sequencers Volume Share (%), by Types 2025 & 2033
- Figure 23: South America Power Sequencers Revenue (billion), by Country 2025 & 2033
- Figure 24: South America Power Sequencers Volume (K), by Country 2025 & 2033
- Figure 25: South America Power Sequencers Revenue Share (%), by Country 2025 & 2033
- Figure 26: South America Power Sequencers Volume Share (%), by Country 2025 & 2033
- Figure 27: Europe Power Sequencers Revenue (billion), by Application 2025 & 2033
- Figure 28: Europe Power Sequencers Volume (K), by Application 2025 & 2033
- Figure 29: Europe Power Sequencers Revenue Share (%), by Application 2025 & 2033
- Figure 30: Europe Power Sequencers Volume Share (%), by Application 2025 & 2033
- Figure 31: Europe Power Sequencers Revenue (billion), by Types 2025 & 2033
- Figure 32: Europe Power Sequencers Volume (K), by Types 2025 & 2033
- Figure 33: Europe Power Sequencers Revenue Share (%), by Types 2025 & 2033
- Figure 34: Europe Power Sequencers Volume Share (%), by Types 2025 & 2033
- Figure 35: Europe Power Sequencers Revenue (billion), by Country 2025 & 2033
- Figure 36: Europe Power Sequencers Volume (K), by Country 2025 & 2033
- Figure 37: Europe Power Sequencers Revenue Share (%), by Country 2025 & 2033
- Figure 38: Europe Power Sequencers Volume Share (%), by Country 2025 & 2033
- Figure 39: Middle East & Africa Power Sequencers Revenue (billion), by Application 2025 & 2033
- Figure 40: Middle East & Africa Power Sequencers Volume (K), by Application 2025 & 2033
- Figure 41: Middle East & Africa Power Sequencers Revenue Share (%), by Application 2025 & 2033
- Figure 42: Middle East & Africa Power Sequencers Volume Share (%), by Application 2025 & 2033
- Figure 43: Middle East & Africa Power Sequencers Revenue (billion), by Types 2025 & 2033
- Figure 44: Middle East & Africa Power Sequencers Volume (K), by Types 2025 & 2033
- Figure 45: Middle East & Africa Power Sequencers Revenue Share (%), by Types 2025 & 2033
- Figure 46: Middle East & Africa Power Sequencers Volume Share (%), by Types 2025 & 2033
- Figure 47: Middle East & Africa Power Sequencers Revenue (billion), by Country 2025 & 2033
- Figure 48: Middle East & Africa Power Sequencers Volume (K), by Country 2025 & 2033
- Figure 49: Middle East & Africa Power Sequencers Revenue Share (%), by Country 2025 & 2033
- Figure 50: Middle East & Africa Power Sequencers Volume Share (%), by Country 2025 & 2033
- Figure 51: Asia Pacific Power Sequencers Revenue (billion), by Application 2025 & 2033
- Figure 52: Asia Pacific Power Sequencers Volume (K), by Application 2025 & 2033
- Figure 53: Asia Pacific Power Sequencers Revenue Share (%), by Application 2025 & 2033
- Figure 54: Asia Pacific Power Sequencers Volume Share (%), by Application 2025 & 2033
- Figure 55: Asia Pacific Power Sequencers Revenue (billion), by Types 2025 & 2033
- Figure 56: Asia Pacific Power Sequencers Volume (K), by Types 2025 & 2033
- Figure 57: Asia Pacific Power Sequencers Revenue Share (%), by Types 2025 & 2033
- Figure 58: Asia Pacific Power Sequencers Volume Share (%), by Types 2025 & 2033
- Figure 59: Asia Pacific Power Sequencers Revenue (billion), by Country 2025 & 2033
- Figure 60: Asia Pacific Power Sequencers Volume (K), by Country 2025 & 2033
- Figure 61: Asia Pacific Power Sequencers Revenue Share (%), by Country 2025 & 2033
- Figure 62: Asia Pacific Power Sequencers Volume Share (%), by Country 2025 & 2033
List of Tables
- Table 1: Global Power Sequencers Revenue billion Forecast, by Application 2020 & 2033
- Table 2: Global Power Sequencers Volume K Forecast, by Application 2020 & 2033
- Table 3: Global Power Sequencers Revenue billion Forecast, by Types 2020 & 2033
- Table 4: Global Power Sequencers Volume K Forecast, by Types 2020 & 2033
- Table 5: Global Power Sequencers Revenue billion Forecast, by Region 2020 & 2033
- Table 6: Global Power Sequencers Volume K Forecast, by Region 2020 & 2033
- Table 7: Global Power Sequencers Revenue billion Forecast, by Application 2020 & 2033
- Table 8: Global Power Sequencers Volume K Forecast, by Application 2020 & 2033
- Table 9: Global Power Sequencers Revenue billion Forecast, by Types 2020 & 2033
- Table 10: Global Power Sequencers Volume K Forecast, by Types 2020 & 2033
- Table 11: Global Power Sequencers Revenue billion Forecast, by Country 2020 & 2033
- Table 12: Global Power Sequencers Volume K Forecast, by Country 2020 & 2033
- Table 13: United States Power Sequencers Revenue (billion) Forecast, by Application 2020 & 2033
- Table 14: United States Power Sequencers Volume (K) Forecast, by Application 2020 & 2033
- Table 15: Canada Power Sequencers Revenue (billion) Forecast, by Application 2020 & 2033
- Table 16: Canada Power Sequencers Volume (K) Forecast, by Application 2020 & 2033
- Table 17: Mexico Power Sequencers Revenue (billion) Forecast, by Application 2020 & 2033
- Table 18: Mexico Power Sequencers Volume (K) Forecast, by Application 2020 & 2033
- Table 19: Global Power Sequencers Revenue billion Forecast, by Application 2020 & 2033
- Table 20: Global Power Sequencers Volume K Forecast, by Application 2020 & 2033
- Table 21: Global Power Sequencers Revenue billion Forecast, by Types 2020 & 2033
- Table 22: Global Power Sequencers Volume K Forecast, by Types 2020 & 2033
- Table 23: Global Power Sequencers Revenue billion Forecast, by Country 2020 & 2033
- Table 24: Global Power Sequencers Volume K Forecast, by Country 2020 & 2033
- Table 25: Brazil Power Sequencers Revenue (billion) Forecast, by Application 2020 & 2033
- Table 26: Brazil Power Sequencers Volume (K) Forecast, by Application 2020 & 2033
- Table 27: Argentina Power Sequencers Revenue (billion) Forecast, by Application 2020 & 2033
- Table 28: Argentina Power Sequencers Volume (K) Forecast, by Application 2020 & 2033
- Table 29: Rest of South America Power Sequencers Revenue (billion) Forecast, by Application 2020 & 2033
- Table 30: Rest of South America Power Sequencers Volume (K) Forecast, by Application 2020 & 2033
- Table 31: Global Power Sequencers Revenue billion Forecast, by Application 2020 & 2033
- Table 32: Global Power Sequencers Volume K Forecast, by Application 2020 & 2033
- Table 33: Global Power Sequencers Revenue billion Forecast, by Types 2020 & 2033
- Table 34: Global Power Sequencers Volume K Forecast, by Types 2020 & 2033
- Table 35: Global Power Sequencers Revenue billion Forecast, by Country 2020 & 2033
- Table 36: Global Power Sequencers Volume K Forecast, by Country 2020 & 2033
- Table 37: United Kingdom Power Sequencers Revenue (billion) Forecast, by Application 2020 & 2033
- Table 38: United Kingdom Power Sequencers Volume (K) Forecast, by Application 2020 & 2033
- Table 39: Germany Power Sequencers Revenue (billion) Forecast, by Application 2020 & 2033
- Table 40: Germany Power Sequencers Volume (K) Forecast, by Application 2020 & 2033
- Table 41: France Power Sequencers Revenue (billion) Forecast, by Application 2020 & 2033
- Table 42: France Power Sequencers Volume (K) Forecast, by Application 2020 & 2033
- Table 43: Italy Power Sequencers Revenue (billion) Forecast, by Application 2020 & 2033
- Table 44: Italy Power Sequencers Volume (K) Forecast, by Application 2020 & 2033
- Table 45: Spain Power Sequencers Revenue (billion) Forecast, by Application 2020 & 2033
- Table 46: Spain Power Sequencers Volume (K) Forecast, by Application 2020 & 2033
- Table 47: Russia Power Sequencers Revenue (billion) Forecast, by Application 2020 & 2033
- Table 48: Russia Power Sequencers Volume (K) Forecast, by Application 2020 & 2033
- Table 49: Benelux Power Sequencers Revenue (billion) Forecast, by Application 2020 & 2033
- Table 50: Benelux Power Sequencers Volume (K) Forecast, by Application 2020 & 2033
- Table 51: Nordics Power Sequencers Revenue (billion) Forecast, by Application 2020 & 2033
- Table 52: Nordics Power Sequencers Volume (K) Forecast, by Application 2020 & 2033
- Table 53: Rest of Europe Power Sequencers Revenue (billion) Forecast, by Application 2020 & 2033
- Table 54: Rest of Europe Power Sequencers Volume (K) Forecast, by Application 2020 & 2033
- Table 55: Global Power Sequencers Revenue billion Forecast, by Application 2020 & 2033
- Table 56: Global Power Sequencers Volume K Forecast, by Application 2020 & 2033
- Table 57: Global Power Sequencers Revenue billion Forecast, by Types 2020 & 2033
- Table 58: Global Power Sequencers Volume K Forecast, by Types 2020 & 2033
- Table 59: Global Power Sequencers Revenue billion Forecast, by Country 2020 & 2033
- Table 60: Global Power Sequencers Volume K Forecast, by Country 2020 & 2033
- Table 61: Turkey Power Sequencers Revenue (billion) Forecast, by Application 2020 & 2033
- Table 62: Turkey Power Sequencers Volume (K) Forecast, by Application 2020 & 2033
- Table 63: Israel Power Sequencers Revenue (billion) Forecast, by Application 2020 & 2033
- Table 64: Israel Power Sequencers Volume (K) Forecast, by Application 2020 & 2033
- Table 65: GCC Power Sequencers Revenue (billion) Forecast, by Application 2020 & 2033
- Table 66: GCC Power Sequencers Volume (K) Forecast, by Application 2020 & 2033
- Table 67: North Africa Power Sequencers Revenue (billion) Forecast, by Application 2020 & 2033
- Table 68: North Africa Power Sequencers Volume (K) Forecast, by Application 2020 & 2033
- Table 69: South Africa Power Sequencers Revenue (billion) Forecast, by Application 2020 & 2033
- Table 70: South Africa Power Sequencers Volume (K) Forecast, by Application 2020 & 2033
- Table 71: Rest of Middle East & Africa Power Sequencers Revenue (billion) Forecast, by Application 2020 & 2033
- Table 72: Rest of Middle East & Africa Power Sequencers Volume (K) Forecast, by Application 2020 & 2033
- Table 73: Global Power Sequencers Revenue billion Forecast, by Application 2020 & 2033
- Table 74: Global Power Sequencers Volume K Forecast, by Application 2020 & 2033
- Table 75: Global Power Sequencers Revenue billion Forecast, by Types 2020 & 2033
- Table 76: Global Power Sequencers Volume K Forecast, by Types 2020 & 2033
- Table 77: Global Power Sequencers Revenue billion Forecast, by Country 2020 & 2033
- Table 78: Global Power Sequencers Volume K Forecast, by Country 2020 & 2033
- Table 79: China Power Sequencers Revenue (billion) Forecast, by Application 2020 & 2033
- Table 80: China Power Sequencers Volume (K) Forecast, by Application 2020 & 2033
- Table 81: India Power Sequencers Revenue (billion) Forecast, by Application 2020 & 2033
- Table 82: India Power Sequencers Volume (K) Forecast, by Application 2020 & 2033
- Table 83: Japan Power Sequencers Revenue (billion) Forecast, by Application 2020 & 2033
- Table 84: Japan Power Sequencers Volume (K) Forecast, by Application 2020 & 2033
- Table 85: South Korea Power Sequencers Revenue (billion) Forecast, by Application 2020 & 2033
- Table 86: South Korea Power Sequencers Volume (K) Forecast, by Application 2020 & 2033
- Table 87: ASEAN Power Sequencers Revenue (billion) Forecast, by Application 2020 & 2033
- Table 88: ASEAN Power Sequencers Volume (K) Forecast, by Application 2020 & 2033
- Table 89: Oceania Power Sequencers Revenue (billion) Forecast, by Application 2020 & 2033
- Table 90: Oceania Power Sequencers Volume (K) Forecast, by Application 2020 & 2033
- Table 91: Rest of Asia Pacific Power Sequencers Revenue (billion) Forecast, by Application 2020 & 2033
- Table 92: Rest of Asia Pacific Power Sequencers Volume (K) Forecast, by Application 2020 & 2033
Frequently Asked Questions
1. What is the projected Compound Annual Growth Rate (CAGR) of the Power Sequencers?
The projected CAGR is approximately 9.82%.
2. Which companies are prominent players in the Power Sequencers?
Key companies in the market include TI, Dialog Semiconductor, Analog Devices, Renesas Electronics, STMicroelectronics, Infineon Technologies, NXP Semiconductors.
3. What are the main segments of the Power Sequencers?
The market segments include Application, Types.
4. Can you provide details about the market size?
The market size is estimated to be USD 12.46 billion as of 2022.
5. What are some drivers contributing to market growth?
N/A
6. What are the notable trends driving market growth?
N/A
7. Are there any restraints impacting market growth?
N/A
8. Can you provide examples of recent developments in the market?
N/A
9. What pricing options are available for accessing the report?
Pricing options include single-user, multi-user, and enterprise licenses priced at USD 3950.00, USD 5925.00, and USD 7900.00 respectively.
10. Is the market size provided in terms of value or volume?
The market size is provided in terms of value, measured in billion and volume, measured in K.
11. Are there any specific market keywords associated with the report?
Yes, the market keyword associated with the report is "Power Sequencers," which aids in identifying and referencing the specific market segment covered.
12. How do I determine which pricing option suits my needs best?
The pricing options vary based on user requirements and access needs. Individual users may opt for single-user licenses, while businesses requiring broader access may choose multi-user or enterprise licenses for cost-effective access to the report.
13. Are there any additional resources or data provided in the Power Sequencers report?
While the report offers comprehensive insights, it's advisable to review the specific contents or supplementary materials provided to ascertain if additional resources or data are available.
14. How can I stay updated on further developments or reports in the Power Sequencers?
To stay informed about further developments, trends, and reports in the Power Sequencers, consider subscribing to industry newsletters, following relevant companies and organizations, or regularly checking reputable industry news sources and publications.
Methodology
Step 1 - Identification of Relevant Samples Size from Population Database


Step 2 - Approaches for Defining Global Market Size (Value, Volume* & Price*)

Note*: In applicable scenarios
Step 3 - Data Sources
Primary Research
- Web Analytics
- Survey Reports
- Research Institute
- Latest Research Reports
- Opinion Leaders
Secondary Research
- Annual Reports
- White Paper
- Latest Press Release
- Industry Association
- Paid Database
- Investor Presentations

Step 4 - Data Triangulation
Involves using different sources of information in order to increase the validity of a study
These sources are likely to be stakeholders in a program - participants, other researchers, program staff, other community members, and so on.
Then we put all data in single framework & apply various statistical tools to find out the dynamic on the market.
During the analysis stage, feedback from the stakeholder groups would be compared to determine areas of agreement as well as areas of divergence