

Key Insights
The global portable viscometer market is poised for significant expansion, projected to reach $58.3 million by 2025 and grow at a Compound Annual Growth Rate (CAGR) of 4.9% throughout the forecast period of 2025-2033. This robust growth is primarily fueled by the increasing demand for real-time quality control and process optimization across diverse industries, including the food, chemical, and petroleum sectors. The inherent portability and ease of use of these devices allow for on-site viscosity measurements, crucial for ensuring product consistency, safety, and efficiency. Advancements in sensor technology and miniaturization are further driving innovation, leading to more accurate, versatile, and cost-effective portable viscometer solutions. The rising adoption of automation in manufacturing processes also necessitates precise and readily available viscosity data, reinforcing the market's upward trajectory.
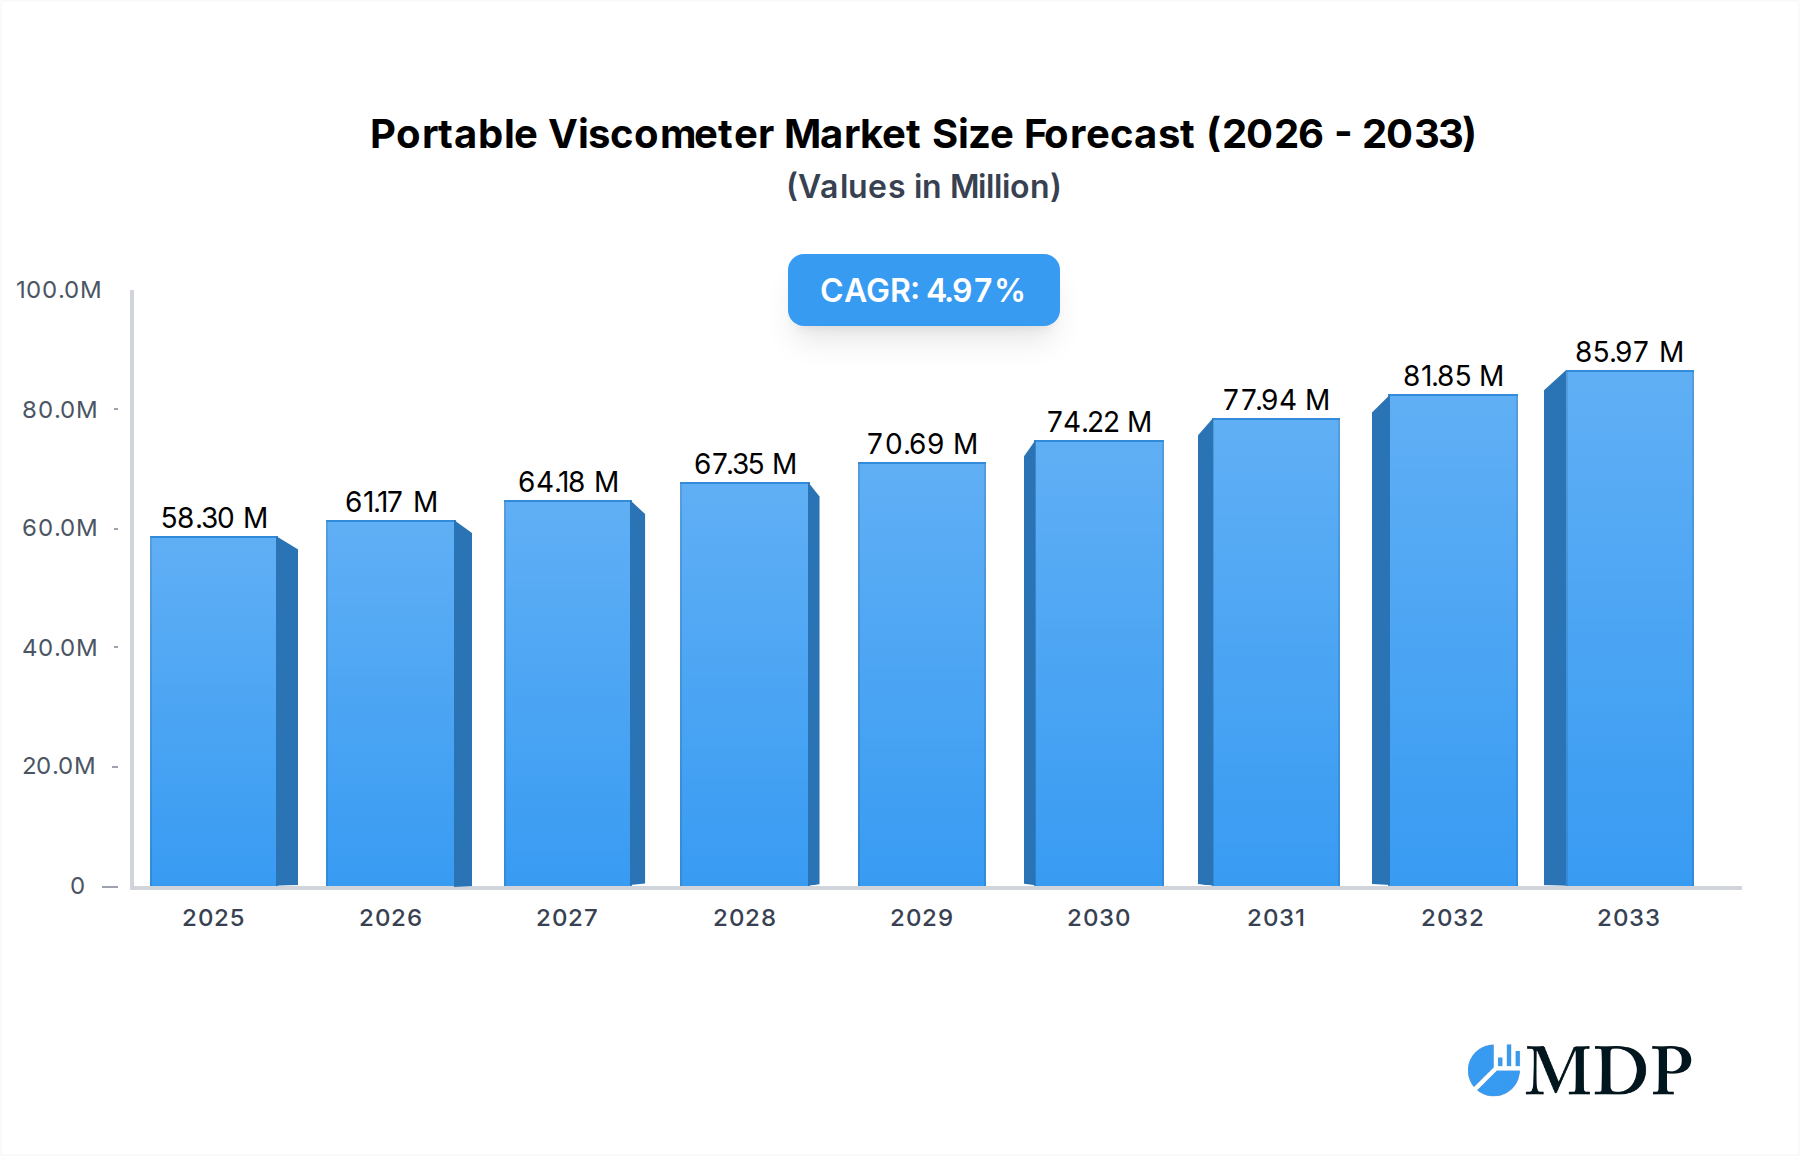
Portable Viscometer Market Size (In Million)
The market segmentation reveals a strong emphasis on both application and type. Within applications, the Food Industry stands out as a key growth area, driven by stringent quality standards and the need for precise rheological characterization of food products. The Chemical and Petroleum industries also represent substantial markets, where viscosity plays a critical role in fluid handling, processing, and product formulation. From a technological standpoint, Tube Type viscometers are expected to maintain a significant market share due to their established reliability, while Rotary Type and Vibrating Type viscometers are gaining traction with their ability to handle a wider range of sample viscosities and provide more dynamic rheological data. Key players such as Anton Paar, PAC, and Toki are actively investing in research and development to introduce next-generation portable viscometers, further stimulating market competition and innovation.

Portable Viscometer Company Market Share
This comprehensive report provides an in-depth analysis of the global Portable Viscometer market, offering invaluable insights for industry stakeholders. From market dynamics and key trends to leading players and future opportunities, this report equips you with actionable intelligence to navigate this evolving landscape. Our study spans the historical period of 2019–2024, with a base year of 2025 and an extensive forecast period extending to 2033, ensuring a robust understanding of market trajectories. With an estimated market size of xx million in 2025, projected to reach xx million by 2033, and a compound annual growth rate (CAGR) of xx% during the forecast period, this report captures the significant growth potential of portable viscometers.
Portable Viscometer Market Dynamics & Concentration
The portable viscometer market exhibits a moderate to high concentration, with a handful of key players dominating a significant portion of the market share, estimated at xx%. Innovation drivers are primarily centered around enhancing portability, accuracy, ease of use, and data connectivity for real-time analysis. Regulatory frameworks, particularly in industries like food and pharmaceuticals, are increasingly demanding stringent quality control, indirectly boosting the adoption of advanced viscometry tools. Product substitutes, while present in the form of benchtop viscometers, are less conducive to on-site or field testing, thus creating a distinct market for portable solutions. End-user trends show a strong preference for user-friendly interfaces, wireless data transfer capabilities, and robust designs suitable for harsh environments. Merger and acquisition (M&A) activities, while not consistently high, have played a role in market consolidation, with an estimated xx significant M&A deals recorded in the historical period.
Portable Viscometer Industry Trends & Analysis
The portable viscometer industry is experiencing robust growth, propelled by several key market growth drivers. The escalating demand for precise fluid property characterization across diverse sectors, including the Food Industry, Chemical Industry, and Petroleum Industry, underpins this expansion. Technological advancements are revolutionizing the sector, with the integration of IoT capabilities, advanced sensor technologies, and AI-powered data analysis enabling more sophisticated and efficient viscosity measurements. This surge in technological disruption is leading to a higher market penetration of smart and connected portable viscometers. Consumer preferences are shifting towards devices offering greater portability, faster measurement times, and enhanced accuracy, catering to the need for rapid on-site quality control and process optimization. Competitive dynamics are characterized by continuous product innovation, strategic partnerships, and aggressive market penetration strategies by leading manufacturers. The global market size, estimated at xx million in 2025, is projected to experience a CAGR of xx% during the forecast period of 2025–2033, reaching xx million by 2033. This growth is fueled by the increasing need for real-time viscosity data in research and development, manufacturing, and quality assurance processes. The market penetration of portable viscometers is expected to rise significantly as industries recognize their cost-effectiveness and operational advantages over traditional methods.
Leading Markets & Segments in Portable Viscometer
The Chemical Industry stands as the dominant region/segment in the portable viscometer market, driven by its extensive use in research, development, and quality control of a vast array of chemical products. Within the chemical sector, the dominance is further fueled by its application in paints, coatings, adhesives, polymers, and specialty chemicals, where precise viscosity control is paramount for product performance and consistency. The Petroleum Industry also presents a significant market, particularly in upstream exploration, refining, and downstream distribution, where the viscosity of crude oil, lubricants, and fuels directly impacts operational efficiency and product quality.
The Food Industry is another critical segment, with portable viscometers essential for ensuring the consistency and texture of products like sauces, dairy, confectionery, and beverages. The increasing focus on food safety and quality standards further propels adoption.
Regarding product types, the Rotary Type viscometers are widely adopted due to their versatility and accuracy across a broad range of viscosities and shear rates. However, the Tube Type and Vibrating Type viscometers are gaining traction for specific applications, offering advantages in terms of cost-effectiveness, portability, and ease of use in certain environments.
Key Drivers of Dominance in the Chemical Industry:
- Strict quality control mandates for chemical formulations.
- The need for precise rheological characterization in R&D and production.
- Applications in complex fluid systems like emulsions and suspensions.
Key Drivers of Dominance in the Petroleum Industry:
- Critical role of viscosity in drilling fluids, lubricants, and fuels.
- On-site testing requirements in remote exploration and production sites.
- Adherence to international standards for petroleum product quality.
Key Drivers of Dominance in the Food Industry:
- Ensuring consistent texture, mouthfeel, and flow properties.
- Compliance with food safety and regulatory standards.
- Application in process monitoring and product development.
The market size for portable viscometers within the Chemical Industry is estimated at xx million in 2025, while the Food Industry is expected to reach xx million, and the Petroleum Industry xx million. The Rotary Type segment is projected to hold the largest market share, valued at xx million in 2025.
Portable Viscometer Product Developments
Recent product developments in the portable viscometer market focus on miniaturization, enhanced connectivity, and increased user-friendliness. Manufacturers are introducing smart devices with integrated Bluetooth and Wi-Fi capabilities for seamless data transfer to cloud platforms and mobile applications. Innovations in sensor technology are leading to greater accuracy and wider measurement ranges in compact form factors. The emphasis is on providing real-time viscosity data and rheological profiles directly at the point of use, thereby streamlining quality control processes, reducing sampling errors, and enabling immediate adjustments in manufacturing. These advancements offer significant competitive advantages by improving operational efficiency and product consistency for end-users.
Key Drivers of Portable Viscometer Growth
The growth of the portable viscometer market is primarily driven by the increasing demand for precise and on-site fluid characterization across various industries. Technological advancements, such as miniaturization, improved sensor accuracy, and the integration of IoT capabilities, are making portable viscometers more accessible and efficient. Economic factors, including the growing emphasis on quality control and process optimization to reduce production costs and waste, also contribute significantly. Furthermore, evolving regulatory landscapes in sectors like food and pharmaceuticals necessitate rigorous viscosity testing, indirectly bolstering the market. The rising need for real-time data acquisition in research and development further fuels the adoption of these versatile instruments.
Challenges in the Portable Viscometer Market
Despite the positive growth trajectory, the portable viscometer market faces several challenges. Regulatory hurdles, particularly in highly regulated industries, can slow down the adoption of new technologies or require extensive validation processes, costing an estimated xx million in delayed market entry. Supply chain issues, including the availability of specialized components and geopolitical uncertainties, can lead to increased lead times and manufacturing costs. Competitive pressures from both established players and emerging manufacturers intensify, demanding continuous innovation and competitive pricing strategies, potentially impacting profit margins by xx%. High initial investment costs for advanced portable viscometers can also be a restraint for small and medium-sized enterprises.
Emerging Opportunities in Portable Viscometer
Emerging opportunities in the portable viscometer market are abundant, driven by ongoing technological breakthroughs and evolving industry needs. The increasing demand for automation and Industry 4.0 integration presents a significant catalyst for growth, with portable viscometers poised to become integral components of smart manufacturing ecosystems. Strategic partnerships between viscometer manufacturers and software developers can lead to enhanced data analytics platforms, offering deeper insights into fluid behavior. Furthermore, expanding applications in niche sectors like cosmetics, biotechnology, and advanced materials science offer substantial market expansion potential, valued at an estimated xx million in untapped markets. The development of highly specialized portable viscometers for extreme conditions (e.g., high temperature, high pressure) also represents a promising avenue.
Leading Players in the Portable Viscometer Sector
- Anton Paar
- PAC
- Toki
- ProRheo
- Hydramotion
- Lamy Rheology
- Lemis Baltic
- RheoSense
- Vindum
Key Milestones in Portable Viscometer Industry
- 2019: Launch of highly miniaturized digital viscometers with enhanced battery life.
- 2020: Increased integration of Bluetooth and Wi-Fi connectivity for wireless data transfer.
- 2021: Introduction of AI-powered algorithms for automated viscosity analysis and prediction.
- 2022: Significant advancements in sensor technology leading to improved accuracy in diverse fluid types.
- 2023: Growing adoption of cloud-based data management solutions for portable viscometer users.
- 2024: Emergence of predictive maintenance features integrated into portable viscometer software.
Strategic Outlook for Portable Viscometer Market
The strategic outlook for the portable viscometer market is exceptionally positive, driven by the persistent need for on-site, real-time viscosity measurements across a widening array of industries. The future will likely see increased integration of artificial intelligence and machine learning for advanced data interpretation and predictive analytics, creating significant value for end-users. The ongoing trend towards smart manufacturing and the Internet of Things will further propel the demand for connected portable viscometers. Strategic opportunities lie in developing tailored solutions for emerging applications and expanding into developing markets, capitalizing on their growing industrialization and focus on quality control. The market is poised for sustained growth, with innovation and strategic collaborations being key accelerators.
Portable Viscometer Segmentation
-
1. Application
- 1.1. Food Industry
- 1.2. Chemical Industry
- 1.3. Petroleum Industry
- 1.4. Other
-
2. Type
- 2.1. Tube Type
- 2.2. Rotary Type
- 2.3. Vibrating Type
Portable Viscometer Segmentation By Geography
-
1. North America
- 1.1. United States
- 1.2. Canada
- 1.3. Mexico
-
2. South America
- 2.1. Brazil
- 2.2. Argentina
- 2.3. Rest of South America
-
3. Europe
- 3.1. United Kingdom
- 3.2. Germany
- 3.3. France
- 3.4. Italy
- 3.5. Spain
- 3.6. Russia
- 3.7. Benelux
- 3.8. Nordics
- 3.9. Rest of Europe
-
4. Middle East & Africa
- 4.1. Turkey
- 4.2. Israel
- 4.3. GCC
- 4.4. North Africa
- 4.5. South Africa
- 4.6. Rest of Middle East & Africa
-
5. Asia Pacific
- 5.1. China
- 5.2. India
- 5.3. Japan
- 5.4. South Korea
- 5.5. ASEAN
- 5.6. Oceania
- 5.7. Rest of Asia Pacific
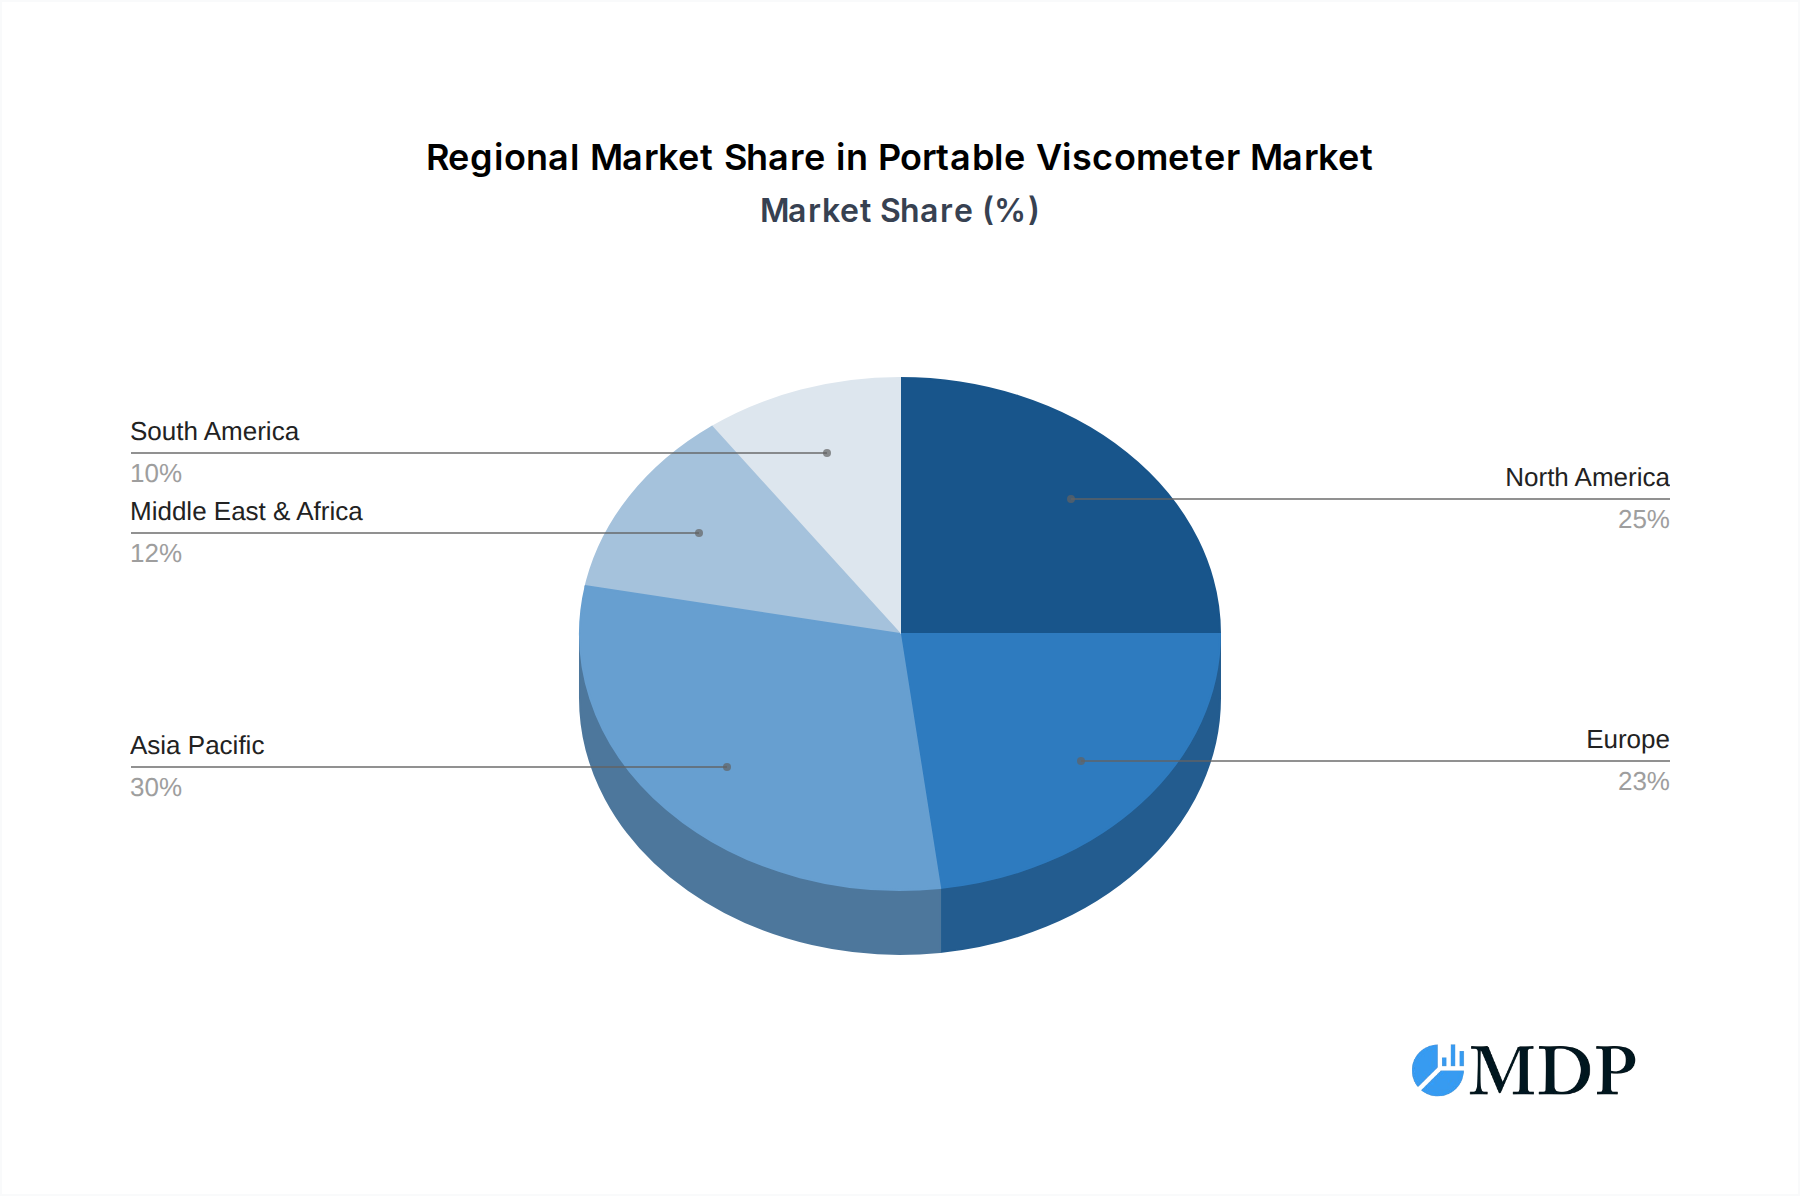
Portable Viscometer Regional Market Share
Geographic Coverage of Portable Viscometer
Portable Viscometer REPORT HIGHLIGHTS
| Aspects | Details |
|---|---|
| Study Period | 2020-2034 |
| Base Year | 2025 |
| Estimated Year | 2026 |
| Forecast Period | 2026-2034 |
| Historical Period | 2020-2025 |
| Growth Rate | CAGR of 4.9% from 2020-2034 |
| Segmentation |
|
Table of Contents
- 1. Introduction
- 1.1. Research Scope
- 1.2. Market Segmentation
- 1.3. Research Methodology
- 1.4. Definitions and Assumptions
- 2. Executive Summary
- 2.1. Introduction
- 3. Market Dynamics
- 3.1. Introduction
- 3.2. Market Drivers
- 3.3. Market Restrains
- 3.4. Market Trends
- 4. Market Factor Analysis
- 4.1. Porters Five Forces
- 4.2. Supply/Value Chain
- 4.3. PESTEL analysis
- 4.4. Market Entropy
- 4.5. Patent/Trademark Analysis
- 5. Global Portable Viscometer Analysis, Insights and Forecast, 2020-2032
- 5.1. Market Analysis, Insights and Forecast - by Application
- 5.1.1. Food Industry
- 5.1.2. Chemical Industry
- 5.1.3. Petroleum Industry
- 5.1.4. Other
- 5.2. Market Analysis, Insights and Forecast - by Type
- 5.2.1. Tube Type
- 5.2.2. Rotary Type
- 5.2.3. Vibrating Type
- 5.3. Market Analysis, Insights and Forecast - by Region
- 5.3.1. North America
- 5.3.2. South America
- 5.3.3. Europe
- 5.3.4. Middle East & Africa
- 5.3.5. Asia Pacific
- 5.1. Market Analysis, Insights and Forecast - by Application
- 6. North America Portable Viscometer Analysis, Insights and Forecast, 2020-2032
- 6.1. Market Analysis, Insights and Forecast - by Application
- 6.1.1. Food Industry
- 6.1.2. Chemical Industry
- 6.1.3. Petroleum Industry
- 6.1.4. Other
- 6.2. Market Analysis, Insights and Forecast - by Type
- 6.2.1. Tube Type
- 6.2.2. Rotary Type
- 6.2.3. Vibrating Type
- 6.1. Market Analysis, Insights and Forecast - by Application
- 7. South America Portable Viscometer Analysis, Insights and Forecast, 2020-2032
- 7.1. Market Analysis, Insights and Forecast - by Application
- 7.1.1. Food Industry
- 7.1.2. Chemical Industry
- 7.1.3. Petroleum Industry
- 7.1.4. Other
- 7.2. Market Analysis, Insights and Forecast - by Type
- 7.2.1. Tube Type
- 7.2.2. Rotary Type
- 7.2.3. Vibrating Type
- 7.1. Market Analysis, Insights and Forecast - by Application
- 8. Europe Portable Viscometer Analysis, Insights and Forecast, 2020-2032
- 8.1. Market Analysis, Insights and Forecast - by Application
- 8.1.1. Food Industry
- 8.1.2. Chemical Industry
- 8.1.3. Petroleum Industry
- 8.1.4. Other
- 8.2. Market Analysis, Insights and Forecast - by Type
- 8.2.1. Tube Type
- 8.2.2. Rotary Type
- 8.2.3. Vibrating Type
- 8.1. Market Analysis, Insights and Forecast - by Application
- 9. Middle East & Africa Portable Viscometer Analysis, Insights and Forecast, 2020-2032
- 9.1. Market Analysis, Insights and Forecast - by Application
- 9.1.1. Food Industry
- 9.1.2. Chemical Industry
- 9.1.3. Petroleum Industry
- 9.1.4. Other
- 9.2. Market Analysis, Insights and Forecast - by Type
- 9.2.1. Tube Type
- 9.2.2. Rotary Type
- 9.2.3. Vibrating Type
- 9.1. Market Analysis, Insights and Forecast - by Application
- 10. Asia Pacific Portable Viscometer Analysis, Insights and Forecast, 2020-2032
- 10.1. Market Analysis, Insights and Forecast - by Application
- 10.1.1. Food Industry
- 10.1.2. Chemical Industry
- 10.1.3. Petroleum Industry
- 10.1.4. Other
- 10.2. Market Analysis, Insights and Forecast - by Type
- 10.2.1. Tube Type
- 10.2.2. Rotary Type
- 10.2.3. Vibrating Type
- 10.1. Market Analysis, Insights and Forecast - by Application
- 11. Competitive Analysis
- 11.1. Global Market Share Analysis 2025
- 11.2. Company Profiles
- 11.2.1 Anton Paar
- 11.2.1.1. Overview
- 11.2.1.2. Products
- 11.2.1.3. SWOT Analysis
- 11.2.1.4. Recent Developments
- 11.2.1.5. Financials (Based on Availability)
- 11.2.2 PAC
- 11.2.2.1. Overview
- 11.2.2.2. Products
- 11.2.2.3. SWOT Analysis
- 11.2.2.4. Recent Developments
- 11.2.2.5. Financials (Based on Availability)
- 11.2.3 Toki
- 11.2.3.1. Overview
- 11.2.3.2. Products
- 11.2.3.3. SWOT Analysis
- 11.2.3.4. Recent Developments
- 11.2.3.5. Financials (Based on Availability)
- 11.2.4 ProRheo
- 11.2.4.1. Overview
- 11.2.4.2. Products
- 11.2.4.3. SWOT Analysis
- 11.2.4.4. Recent Developments
- 11.2.4.5. Financials (Based on Availability)
- 11.2.5 Hydramotion
- 11.2.5.1. Overview
- 11.2.5.2. Products
- 11.2.5.3. SWOT Analysis
- 11.2.5.4. Recent Developments
- 11.2.5.5. Financials (Based on Availability)
- 11.2.6 Lamy Rheology
- 11.2.6.1. Overview
- 11.2.6.2. Products
- 11.2.6.3. SWOT Analysis
- 11.2.6.4. Recent Developments
- 11.2.6.5. Financials (Based on Availability)
- 11.2.7 Lemis Baltic
- 11.2.7.1. Overview
- 11.2.7.2. Products
- 11.2.7.3. SWOT Analysis
- 11.2.7.4. Recent Developments
- 11.2.7.5. Financials (Based on Availability)
- 11.2.8 RheoSense
- 11.2.8.1. Overview
- 11.2.8.2. Products
- 11.2.8.3. SWOT Analysis
- 11.2.8.4. Recent Developments
- 11.2.8.5. Financials (Based on Availability)
- 11.2.9 Vindum
- 11.2.9.1. Overview
- 11.2.9.2. Products
- 11.2.9.3. SWOT Analysis
- 11.2.9.4. Recent Developments
- 11.2.9.5. Financials (Based on Availability)
- 11.2.1 Anton Paar
List of Figures
- Figure 1: Global Portable Viscometer Revenue Breakdown (million, %) by Region 2025 & 2033
- Figure 2: North America Portable Viscometer Revenue (million), by Application 2025 & 2033
- Figure 3: North America Portable Viscometer Revenue Share (%), by Application 2025 & 2033
- Figure 4: North America Portable Viscometer Revenue (million), by Type 2025 & 2033
- Figure 5: North America Portable Viscometer Revenue Share (%), by Type 2025 & 2033
- Figure 6: North America Portable Viscometer Revenue (million), by Country 2025 & 2033
- Figure 7: North America Portable Viscometer Revenue Share (%), by Country 2025 & 2033
- Figure 8: South America Portable Viscometer Revenue (million), by Application 2025 & 2033
- Figure 9: South America Portable Viscometer Revenue Share (%), by Application 2025 & 2033
- Figure 10: South America Portable Viscometer Revenue (million), by Type 2025 & 2033
- Figure 11: South America Portable Viscometer Revenue Share (%), by Type 2025 & 2033
- Figure 12: South America Portable Viscometer Revenue (million), by Country 2025 & 2033
- Figure 13: South America Portable Viscometer Revenue Share (%), by Country 2025 & 2033
- Figure 14: Europe Portable Viscometer Revenue (million), by Application 2025 & 2033
- Figure 15: Europe Portable Viscometer Revenue Share (%), by Application 2025 & 2033
- Figure 16: Europe Portable Viscometer Revenue (million), by Type 2025 & 2033
- Figure 17: Europe Portable Viscometer Revenue Share (%), by Type 2025 & 2033
- Figure 18: Europe Portable Viscometer Revenue (million), by Country 2025 & 2033
- Figure 19: Europe Portable Viscometer Revenue Share (%), by Country 2025 & 2033
- Figure 20: Middle East & Africa Portable Viscometer Revenue (million), by Application 2025 & 2033
- Figure 21: Middle East & Africa Portable Viscometer Revenue Share (%), by Application 2025 & 2033
- Figure 22: Middle East & Africa Portable Viscometer Revenue (million), by Type 2025 & 2033
- Figure 23: Middle East & Africa Portable Viscometer Revenue Share (%), by Type 2025 & 2033
- Figure 24: Middle East & Africa Portable Viscometer Revenue (million), by Country 2025 & 2033
- Figure 25: Middle East & Africa Portable Viscometer Revenue Share (%), by Country 2025 & 2033
- Figure 26: Asia Pacific Portable Viscometer Revenue (million), by Application 2025 & 2033
- Figure 27: Asia Pacific Portable Viscometer Revenue Share (%), by Application 2025 & 2033
- Figure 28: Asia Pacific Portable Viscometer Revenue (million), by Type 2025 & 2033
- Figure 29: Asia Pacific Portable Viscometer Revenue Share (%), by Type 2025 & 2033
- Figure 30: Asia Pacific Portable Viscometer Revenue (million), by Country 2025 & 2033
- Figure 31: Asia Pacific Portable Viscometer Revenue Share (%), by Country 2025 & 2033
List of Tables
- Table 1: Global Portable Viscometer Revenue million Forecast, by Application 2020 & 2033
- Table 2: Global Portable Viscometer Revenue million Forecast, by Type 2020 & 2033
- Table 3: Global Portable Viscometer Revenue million Forecast, by Region 2020 & 2033
- Table 4: Global Portable Viscometer Revenue million Forecast, by Application 2020 & 2033
- Table 5: Global Portable Viscometer Revenue million Forecast, by Type 2020 & 2033
- Table 6: Global Portable Viscometer Revenue million Forecast, by Country 2020 & 2033
- Table 7: United States Portable Viscometer Revenue (million) Forecast, by Application 2020 & 2033
- Table 8: Canada Portable Viscometer Revenue (million) Forecast, by Application 2020 & 2033
- Table 9: Mexico Portable Viscometer Revenue (million) Forecast, by Application 2020 & 2033
- Table 10: Global Portable Viscometer Revenue million Forecast, by Application 2020 & 2033
- Table 11: Global Portable Viscometer Revenue million Forecast, by Type 2020 & 2033
- Table 12: Global Portable Viscometer Revenue million Forecast, by Country 2020 & 2033
- Table 13: Brazil Portable Viscometer Revenue (million) Forecast, by Application 2020 & 2033
- Table 14: Argentina Portable Viscometer Revenue (million) Forecast, by Application 2020 & 2033
- Table 15: Rest of South America Portable Viscometer Revenue (million) Forecast, by Application 2020 & 2033
- Table 16: Global Portable Viscometer Revenue million Forecast, by Application 2020 & 2033
- Table 17: Global Portable Viscometer Revenue million Forecast, by Type 2020 & 2033
- Table 18: Global Portable Viscometer Revenue million Forecast, by Country 2020 & 2033
- Table 19: United Kingdom Portable Viscometer Revenue (million) Forecast, by Application 2020 & 2033
- Table 20: Germany Portable Viscometer Revenue (million) Forecast, by Application 2020 & 2033
- Table 21: France Portable Viscometer Revenue (million) Forecast, by Application 2020 & 2033
- Table 22: Italy Portable Viscometer Revenue (million) Forecast, by Application 2020 & 2033
- Table 23: Spain Portable Viscometer Revenue (million) Forecast, by Application 2020 & 2033
- Table 24: Russia Portable Viscometer Revenue (million) Forecast, by Application 2020 & 2033
- Table 25: Benelux Portable Viscometer Revenue (million) Forecast, by Application 2020 & 2033
- Table 26: Nordics Portable Viscometer Revenue (million) Forecast, by Application 2020 & 2033
- Table 27: Rest of Europe Portable Viscometer Revenue (million) Forecast, by Application 2020 & 2033
- Table 28: Global Portable Viscometer Revenue million Forecast, by Application 2020 & 2033
- Table 29: Global Portable Viscometer Revenue million Forecast, by Type 2020 & 2033
- Table 30: Global Portable Viscometer Revenue million Forecast, by Country 2020 & 2033
- Table 31: Turkey Portable Viscometer Revenue (million) Forecast, by Application 2020 & 2033
- Table 32: Israel Portable Viscometer Revenue (million) Forecast, by Application 2020 & 2033
- Table 33: GCC Portable Viscometer Revenue (million) Forecast, by Application 2020 & 2033
- Table 34: North Africa Portable Viscometer Revenue (million) Forecast, by Application 2020 & 2033
- Table 35: South Africa Portable Viscometer Revenue (million) Forecast, by Application 2020 & 2033
- Table 36: Rest of Middle East & Africa Portable Viscometer Revenue (million) Forecast, by Application 2020 & 2033
- Table 37: Global Portable Viscometer Revenue million Forecast, by Application 2020 & 2033
- Table 38: Global Portable Viscometer Revenue million Forecast, by Type 2020 & 2033
- Table 39: Global Portable Viscometer Revenue million Forecast, by Country 2020 & 2033
- Table 40: China Portable Viscometer Revenue (million) Forecast, by Application 2020 & 2033
- Table 41: India Portable Viscometer Revenue (million) Forecast, by Application 2020 & 2033
- Table 42: Japan Portable Viscometer Revenue (million) Forecast, by Application 2020 & 2033
- Table 43: South Korea Portable Viscometer Revenue (million) Forecast, by Application 2020 & 2033
- Table 44: ASEAN Portable Viscometer Revenue (million) Forecast, by Application 2020 & 2033
- Table 45: Oceania Portable Viscometer Revenue (million) Forecast, by Application 2020 & 2033
- Table 46: Rest of Asia Pacific Portable Viscometer Revenue (million) Forecast, by Application 2020 & 2033
Frequently Asked Questions
1. What is the projected Compound Annual Growth Rate (CAGR) of the Portable Viscometer?
The projected CAGR is approximately 4.9%.
2. Which companies are prominent players in the Portable Viscometer?
Key companies in the market include Anton Paar, PAC, Toki, ProRheo, Hydramotion, Lamy Rheology, Lemis Baltic, RheoSense, Vindum.
3. What are the main segments of the Portable Viscometer?
The market segments include Application, Type.
4. Can you provide details about the market size?
The market size is estimated to be USD 58.3 million as of 2022.
5. What are some drivers contributing to market growth?
N/A
6. What are the notable trends driving market growth?
N/A
7. Are there any restraints impacting market growth?
N/A
8. Can you provide examples of recent developments in the market?
N/A
9. What pricing options are available for accessing the report?
Pricing options include single-user, multi-user, and enterprise licenses priced at USD 2900.00, USD 4350.00, and USD 5800.00 respectively.
10. Is the market size provided in terms of value or volume?
The market size is provided in terms of value, measured in million.
11. Are there any specific market keywords associated with the report?
Yes, the market keyword associated with the report is "Portable Viscometer," which aids in identifying and referencing the specific market segment covered.
12. How do I determine which pricing option suits my needs best?
The pricing options vary based on user requirements and access needs. Individual users may opt for single-user licenses, while businesses requiring broader access may choose multi-user or enterprise licenses for cost-effective access to the report.
13. Are there any additional resources or data provided in the Portable Viscometer report?
While the report offers comprehensive insights, it's advisable to review the specific contents or supplementary materials provided to ascertain if additional resources or data are available.
14. How can I stay updated on further developments or reports in the Portable Viscometer?
To stay informed about further developments, trends, and reports in the Portable Viscometer, consider subscribing to industry newsletters, following relevant companies and organizations, or regularly checking reputable industry news sources and publications.
Methodology
Step 1 - Identification of Relevant Samples Size from Population Database


Step 2 - Approaches for Defining Global Market Size (Value, Volume* & Price*)

Note*: In applicable scenarios
Step 3 - Data Sources
Primary Research
- Web Analytics
- Survey Reports
- Research Institute
- Latest Research Reports
- Opinion Leaders
Secondary Research
- Annual Reports
- White Paper
- Latest Press Release
- Industry Association
- Paid Database
- Investor Presentations

Step 4 - Data Triangulation
Involves using different sources of information in order to increase the validity of a study
These sources are likely to be stakeholders in a program - participants, other researchers, program staff, other community members, and so on.
Then we put all data in single framework & apply various statistical tools to find out the dynamic on the market.
During the analysis stage, feedback from the stakeholder groups would be compared to determine areas of agreement as well as areas of divergence