

Key Insights
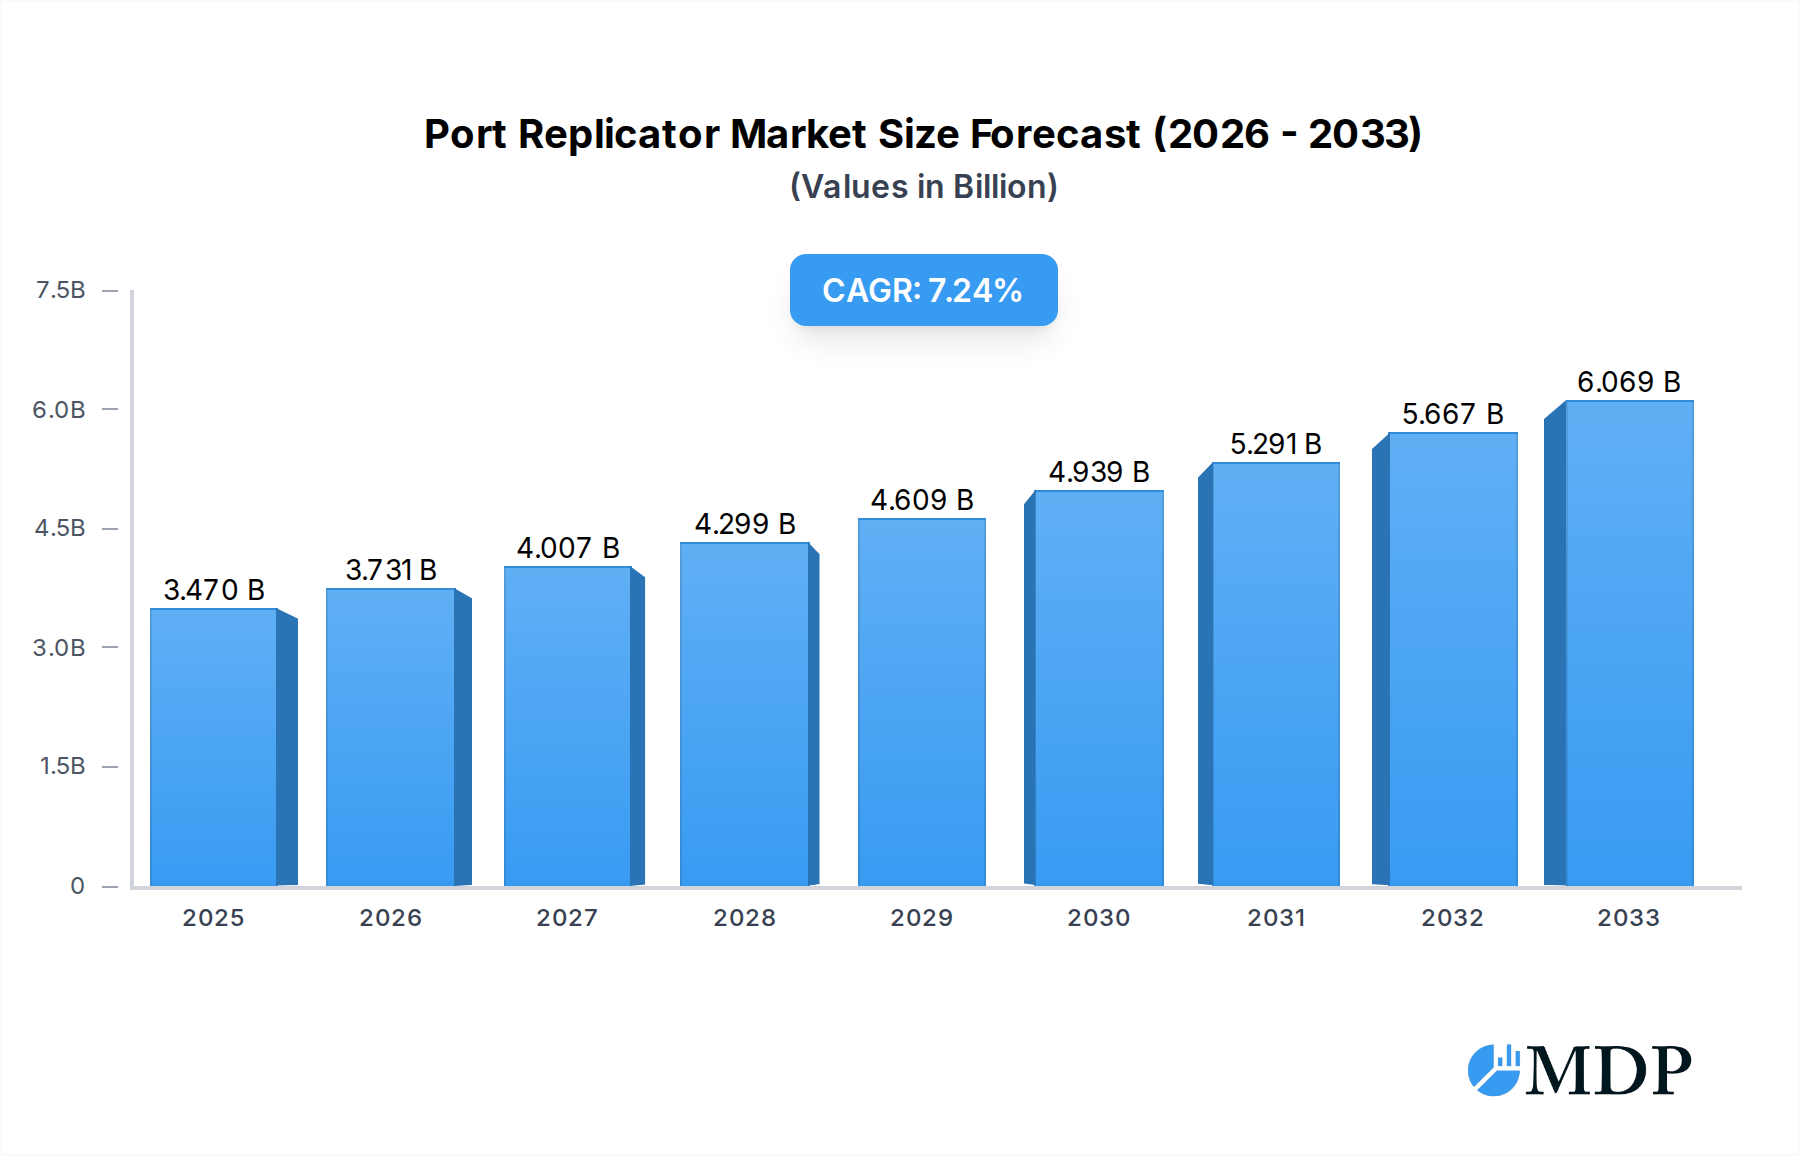
The global Port Replicator market is poised for significant expansion, projected to reach $3.47 billion in 2025. This growth is underpinned by a robust Compound Annual Growth Rate (CAGR) of 7.53% anticipated over the forecast period of 2025-2033. A primary driver for this surge is the increasing demand for seamless connectivity and enhanced productivity, particularly in professional environments. As hybrid work models become more prevalent, businesses are investing in solutions that allow employees to easily transition between home and office setups, connecting multiple peripherals like monitors, keyboards, and external drives with a single cable. This convenience, coupled with the growing adoption of high-resolution displays and the need for faster data transfer speeds, fuels the market's upward trajectory. Furthermore, the proliferation of laptops and ultrabooks, often equipped with limited ports, necessitates the use of port replicators to expand their functionality.

Port Replicator Market Size (In Billion)
The market is strategically segmented to cater to diverse user needs. In terms of application, both Online Sales and Offline Sales channels are expected to witness substantial growth, reflecting the evolving purchasing habits of consumers and businesses. The rising popularity of e-commerce platforms provides convenient access to a wide array of port replicator options, while traditional retail outlets continue to serve customers who prefer in-person evaluation. Type-wise, the USB 3.0 Type segment is anticipated to dominate, driven by its superior data transfer speeds and backward compatibility, essential for modern computing demands. The "Others" category, which likely encompasses Thunderbolt and other advanced connectivity standards, is also expected to see notable expansion as technology advances. Key players like Anker, Lenovo, TOSHIBA, SAMSUNG, and Dell are actively innovating and expanding their product portfolios, contributing to market competitiveness and consumer choice.
Port Replicator Company Market Share
Port Replicator Market Dynamics & Concentration: Unveiling a Billion-Dollar Landscape
The global port replicator market, a sector poised for significant expansion, is characterized by a dynamic interplay of innovation, evolving consumer demands, and a competitive landscape featuring industry titans and agile disruptors. The market's concentration is moderate, with a few key players holding substantial market share, yet offering ample room for emerging companies and niche solutions. Innovation drivers are largely centered around the increasing demand for enhanced connectivity, higher data transfer speeds, and the growing need for versatile docking solutions across professional and personal computing environments. Regulatory frameworks, while generally supportive of technological advancement, can influence product design and compatibility standards, impacting market entry and competitive parity. Product substitutes, such as integrated multi-port solutions on laptops or standalone dongles, present a constant challenge, necessitating continuous product development and differentiation. End-user trends indicate a strong preference for compact, powerful, and universally compatible port replicators that seamlessly integrate with a variety of devices and operating systems. Mergers and acquisitions (M&A) activities within the sector have been a significant factor in shaping market concentration, with strategic consolidations aimed at expanding product portfolios, acquiring innovative technologies, and strengthening market reach. For instance, the period between 2019 and 2024 saw an estimated XX billion in M&A deal counts, with key acquisitions by major technology firms aiming to bolster their connectivity offerings. The market share of leading port replicator manufacturers is currently estimated to be XX billion, with the top five companies collectively holding approximately XX% of the total market value. This dynamic environment underscores the importance of agile strategies and continuous adaptation for sustained growth and market leadership.
Port Replicator Industry Trends & Analysis: Navigating a Billion-Dollar Growth Trajectory
The port replicator industry is experiencing a robust growth trajectory, driven by a confluence of factors that are reshaping the digital workspace and personal computing experience. The fundamental market growth drivers are deeply rooted in the escalating demand for streamlined connectivity solutions in an increasingly interconnected world. As businesses embrace hybrid work models and individuals demand greater flexibility and productivity from their devices, the need for efficient and versatile port replicators has become paramount. This surge in demand is further amplified by the proliferation of ultra-thin laptops and mobile workstations that often feature a limited number of ports, making port replicators an indispensable accessory. Technological disruptions are playing a pivotal role in this evolution. The rapid advancement in USB-C technology, with its high bandwidth, power delivery capabilities, and versatile functionality, has become a cornerstone of modern port replicator design. This has paved the way for multi-functional docks that can support high-resolution displays, fast Ethernet, multiple USB ports, and even memory card readers, all through a single connection. Furthermore, the integration of Thunderbolt 3 and Thunderbolt 4 technologies is pushing the boundaries of data transfer speeds and capabilities, catering to professional users who require uncompromising performance for tasks such as video editing, graphic design, and large data transfers. Consumer preferences are shifting towards more sophisticated, feature-rich, and aesthetically pleasing port replicators. Users are actively seeking solutions that not only enhance productivity but also complement their device ecosystems and desk setups. This has led to a greater emphasis on design, build quality, and software integration, with many manufacturers offering custom driver support and management tools. The competitive dynamics within the port replicator market are intense, with a mix of established technology giants and specialized accessory brands vying for market share. Companies like Dell, HP, Lenovo, and Apple, along with dedicated accessory manufacturers such as Anker, UGREEN, and Satechi, are continuously innovating to capture consumer attention and loyalty. The market penetration of advanced port replicators, particularly those supporting USB-C and Thunderbolt, is projected to grow significantly, reaching an estimated XX% by the end of the forecast period. The Compound Annual Growth Rate (CAGR) for the global port replicator market is projected to be a healthy XX% from 2025 to 2033, indicating a sustained period of expansion and opportunity. This growth is fueled by ongoing technological advancements, increasing adoption rates across diverse user segments, and the continuous innovation pipeline from leading industry players. The market’s evolution is also influenced by the growing trend of device standardization, where a universal docking solution can cater to a wide array of devices, reducing compatibility concerns and simplifying the user experience.
Leading Markets & Segments in Port Replicator: A Billion-Dollar Segmentation Analysis
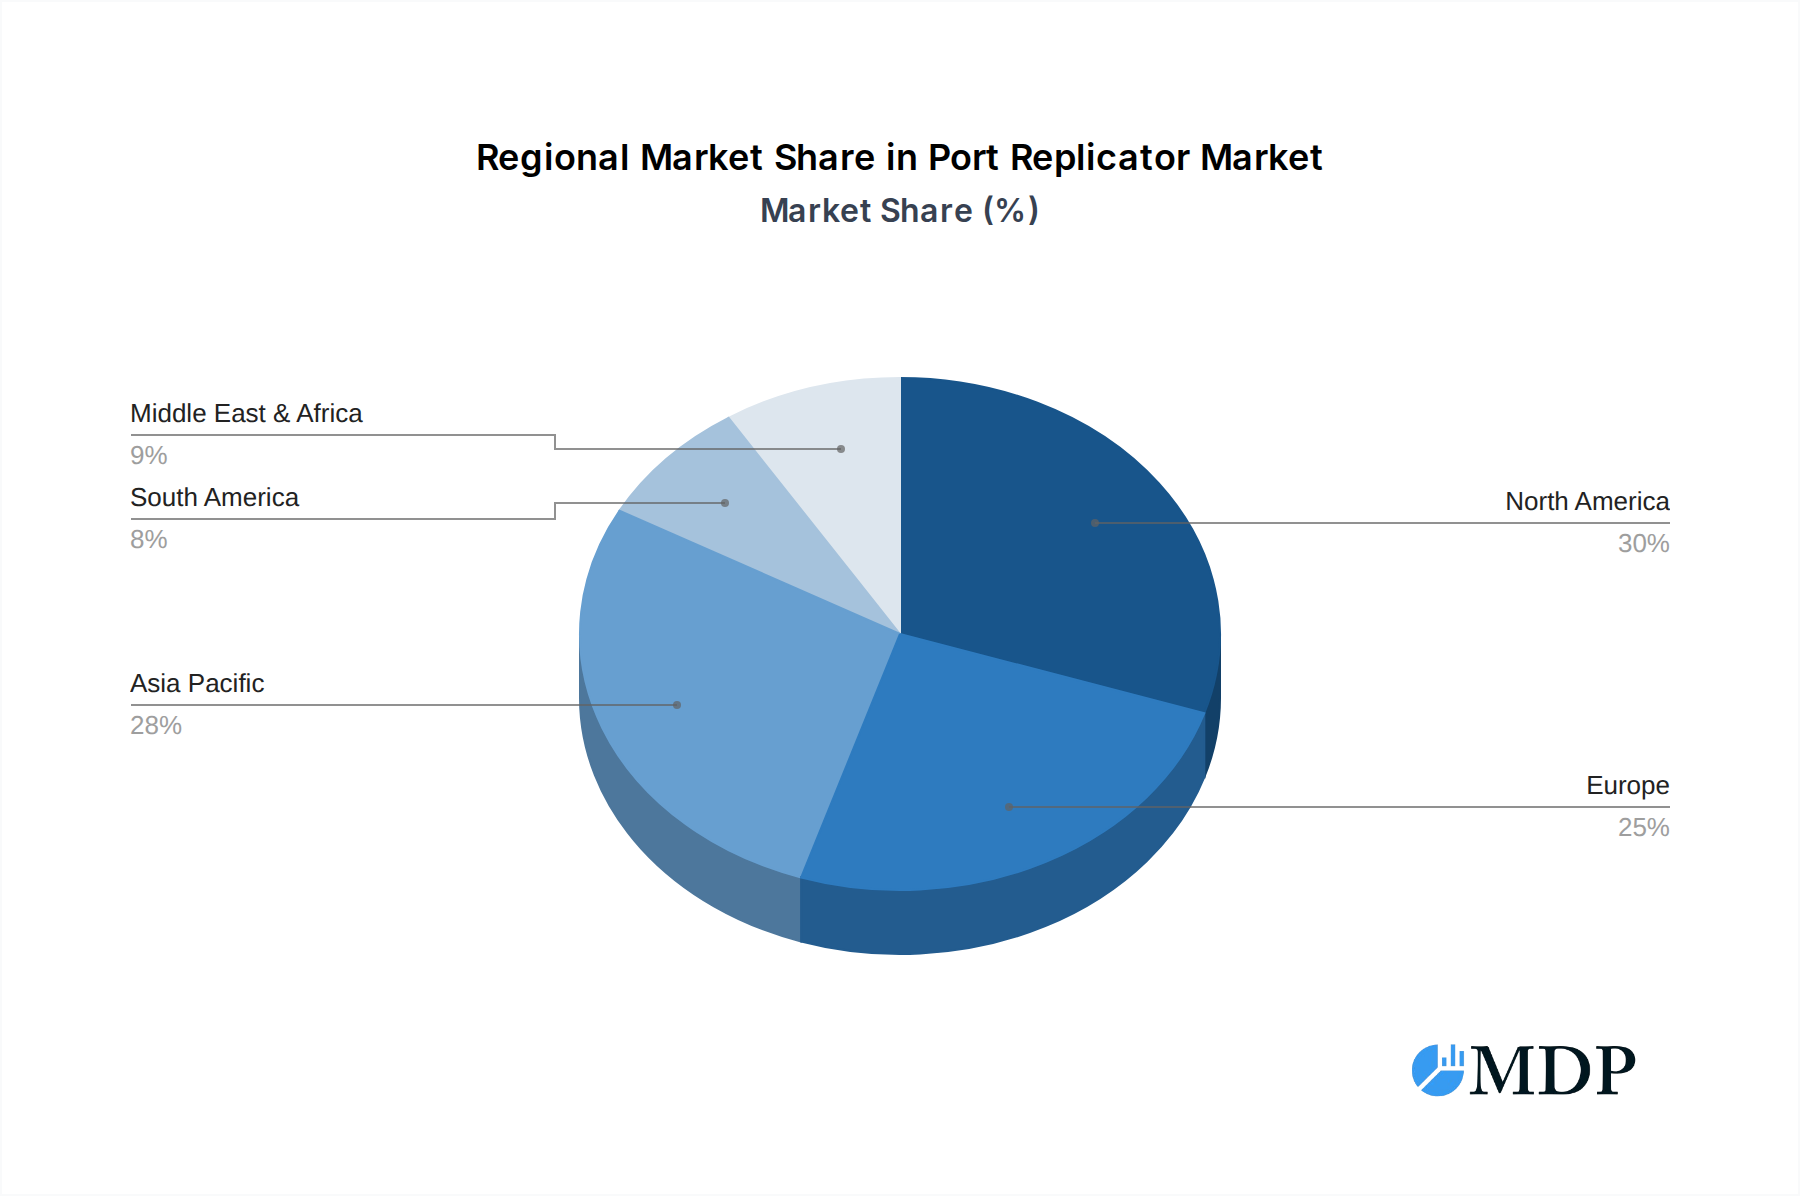
The global port replicator market is characterized by distinct regional dominance and a significant segmentation across various application and product type categories, all contributing to a multi-billion-dollar economic landscape. Geographically, North America currently stands as the dominant region, driven by its robust technological infrastructure, high disposable income, and a substantial concentration of businesses and professional users who are early adopters of advanced connectivity solutions. The United States, in particular, leads this segment, fueled by a vibrant tech industry and a widespread adoption of hybrid work models. Key drivers for this dominance include strong economic policies that foster technological innovation, extensive investments in digital infrastructure, and a consumer base that prioritizes productivity and convenience. The widespread presence of leading technology companies and the continuous demand for high-performance computing accessories further solidify North America's leading position.
Within the Application segmentation, Online Sales have emerged as a dominant channel, reflecting the broader shift in consumer purchasing behavior towards e-commerce platforms. This segment is projected to account for an estimated XX% of the total port replicator market revenue by 2025, with projections indicating a further increase to XX% by 2033. The convenience of online purchasing, the availability of a wider product selection, and competitive pricing strategies employed by e-commerce retailers contribute significantly to this dominance. Major online retailers offer a comprehensive range of port replicators, from basic USB 2.0 models to advanced Thunderbolt docks, catering to diverse customer needs.
Analyzing the Types of port replicators, the USB 3.0 Type segment holds a significant market share, driven by its widespread compatibility and substantial improvement in data transfer speeds over its predecessors. This segment is estimated to capture approximately XX% of the market revenue in 2025, with a projected growth to XX% by 2033. The increasing prevalence of USB 3.0 ports on laptops, desktops, and other peripherals makes these replicators a popular choice for users seeking a balance of performance and affordability. However, the Others category, which encompasses advanced interfaces like USB-C, Thunderbolt 3, and Thunderbolt 4, is experiencing the most rapid growth. This segment, currently representing an estimated XX% of the market, is expected to surge to XX% by 2033, driven by the technological advancements and the demand for higher bandwidth and more versatile connectivity options, particularly among professional users and creative professionals. The increasing adoption of USB-C as a universal standard for data transfer, power delivery, and video output is a key catalyst for the growth of this segment, enabling seamless integration with modern computing devices.
Port Replicator Product Developments: Innovations Driving Connectivity
The port replicator market is witnessing a wave of product innovations focused on enhancing user experience, expanding functionality, and improving compatibility. Key developments include the integration of higher bandwidth interfaces like Thunderbolt 4, enabling lightning-fast data transfer speeds and support for multiple high-resolution displays. Many new models feature advanced power delivery capabilities, allowing users to charge their laptops and power multiple peripherals simultaneously through a single connection. Furthermore, manufacturers are prioritizing compact and portable designs, making port replicators ideal for mobile professionals and users with limited desk space. The inclusion of features such as dedicated Ethernet ports, SD card readers, and multiple USB-A and USB-C ports addresses the growing need for versatile connectivity options in a single device. These innovations aim to provide seamless integration and boost productivity for a wide range of users, from everyday consumers to demanding creative professionals and business users.
Key Drivers of Port Replicator Growth: Powering the Billion-Dollar Expansion
The sustained growth of the port replicator market is underpinned by several powerful drivers. Technologically, the ubiquity of USB-C ports on modern laptops and the ongoing development of faster interfaces like Thunderbolt 4 are fundamentally reshaping connectivity needs. Economically, the widespread adoption of hybrid and remote work models has created a persistent demand for versatile and reliable docking solutions that enable seamless transitions between home and office environments. Regulatory factors, while less direct, can also play a role by encouraging industry-wide standardization of port technologies, which simplifies development and enhances user compatibility. The increasing sophistication of consumer electronics, with devices featuring fewer built-in ports, further necessitates the use of port replicators to restore lost functionality and enhance user convenience, thus driving market expansion.
Challenges in the Port Replicator Market: Navigating the Hurdles
Despite its robust growth, the port replicator market faces several challenges that can temper its expansion. Regulatory hurdles, such as varying compliance standards across different regions for power delivery and data transfer, can complicate product development and international market entry. Supply chain issues, particularly in the current global economic climate, can lead to component shortages and increased manufacturing costs, impacting product availability and pricing. Competitive pressures from both established brands and an influx of new entrants can lead to price wars and reduced profit margins. Furthermore, the rapid pace of technological evolution means that products can become outdated quickly, requiring continuous investment in research and development to stay competitive. The potential for obsolescence and the need for frequent upgrades represent a significant barrier for some price-sensitive consumers.
Emerging Opportunities in Port Replicator: Charting a Future of Innovation
The port replicator market is ripe with emerging opportunities that promise to fuel long-term growth. Technological breakthroughs in areas like Wi-Fi 6E and future wireless connectivity standards could lead to innovative wireless docking solutions, reducing cable clutter. Strategic partnerships between port replicator manufacturers and laptop vendors could lead to deeper integration and optimized performance for specific device ecosystems. Market expansion into emerging economies, where the adoption of personal computing devices is rapidly increasing, presents a significant untapped potential. Furthermore, the growing demand for specialized docking solutions for gaming, content creation, and virtual reality applications offers niche market opportunities for product differentiation and value-added services. The development of smart docking stations with enhanced security features and remote management capabilities also presents a lucrative avenue for growth.
Leading Players in the Port Replicator Sector
- ACCO
- Anker
- Lenovo
- TOSHIBA
- SAMSUNG
- UGREEN
- Dell
- HP
- Satechi
- Microsoft
- Hyper
- VAVA
- Philips
- LENTION Electronic Technology
- QGeeM
- Sabrent
- Unitek International Group
- TRIPP LITE
- IOGEAR
Key Milestones in Port Replicator Industry
- 2019: Introduction of widespread USB-C based docking stations offering power delivery and high-resolution display output.
- 2020: Increased demand for portable and multi-functional port replicators driven by the rise of remote work.
- 2021: Advancements in Thunderbolt 4 technology leading to higher bandwidth and enhanced connectivity options.
- 2022: Growing market for replicators supporting multiple 4K or 8K displays.
- 2023: Emphasis on sustainable materials and energy-efficient designs in port replicator manufacturing.
- 2024: Introduction of intelligent docking stations with advanced security features and device management capabilities.
Strategic Outlook for Port Replicator Market: Accelerating Towards a Connected Future
The strategic outlook for the port replicator market remains overwhelmingly positive, driven by the relentless pace of technological innovation and the evolving needs of the modern user. The increasing demand for versatile, high-performance connectivity solutions will continue to be a primary growth accelerator. Future market potential lies in the development of more integrated, intelligent, and wireless docking solutions that offer seamless user experiences. Strategic opportunities will emerge from deeper collaborations with device manufacturers, expansion into new geographical markets, and the creation of specialized docking stations catering to emerging technological trends like AI-powered computing and advanced gaming setups. The continuous drive towards a more connected and productive digital environment ensures a sustained demand for sophisticated port replicator solutions.
Port Replicator Segmentation
-
1. Application
- 1.1. Online Sales
- 1.2. Offline Sales
-
2. Types
- 2.1. USB 2.0 Type
- 2.2. USB 3.0 Type
- 2.3. Others
Port Replicator Segmentation By Geography
-
1. North America
- 1.1. United States
- 1.2. Canada
- 1.3. Mexico
-
2. South America
- 2.1. Brazil
- 2.2. Argentina
- 2.3. Rest of South America
-
3. Europe
- 3.1. United Kingdom
- 3.2. Germany
- 3.3. France
- 3.4. Italy
- 3.5. Spain
- 3.6. Russia
- 3.7. Benelux
- 3.8. Nordics
- 3.9. Rest of Europe
-
4. Middle East & Africa
- 4.1. Turkey
- 4.2. Israel
- 4.3. GCC
- 4.4. North Africa
- 4.5. South Africa
- 4.6. Rest of Middle East & Africa
-
5. Asia Pacific
- 5.1. China
- 5.2. India
- 5.3. Japan
- 5.4. South Korea
- 5.5. ASEAN
- 5.6. Oceania
- 5.7. Rest of Asia Pacific
Port Replicator Regional Market Share
Geographic Coverage of Port Replicator
Port Replicator REPORT HIGHLIGHTS
| Aspects | Details |
|---|---|
| Study Period | 2020-2034 |
| Base Year | 2025 |
| Estimated Year | 2026 |
| Forecast Period | 2026-2034 |
| Historical Period | 2020-2025 |
| Growth Rate | CAGR of 7.53% from 2020-2034 |
| Segmentation |
|
Table of Contents
- 1. Introduction
- 1.1. Research Scope
- 1.2. Market Segmentation
- 1.3. Research Methodology
- 1.4. Definitions and Assumptions
- 2. Executive Summary
- 2.1. Introduction
- 3. Market Dynamics
- 3.1. Introduction
- 3.2. Market Drivers
- 3.3. Market Restrains
- 3.4. Market Trends
- 4. Market Factor Analysis
- 4.1. Porters Five Forces
- 4.2. Supply/Value Chain
- 4.3. PESTEL analysis
- 4.4. Market Entropy
- 4.5. Patent/Trademark Analysis
- 5. Global Port Replicator Analysis, Insights and Forecast, 2020-2032
- 5.1. Market Analysis, Insights and Forecast - by Application
- 5.1.1. Online Sales
- 5.1.2. Offline Sales
- 5.2. Market Analysis, Insights and Forecast - by Types
- 5.2.1. USB 2.0 Type
- 5.2.2. USB 3.0 Type
- 5.2.3. Others
- 5.3. Market Analysis, Insights and Forecast - by Region
- 5.3.1. North America
- 5.3.2. South America
- 5.3.3. Europe
- 5.3.4. Middle East & Africa
- 5.3.5. Asia Pacific
- 5.1. Market Analysis, Insights and Forecast - by Application
- 6. North America Port Replicator Analysis, Insights and Forecast, 2020-2032
- 6.1. Market Analysis, Insights and Forecast - by Application
- 6.1.1. Online Sales
- 6.1.2. Offline Sales
- 6.2. Market Analysis, Insights and Forecast - by Types
- 6.2.1. USB 2.0 Type
- 6.2.2. USB 3.0 Type
- 6.2.3. Others
- 6.1. Market Analysis, Insights and Forecast - by Application
- 7. South America Port Replicator Analysis, Insights and Forecast, 2020-2032
- 7.1. Market Analysis, Insights and Forecast - by Application
- 7.1.1. Online Sales
- 7.1.2. Offline Sales
- 7.2. Market Analysis, Insights and Forecast - by Types
- 7.2.1. USB 2.0 Type
- 7.2.2. USB 3.0 Type
- 7.2.3. Others
- 7.1. Market Analysis, Insights and Forecast - by Application
- 8. Europe Port Replicator Analysis, Insights and Forecast, 2020-2032
- 8.1. Market Analysis, Insights and Forecast - by Application
- 8.1.1. Online Sales
- 8.1.2. Offline Sales
- 8.2. Market Analysis, Insights and Forecast - by Types
- 8.2.1. USB 2.0 Type
- 8.2.2. USB 3.0 Type
- 8.2.3. Others
- 8.1. Market Analysis, Insights and Forecast - by Application
- 9. Middle East & Africa Port Replicator Analysis, Insights and Forecast, 2020-2032
- 9.1. Market Analysis, Insights and Forecast - by Application
- 9.1.1. Online Sales
- 9.1.2. Offline Sales
- 9.2. Market Analysis, Insights and Forecast - by Types
- 9.2.1. USB 2.0 Type
- 9.2.2. USB 3.0 Type
- 9.2.3. Others
- 9.1. Market Analysis, Insights and Forecast - by Application
- 10. Asia Pacific Port Replicator Analysis, Insights and Forecast, 2020-2032
- 10.1. Market Analysis, Insights and Forecast - by Application
- 10.1.1. Online Sales
- 10.1.2. Offline Sales
- 10.2. Market Analysis, Insights and Forecast - by Types
- 10.2.1. USB 2.0 Type
- 10.2.2. USB 3.0 Type
- 10.2.3. Others
- 10.1. Market Analysis, Insights and Forecast - by Application
- 11. Competitive Analysis
- 11.1. Global Market Share Analysis 2025
- 11.2. Company Profiles
- 11.2.1 ACCO
- 11.2.1.1. Overview
- 11.2.1.2. Products
- 11.2.1.3. SWOT Analysis
- 11.2.1.4. Recent Developments
- 11.2.1.5. Financials (Based on Availability)
- 11.2.2 Anker
- 11.2.2.1. Overview
- 11.2.2.2. Products
- 11.2.2.3. SWOT Analysis
- 11.2.2.4. Recent Developments
- 11.2.2.5. Financials (Based on Availability)
- 11.2.3 Lenovo
- 11.2.3.1. Overview
- 11.2.3.2. Products
- 11.2.3.3. SWOT Analysis
- 11.2.3.4. Recent Developments
- 11.2.3.5. Financials (Based on Availability)
- 11.2.4 TOSHIBA
- 11.2.4.1. Overview
- 11.2.4.2. Products
- 11.2.4.3. SWOT Analysis
- 11.2.4.4. Recent Developments
- 11.2.4.5. Financials (Based on Availability)
- 11.2.5 SAMSUNG
- 11.2.5.1. Overview
- 11.2.5.2. Products
- 11.2.5.3. SWOT Analysis
- 11.2.5.4. Recent Developments
- 11.2.5.5. Financials (Based on Availability)
- 11.2.6 UGREEN
- 11.2.6.1. Overview
- 11.2.6.2. Products
- 11.2.6.3. SWOT Analysis
- 11.2.6.4. Recent Developments
- 11.2.6.5. Financials (Based on Availability)
- 11.2.7 Dell
- 11.2.7.1. Overview
- 11.2.7.2. Products
- 11.2.7.3. SWOT Analysis
- 11.2.7.4. Recent Developments
- 11.2.7.5. Financials (Based on Availability)
- 11.2.8 HP Development
- 11.2.8.1. Overview
- 11.2.8.2. Products
- 11.2.8.3. SWOT Analysis
- 11.2.8.4. Recent Developments
- 11.2.8.5. Financials (Based on Availability)
- 11.2.9 Satechi
- 11.2.9.1. Overview
- 11.2.9.2. Products
- 11.2.9.3. SWOT Analysis
- 11.2.9.4. Recent Developments
- 11.2.9.5. Financials (Based on Availability)
- 11.2.10 Microsoft
- 11.2.10.1. Overview
- 11.2.10.2. Products
- 11.2.10.3. SWOT Analysis
- 11.2.10.4. Recent Developments
- 11.2.10.5. Financials (Based on Availability)
- 11.2.11 Hyper
- 11.2.11.1. Overview
- 11.2.11.2. Products
- 11.2.11.3. SWOT Analysis
- 11.2.11.4. Recent Developments
- 11.2.11.5. Financials (Based on Availability)
- 11.2.12 VAVA
- 11.2.12.1. Overview
- 11.2.12.2. Products
- 11.2.12.3. SWOT Analysis
- 11.2.12.4. Recent Developments
- 11.2.12.5. Financials (Based on Availability)
- 11.2.13 Philips
- 11.2.13.1. Overview
- 11.2.13.2. Products
- 11.2.13.3. SWOT Analysis
- 11.2.13.4. Recent Developments
- 11.2.13.5. Financials (Based on Availability)
- 11.2.14 LENTION Electronic Technology
- 11.2.14.1. Overview
- 11.2.14.2. Products
- 11.2.14.3. SWOT Analysis
- 11.2.14.4. Recent Developments
- 11.2.14.5. Financials (Based on Availability)
- 11.2.15 QGeeM
- 11.2.15.1. Overview
- 11.2.15.2. Products
- 11.2.15.3. SWOT Analysis
- 11.2.15.4. Recent Developments
- 11.2.15.5. Financials (Based on Availability)
- 11.2.16 Sabrent
- 11.2.16.1. Overview
- 11.2.16.2. Products
- 11.2.16.3. SWOT Analysis
- 11.2.16.4. Recent Developments
- 11.2.16.5. Financials (Based on Availability)
- 11.2.17 Unitek International Group
- 11.2.17.1. Overview
- 11.2.17.2. Products
- 11.2.17.3. SWOT Analysis
- 11.2.17.4. Recent Developments
- 11.2.17.5. Financials (Based on Availability)
- 11.2.18 TRIPP LITE
- 11.2.18.1. Overview
- 11.2.18.2. Products
- 11.2.18.3. SWOT Analysis
- 11.2.18.4. Recent Developments
- 11.2.18.5. Financials (Based on Availability)
- 11.2.19 IOGEAR
- 11.2.19.1. Overview
- 11.2.19.2. Products
- 11.2.19.3. SWOT Analysis
- 11.2.19.4. Recent Developments
- 11.2.19.5. Financials (Based on Availability)
- 11.2.1 ACCO
List of Figures
- Figure 1: Global Port Replicator Revenue Breakdown (undefined, %) by Region 2025 & 2033
- Figure 2: Global Port Replicator Volume Breakdown (K, %) by Region 2025 & 2033
- Figure 3: North America Port Replicator Revenue (undefined), by Application 2025 & 2033
- Figure 4: North America Port Replicator Volume (K), by Application 2025 & 2033
- Figure 5: North America Port Replicator Revenue Share (%), by Application 2025 & 2033
- Figure 6: North America Port Replicator Volume Share (%), by Application 2025 & 2033
- Figure 7: North America Port Replicator Revenue (undefined), by Types 2025 & 2033
- Figure 8: North America Port Replicator Volume (K), by Types 2025 & 2033
- Figure 9: North America Port Replicator Revenue Share (%), by Types 2025 & 2033
- Figure 10: North America Port Replicator Volume Share (%), by Types 2025 & 2033
- Figure 11: North America Port Replicator Revenue (undefined), by Country 2025 & 2033
- Figure 12: North America Port Replicator Volume (K), by Country 2025 & 2033
- Figure 13: North America Port Replicator Revenue Share (%), by Country 2025 & 2033
- Figure 14: North America Port Replicator Volume Share (%), by Country 2025 & 2033
- Figure 15: South America Port Replicator Revenue (undefined), by Application 2025 & 2033
- Figure 16: South America Port Replicator Volume (K), by Application 2025 & 2033
- Figure 17: South America Port Replicator Revenue Share (%), by Application 2025 & 2033
- Figure 18: South America Port Replicator Volume Share (%), by Application 2025 & 2033
- Figure 19: South America Port Replicator Revenue (undefined), by Types 2025 & 2033
- Figure 20: South America Port Replicator Volume (K), by Types 2025 & 2033
- Figure 21: South America Port Replicator Revenue Share (%), by Types 2025 & 2033
- Figure 22: South America Port Replicator Volume Share (%), by Types 2025 & 2033
- Figure 23: South America Port Replicator Revenue (undefined), by Country 2025 & 2033
- Figure 24: South America Port Replicator Volume (K), by Country 2025 & 2033
- Figure 25: South America Port Replicator Revenue Share (%), by Country 2025 & 2033
- Figure 26: South America Port Replicator Volume Share (%), by Country 2025 & 2033
- Figure 27: Europe Port Replicator Revenue (undefined), by Application 2025 & 2033
- Figure 28: Europe Port Replicator Volume (K), by Application 2025 & 2033
- Figure 29: Europe Port Replicator Revenue Share (%), by Application 2025 & 2033
- Figure 30: Europe Port Replicator Volume Share (%), by Application 2025 & 2033
- Figure 31: Europe Port Replicator Revenue (undefined), by Types 2025 & 2033
- Figure 32: Europe Port Replicator Volume (K), by Types 2025 & 2033
- Figure 33: Europe Port Replicator Revenue Share (%), by Types 2025 & 2033
- Figure 34: Europe Port Replicator Volume Share (%), by Types 2025 & 2033
- Figure 35: Europe Port Replicator Revenue (undefined), by Country 2025 & 2033
- Figure 36: Europe Port Replicator Volume (K), by Country 2025 & 2033
- Figure 37: Europe Port Replicator Revenue Share (%), by Country 2025 & 2033
- Figure 38: Europe Port Replicator Volume Share (%), by Country 2025 & 2033
- Figure 39: Middle East & Africa Port Replicator Revenue (undefined), by Application 2025 & 2033
- Figure 40: Middle East & Africa Port Replicator Volume (K), by Application 2025 & 2033
- Figure 41: Middle East & Africa Port Replicator Revenue Share (%), by Application 2025 & 2033
- Figure 42: Middle East & Africa Port Replicator Volume Share (%), by Application 2025 & 2033
- Figure 43: Middle East & Africa Port Replicator Revenue (undefined), by Types 2025 & 2033
- Figure 44: Middle East & Africa Port Replicator Volume (K), by Types 2025 & 2033
- Figure 45: Middle East & Africa Port Replicator Revenue Share (%), by Types 2025 & 2033
- Figure 46: Middle East & Africa Port Replicator Volume Share (%), by Types 2025 & 2033
- Figure 47: Middle East & Africa Port Replicator Revenue (undefined), by Country 2025 & 2033
- Figure 48: Middle East & Africa Port Replicator Volume (K), by Country 2025 & 2033
- Figure 49: Middle East & Africa Port Replicator Revenue Share (%), by Country 2025 & 2033
- Figure 50: Middle East & Africa Port Replicator Volume Share (%), by Country 2025 & 2033
- Figure 51: Asia Pacific Port Replicator Revenue (undefined), by Application 2025 & 2033
- Figure 52: Asia Pacific Port Replicator Volume (K), by Application 2025 & 2033
- Figure 53: Asia Pacific Port Replicator Revenue Share (%), by Application 2025 & 2033
- Figure 54: Asia Pacific Port Replicator Volume Share (%), by Application 2025 & 2033
- Figure 55: Asia Pacific Port Replicator Revenue (undefined), by Types 2025 & 2033
- Figure 56: Asia Pacific Port Replicator Volume (K), by Types 2025 & 2033
- Figure 57: Asia Pacific Port Replicator Revenue Share (%), by Types 2025 & 2033
- Figure 58: Asia Pacific Port Replicator Volume Share (%), by Types 2025 & 2033
- Figure 59: Asia Pacific Port Replicator Revenue (undefined), by Country 2025 & 2033
- Figure 60: Asia Pacific Port Replicator Volume (K), by Country 2025 & 2033
- Figure 61: Asia Pacific Port Replicator Revenue Share (%), by Country 2025 & 2033
- Figure 62: Asia Pacific Port Replicator Volume Share (%), by Country 2025 & 2033
List of Tables
- Table 1: Global Port Replicator Revenue undefined Forecast, by Application 2020 & 2033
- Table 2: Global Port Replicator Volume K Forecast, by Application 2020 & 2033
- Table 3: Global Port Replicator Revenue undefined Forecast, by Types 2020 & 2033
- Table 4: Global Port Replicator Volume K Forecast, by Types 2020 & 2033
- Table 5: Global Port Replicator Revenue undefined Forecast, by Region 2020 & 2033
- Table 6: Global Port Replicator Volume K Forecast, by Region 2020 & 2033
- Table 7: Global Port Replicator Revenue undefined Forecast, by Application 2020 & 2033
- Table 8: Global Port Replicator Volume K Forecast, by Application 2020 & 2033
- Table 9: Global Port Replicator Revenue undefined Forecast, by Types 2020 & 2033
- Table 10: Global Port Replicator Volume K Forecast, by Types 2020 & 2033
- Table 11: Global Port Replicator Revenue undefined Forecast, by Country 2020 & 2033
- Table 12: Global Port Replicator Volume K Forecast, by Country 2020 & 2033
- Table 13: United States Port Replicator Revenue (undefined) Forecast, by Application 2020 & 2033
- Table 14: United States Port Replicator Volume (K) Forecast, by Application 2020 & 2033
- Table 15: Canada Port Replicator Revenue (undefined) Forecast, by Application 2020 & 2033
- Table 16: Canada Port Replicator Volume (K) Forecast, by Application 2020 & 2033
- Table 17: Mexico Port Replicator Revenue (undefined) Forecast, by Application 2020 & 2033
- Table 18: Mexico Port Replicator Volume (K) Forecast, by Application 2020 & 2033
- Table 19: Global Port Replicator Revenue undefined Forecast, by Application 2020 & 2033
- Table 20: Global Port Replicator Volume K Forecast, by Application 2020 & 2033
- Table 21: Global Port Replicator Revenue undefined Forecast, by Types 2020 & 2033
- Table 22: Global Port Replicator Volume K Forecast, by Types 2020 & 2033
- Table 23: Global Port Replicator Revenue undefined Forecast, by Country 2020 & 2033
- Table 24: Global Port Replicator Volume K Forecast, by Country 2020 & 2033
- Table 25: Brazil Port Replicator Revenue (undefined) Forecast, by Application 2020 & 2033
- Table 26: Brazil Port Replicator Volume (K) Forecast, by Application 2020 & 2033
- Table 27: Argentina Port Replicator Revenue (undefined) Forecast, by Application 2020 & 2033
- Table 28: Argentina Port Replicator Volume (K) Forecast, by Application 2020 & 2033
- Table 29: Rest of South America Port Replicator Revenue (undefined) Forecast, by Application 2020 & 2033
- Table 30: Rest of South America Port Replicator Volume (K) Forecast, by Application 2020 & 2033
- Table 31: Global Port Replicator Revenue undefined Forecast, by Application 2020 & 2033
- Table 32: Global Port Replicator Volume K Forecast, by Application 2020 & 2033
- Table 33: Global Port Replicator Revenue undefined Forecast, by Types 2020 & 2033
- Table 34: Global Port Replicator Volume K Forecast, by Types 2020 & 2033
- Table 35: Global Port Replicator Revenue undefined Forecast, by Country 2020 & 2033
- Table 36: Global Port Replicator Volume K Forecast, by Country 2020 & 2033
- Table 37: United Kingdom Port Replicator Revenue (undefined) Forecast, by Application 2020 & 2033
- Table 38: United Kingdom Port Replicator Volume (K) Forecast, by Application 2020 & 2033
- Table 39: Germany Port Replicator Revenue (undefined) Forecast, by Application 2020 & 2033
- Table 40: Germany Port Replicator Volume (K) Forecast, by Application 2020 & 2033
- Table 41: France Port Replicator Revenue (undefined) Forecast, by Application 2020 & 2033
- Table 42: France Port Replicator Volume (K) Forecast, by Application 2020 & 2033
- Table 43: Italy Port Replicator Revenue (undefined) Forecast, by Application 2020 & 2033
- Table 44: Italy Port Replicator Volume (K) Forecast, by Application 2020 & 2033
- Table 45: Spain Port Replicator Revenue (undefined) Forecast, by Application 2020 & 2033
- Table 46: Spain Port Replicator Volume (K) Forecast, by Application 2020 & 2033
- Table 47: Russia Port Replicator Revenue (undefined) Forecast, by Application 2020 & 2033
- Table 48: Russia Port Replicator Volume (K) Forecast, by Application 2020 & 2033
- Table 49: Benelux Port Replicator Revenue (undefined) Forecast, by Application 2020 & 2033
- Table 50: Benelux Port Replicator Volume (K) Forecast, by Application 2020 & 2033
- Table 51: Nordics Port Replicator Revenue (undefined) Forecast, by Application 2020 & 2033
- Table 52: Nordics Port Replicator Volume (K) Forecast, by Application 2020 & 2033
- Table 53: Rest of Europe Port Replicator Revenue (undefined) Forecast, by Application 2020 & 2033
- Table 54: Rest of Europe Port Replicator Volume (K) Forecast, by Application 2020 & 2033
- Table 55: Global Port Replicator Revenue undefined Forecast, by Application 2020 & 2033
- Table 56: Global Port Replicator Volume K Forecast, by Application 2020 & 2033
- Table 57: Global Port Replicator Revenue undefined Forecast, by Types 2020 & 2033
- Table 58: Global Port Replicator Volume K Forecast, by Types 2020 & 2033
- Table 59: Global Port Replicator Revenue undefined Forecast, by Country 2020 & 2033
- Table 60: Global Port Replicator Volume K Forecast, by Country 2020 & 2033
- Table 61: Turkey Port Replicator Revenue (undefined) Forecast, by Application 2020 & 2033
- Table 62: Turkey Port Replicator Volume (K) Forecast, by Application 2020 & 2033
- Table 63: Israel Port Replicator Revenue (undefined) Forecast, by Application 2020 & 2033
- Table 64: Israel Port Replicator Volume (K) Forecast, by Application 2020 & 2033
- Table 65: GCC Port Replicator Revenue (undefined) Forecast, by Application 2020 & 2033
- Table 66: GCC Port Replicator Volume (K) Forecast, by Application 2020 & 2033
- Table 67: North Africa Port Replicator Revenue (undefined) Forecast, by Application 2020 & 2033
- Table 68: North Africa Port Replicator Volume (K) Forecast, by Application 2020 & 2033
- Table 69: South Africa Port Replicator Revenue (undefined) Forecast, by Application 2020 & 2033
- Table 70: South Africa Port Replicator Volume (K) Forecast, by Application 2020 & 2033
- Table 71: Rest of Middle East & Africa Port Replicator Revenue (undefined) Forecast, by Application 2020 & 2033
- Table 72: Rest of Middle East & Africa Port Replicator Volume (K) Forecast, by Application 2020 & 2033
- Table 73: Global Port Replicator Revenue undefined Forecast, by Application 2020 & 2033
- Table 74: Global Port Replicator Volume K Forecast, by Application 2020 & 2033
- Table 75: Global Port Replicator Revenue undefined Forecast, by Types 2020 & 2033
- Table 76: Global Port Replicator Volume K Forecast, by Types 2020 & 2033
- Table 77: Global Port Replicator Revenue undefined Forecast, by Country 2020 & 2033
- Table 78: Global Port Replicator Volume K Forecast, by Country 2020 & 2033
- Table 79: China Port Replicator Revenue (undefined) Forecast, by Application 2020 & 2033
- Table 80: China Port Replicator Volume (K) Forecast, by Application 2020 & 2033
- Table 81: India Port Replicator Revenue (undefined) Forecast, by Application 2020 & 2033
- Table 82: India Port Replicator Volume (K) Forecast, by Application 2020 & 2033
- Table 83: Japan Port Replicator Revenue (undefined) Forecast, by Application 2020 & 2033
- Table 84: Japan Port Replicator Volume (K) Forecast, by Application 2020 & 2033
- Table 85: South Korea Port Replicator Revenue (undefined) Forecast, by Application 2020 & 2033
- Table 86: South Korea Port Replicator Volume (K) Forecast, by Application 2020 & 2033
- Table 87: ASEAN Port Replicator Revenue (undefined) Forecast, by Application 2020 & 2033
- Table 88: ASEAN Port Replicator Volume (K) Forecast, by Application 2020 & 2033
- Table 89: Oceania Port Replicator Revenue (undefined) Forecast, by Application 2020 & 2033
- Table 90: Oceania Port Replicator Volume (K) Forecast, by Application 2020 & 2033
- Table 91: Rest of Asia Pacific Port Replicator Revenue (undefined) Forecast, by Application 2020 & 2033
- Table 92: Rest of Asia Pacific Port Replicator Volume (K) Forecast, by Application 2020 & 2033
Frequently Asked Questions
1. What is the projected Compound Annual Growth Rate (CAGR) of the Port Replicator?
The projected CAGR is approximately 7.53%.
2. Which companies are prominent players in the Port Replicator?
Key companies in the market include ACCO, Anker, Lenovo, TOSHIBA, SAMSUNG, UGREEN, Dell, HP Development, Satechi, Microsoft, Hyper, VAVA, Philips, LENTION Electronic Technology, QGeeM, Sabrent, Unitek International Group, TRIPP LITE, IOGEAR.
3. What are the main segments of the Port Replicator?
The market segments include Application, Types.
4. Can you provide details about the market size?
The market size is estimated to be USD XXX N/A as of 2022.
5. What are some drivers contributing to market growth?
N/A
6. What are the notable trends driving market growth?
N/A
7. Are there any restraints impacting market growth?
N/A
8. Can you provide examples of recent developments in the market?
N/A
9. What pricing options are available for accessing the report?
Pricing options include single-user, multi-user, and enterprise licenses priced at USD 3950.00, USD 5925.00, and USD 7900.00 respectively.
10. Is the market size provided in terms of value or volume?
The market size is provided in terms of value, measured in N/A and volume, measured in K.
11. Are there any specific market keywords associated with the report?
Yes, the market keyword associated with the report is "Port Replicator," which aids in identifying and referencing the specific market segment covered.
12. How do I determine which pricing option suits my needs best?
The pricing options vary based on user requirements and access needs. Individual users may opt for single-user licenses, while businesses requiring broader access may choose multi-user or enterprise licenses for cost-effective access to the report.
13. Are there any additional resources or data provided in the Port Replicator report?
While the report offers comprehensive insights, it's advisable to review the specific contents or supplementary materials provided to ascertain if additional resources or data are available.
14. How can I stay updated on further developments or reports in the Port Replicator?
To stay informed about further developments, trends, and reports in the Port Replicator, consider subscribing to industry newsletters, following relevant companies and organizations, or regularly checking reputable industry news sources and publications.
Methodology
Step 1 - Identification of Relevant Samples Size from Population Database


Step 2 - Approaches for Defining Global Market Size (Value, Volume* & Price*)

Note*: In applicable scenarios
Step 3 - Data Sources
Primary Research
- Web Analytics
- Survey Reports
- Research Institute
- Latest Research Reports
- Opinion Leaders
Secondary Research
- Annual Reports
- White Paper
- Latest Press Release
- Industry Association
- Paid Database
- Investor Presentations

Step 4 - Data Triangulation
Involves using different sources of information in order to increase the validity of a study
These sources are likely to be stakeholders in a program - participants, other researchers, program staff, other community members, and so on.
Then we put all data in single framework & apply various statistical tools to find out the dynamic on the market.
During the analysis stage, feedback from the stakeholder groups would be compared to determine areas of agreement as well as areas of divergence