

Key Insights
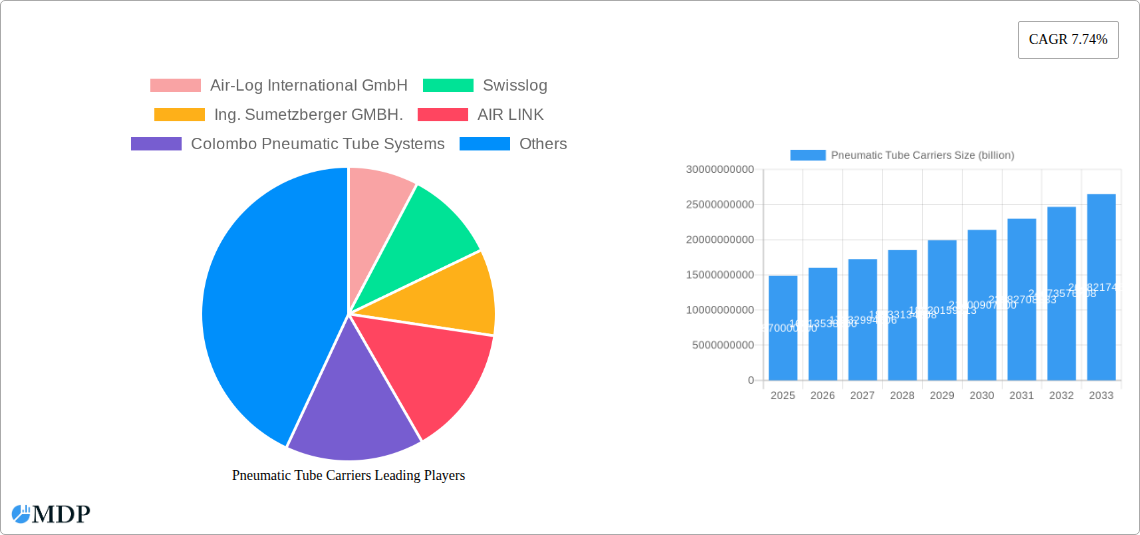
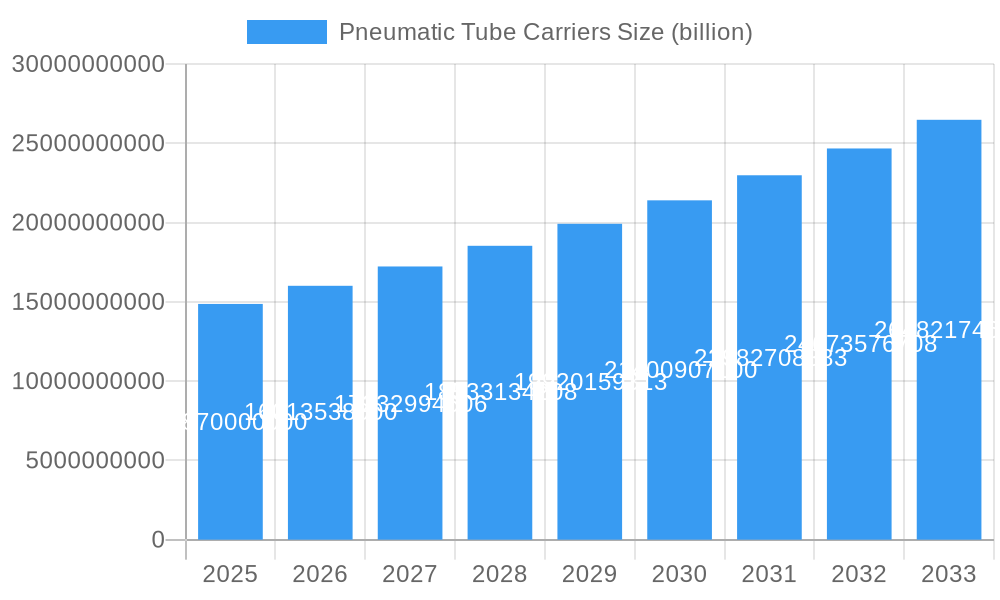
The global Pneumatic Tube System (PTS) market is poised for significant expansion, driven by escalating demand for efficient and secure material handling solutions across diverse industries. The market, valued at $14.87 billion in 2025, is projected to grow at a Compound Annual Growth Rate (CAGR) of 7.74% from 2025 to 2033. Key growth catalysts include the increasing deployment of automated systems in healthcare for sample and pharmaceutical transport, the surge in e-commerce necessitating faster logistics, and the demand for heightened security and hygiene in critical environments. Market segmentation encompasses applications (healthcare, banking, industrial automation), system types (single-line, multi-line, network), and geographical regions. Leading entities like Air-Log International GmbH, Swisslog, and Ing. Sumetzberger GMBH are instrumental in driving innovation in system speed, reliability, and integration. Emerging trends, such as the incorporation of smart sensors and IoT for real-time tracking and predictive maintenance, are redefining the market's trajectory. Conversely, substantial initial investment requirements and the necessity for specialized installation and maintenance expertise may present market challenges.
Pneumatic Tube Carriers Market Size (In Billion)
Healthcare currently leads the pneumatic tube carrier market, primarily due to the critical need for rapid and dependable sample transportation in medical facilities. The rising incidence of chronic diseases and the growing requirement for advanced diagnostic capabilities further bolster this segment. Nevertheless, industrial automation and banking sectors are also experiencing considerable adoption, driven by efficiency and security imperatives in material handling. Future market expansion is anticipated to be fueled by technological advancements, including the development of more energy-efficient systems and the integration of artificial intelligence for optimized route planning and system management. Regional growth dynamics will be influenced by economic development, healthcare infrastructure investment, and the pace of automation technology adoption. The competitive environment features both established and emerging players, with innovation, pricing strategies, and customer service being key differentiators.
Pneumatic Tube Carriers Company Market Share
Pneumatic Tube Carriers Market Report: 2019-2033 - A Comprehensive Analysis of a Multi-Million Dollar Industry
This in-depth report provides a comprehensive analysis of the global Pneumatic Tube Carriers market, projecting a multi-million dollar valuation by 2033. The study meticulously examines market dynamics, industry trends, leading players, and future opportunities, offering actionable insights for stakeholders across the value chain. This report covers the period from 2019 to 2033, with a focus on the estimated year 2025 and a forecast period of 2025-2033.
Pneumatic Tube Carriers Market Dynamics & Concentration
This section analyzes the competitive landscape of the pneumatic tube carrier market, evaluating market concentration, innovation drivers, regulatory influences, and market trends influencing mergers and acquisitions (M&A). The market is moderately concentrated, with key players like Air-Log International GmbH, Swisslog, Ing. Sumetzberger GMBH, AIR LINK, and Colombo Pneumatic Tube Systems holding significant market share. The combined market share of the top five players is estimated at xx%.
- Market Concentration: The market demonstrates a moderately consolidated structure with xx% of the market share controlled by the top 5 players.
- Innovation Drivers: Advancements in automation, integration with digital systems, and the demand for enhanced speed and reliability are key innovation drivers.
- Regulatory Frameworks: Compliance with safety standards and data security regulations is crucial and significantly influences market dynamics. Variations in regulations across different geographies affect market penetration rates.
- Product Substitutes: While pneumatic tube systems are widely preferred, alternative material handling methods like conveyor belts and automated guided vehicles (AGVs) represent some level of substitution.
- End-User Trends: The increasing adoption of pneumatic tube systems in healthcare, banking, and industrial sectors drive market growth. The demand is particularly high in applications requiring high security, speed, and efficiency.
- M&A Activities: The number of M&A deals in the pneumatic tube carrier market during the historical period (2019-2024) was approximately xx, indicating consolidation and strategic expansion strategies within the industry.
Pneumatic Tube Carriers Industry Trends & Analysis
This section offers a detailed analysis of the prevailing trends in the pneumatic tube carrier market. The market has witnessed a Compound Annual Growth Rate (CAGR) of xx% during the historical period (2019-2024) and is projected to grow at a CAGR of xx% during the forecast period (2025-2033). Market penetration remains relatively high in developed economies but shows strong growth potential in emerging markets. Technological disruptions, such as the integration of IoT and AI capabilities, are reshaping the industry. Consumer preferences are shifting towards sustainable and energy-efficient solutions, while competitive dynamics are characterized by increasing product differentiation and strategic alliances.
Leading Markets & Segments in Pneumatic Tube Carriers
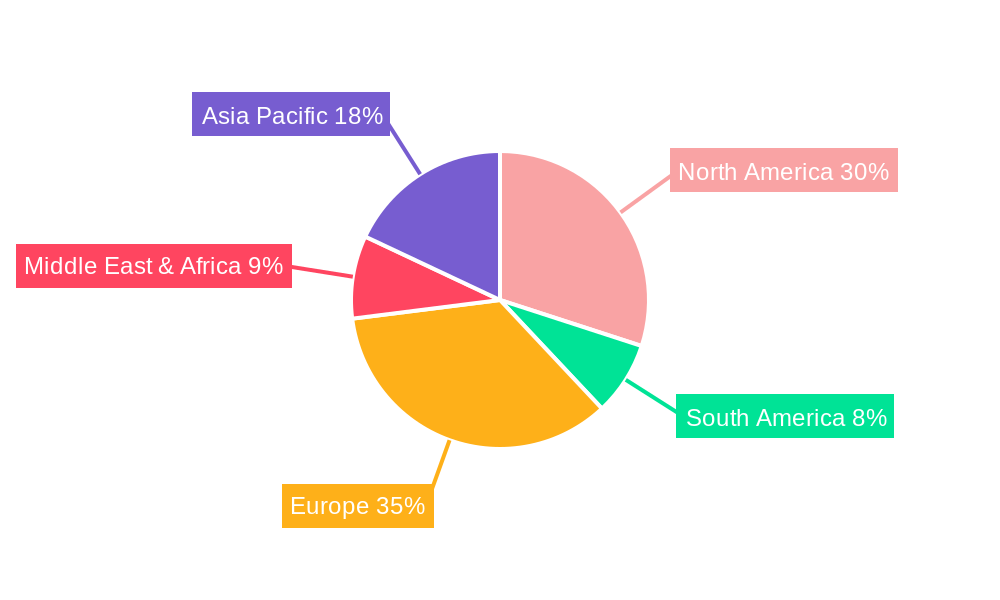
The healthcare sector is the leading segment for pneumatic tube carriers, driven by the crucial need for rapid and secure transport of medical samples and pharmaceuticals. North America currently holds the largest market share, owing to robust healthcare infrastructure and high adoption rates.
- Key Drivers in North America:
- Extensive healthcare infrastructure.
- Stringent regulatory frameworks emphasizing patient safety.
- High investments in advanced medical technologies.
- Key Drivers in Europe:
- Growing demand in hospital automation and pharmacy systems.
- Focus on optimizing healthcare logistics and efficiency.
- Government initiatives supporting technological advancements in healthcare.
- Dominance Analysis: The continued growth of the healthcare sector and increasing adoption of automation in healthcare settings ensures North America's continued dominance. However, strong growth is expected from Asia-Pacific regions due to increasing investments in healthcare infrastructure and rising disposable incomes.
Pneumatic Tube Carriers Product Developments
Recent product developments focus on enhancing speed, reliability, and safety features. Miniaturization and integration of advanced sensors are key trends. These improvements cater to the evolving needs of various industries, leading to increased market penetration and competitive advantages.
Key Drivers of Pneumatic Tube Carriers Growth
Several factors contribute to the growth of the pneumatic tube carriers market. Technological advancements, such as improved carrier design and control systems, contribute to higher efficiency and reliability. Increasing automation across industries enhances demand, while supportive government regulations and incentives further propel market growth.
Challenges in the Pneumatic Tube Carriers Market
The market faces certain challenges. High initial investment costs can deter adoption, especially for smaller businesses. Supply chain disruptions and fluctuating raw material prices impact profitability. Competition from alternative transportation methods presents a considerable challenge. These factors collectively impose constraints on market growth, though technological innovations and strategic partnerships continue to mitigate these challenges.
Emerging Opportunities in Pneumatic Tube Carriers
Significant opportunities exist in expanding into emerging markets with growing healthcare and industrial sectors. Strategic partnerships and collaborations can unlock new applications and market segments. The integration of advanced technologies like AI and IoT will lead to sophisticated, data-driven pneumatic tube systems, significantly enhancing efficiency and optimizing operations.
Leading Players in the Pneumatic Tube Carriers Sector
- Air-Log International GmbH
- Swisslog
- Ing. Sumetzberger GMBH.
- AIR LINK
- Colombo Pneumatic Tube Systems
Key Milestones in Pneumatic Tube Carriers Industry
- 2020: Introduction of a new generation of high-speed pneumatic tube carriers by Air-Log International GmbH.
- 2022: Swisslog launched a fully automated pneumatic tube system with integrated AI capabilities.
- 2023: Merger between two smaller pneumatic tube system providers, leading to increased market share.
Strategic Outlook for Pneumatic Tube Carriers Market
The pneumatic tube carriers market exhibits substantial long-term growth potential, driven by technological advancements, increasing automation needs, and rising demand in key industries. Strategic partnerships, focused research and development, and expansion into emerging markets will significantly contribute to future success for market players.
Pneumatic Tube Carriers Segmentation
-
1. Application
- 1.1. For Lab Samples
- 1.2. For Transport
-
2. Types
- 2.1. High-capacity
- 2.2. Low-capacity
Pneumatic Tube Carriers Segmentation By Geography
-
1. North America
- 1.1. United States
- 1.2. Canada
- 1.3. Mexico
-
2. South America
- 2.1. Brazil
- 2.2. Argentina
- 2.3. Rest of South America
-
3. Europe
- 3.1. United Kingdom
- 3.2. Germany
- 3.3. France
- 3.4. Italy
- 3.5. Spain
- 3.6. Russia
- 3.7. Benelux
- 3.8. Nordics
- 3.9. Rest of Europe
-
4. Middle East & Africa
- 4.1. Turkey
- 4.2. Israel
- 4.3. GCC
- 4.4. North Africa
- 4.5. South Africa
- 4.6. Rest of Middle East & Africa
-
5. Asia Pacific
- 5.1. China
- 5.2. India
- 5.3. Japan
- 5.4. South Korea
- 5.5. ASEAN
- 5.6. Oceania
- 5.7. Rest of Asia Pacific
Pneumatic Tube Carriers Regional Market Share
Geographic Coverage of Pneumatic Tube Carriers
Pneumatic Tube Carriers REPORT HIGHLIGHTS
| Aspects | Details |
|---|---|
| Study Period | 2020-2034 |
| Base Year | 2025 |
| Estimated Year | 2026 |
| Forecast Period | 2026-2034 |
| Historical Period | 2020-2025 |
| Growth Rate | CAGR of 7.74% from 2020-2034 |
| Segmentation |
|
Table of Contents
- 1. Introduction
- 1.1. Research Scope
- 1.2. Market Segmentation
- 1.3. Research Objective
- 1.4. Definitions and Assumptions
- 2. Executive Summary
- 2.1. Market Snapshot
- 3. Market Dynamics
- 3.1. Market Drivers
- 3.2. Market Restrains
- 3.3. Market Trends
- 3.4. Market Opportunities
- 4. Market Factor Analysis
- 4.1. Porters Five Forces
- 4.1.1. Bargaining Power of Suppliers
- 4.1.2. Bargaining Power of Buyers
- 4.1.3. Threat of New Entrants
- 4.1.4. Threat of Substitutes
- 4.1.5. Competitive Rivalry
- 4.2. PESTEL analysis
- 4.3. BCG Analysis
- 4.3.1. Stars (High Growth, High Market Share)
- 4.3.2. Cash Cows (Low Growth, High Market Share)
- 4.3.3. Question Mark (High Growth, Low Market Share)
- 4.3.4. Dogs (Low Growth, Low Market Share)
- 4.4. Ansoff Matrix Analysis
- 4.5. Supply Chain Analysis
- 4.6. Regulatory Landscape
- 4.7. Current Market Potential and Opportunity Assessment (TAM–SAM–SOM Framework)
- 4.8. MDP Analyst Note
- 4.1. Porters Five Forces
- 5. Market Analysis, Insights and Forecast 2021-2033
- 5.1. Market Analysis, Insights and Forecast - by Application
- 5.1.1. For Lab Samples
- 5.1.2. For Transport
- 5.2. Market Analysis, Insights and Forecast - by Types
- 5.2.1. High-capacity
- 5.2.2. Low-capacity
- 5.3. Market Analysis, Insights and Forecast - by Region
- 5.3.1. North America
- 5.3.2. South America
- 5.3.3. Europe
- 5.3.4. Middle East & Africa
- 5.3.5. Asia Pacific
- 5.1. Market Analysis, Insights and Forecast - by Application
- 6. Global Pneumatic Tube Carriers Analysis, Insights and Forecast, 2021-2033
- 6.1. Market Analysis, Insights and Forecast - by Application
- 6.1.1. For Lab Samples
- 6.1.2. For Transport
- 6.2. Market Analysis, Insights and Forecast - by Types
- 6.2.1. High-capacity
- 6.2.2. Low-capacity
- 6.1. Market Analysis, Insights and Forecast - by Application
- 7. North America Pneumatic Tube Carriers Analysis, Insights and Forecast, 2020-2032
- 7.1. Market Analysis, Insights and Forecast - by Application
- 7.1.1. For Lab Samples
- 7.1.2. For Transport
- 7.2. Market Analysis, Insights and Forecast - by Types
- 7.2.1. High-capacity
- 7.2.2. Low-capacity
- 7.1. Market Analysis, Insights and Forecast - by Application
- 8. South America Pneumatic Tube Carriers Analysis, Insights and Forecast, 2020-2032
- 8.1. Market Analysis, Insights and Forecast - by Application
- 8.1.1. For Lab Samples
- 8.1.2. For Transport
- 8.2. Market Analysis, Insights and Forecast - by Types
- 8.2.1. High-capacity
- 8.2.2. Low-capacity
- 8.1. Market Analysis, Insights and Forecast - by Application
- 9. Europe Pneumatic Tube Carriers Analysis, Insights and Forecast, 2020-2032
- 9.1. Market Analysis, Insights and Forecast - by Application
- 9.1.1. For Lab Samples
- 9.1.2. For Transport
- 9.2. Market Analysis, Insights and Forecast - by Types
- 9.2.1. High-capacity
- 9.2.2. Low-capacity
- 9.1. Market Analysis, Insights and Forecast - by Application
- 10. Middle East & Africa Pneumatic Tube Carriers Analysis, Insights and Forecast, 2020-2032
- 10.1. Market Analysis, Insights and Forecast - by Application
- 10.1.1. For Lab Samples
- 10.1.2. For Transport
- 10.2. Market Analysis, Insights and Forecast - by Types
- 10.2.1. High-capacity
- 10.2.2. Low-capacity
- 10.1. Market Analysis, Insights and Forecast - by Application
- 11. Asia Pacific Pneumatic Tube Carriers Analysis, Insights and Forecast, 2020-2032
- 11.1. Market Analysis, Insights and Forecast - by Application
- 11.1.1. For Lab Samples
- 11.1.2. For Transport
- 11.2. Market Analysis, Insights and Forecast - by Types
- 11.2.1. High-capacity
- 11.2.2. Low-capacity
- 11.1. Market Analysis, Insights and Forecast - by Application
- 12. Competitive Analysis
- 12.1. Company Profiles
- 12.1.1 Air-Log International GmbH
- 12.1.1.1. Company Overview
- 12.1.1.2. Products
- 12.1.1.3. Company Financials
- 12.1.1.4. SWOT Analysis
- 12.1.2 Swisslog
- 12.1.2.1. Company Overview
- 12.1.2.2. Products
- 12.1.2.3. Company Financials
- 12.1.2.4. SWOT Analysis
- 12.1.3 Ing. Sumetzberger GMBH.
- 12.1.3.1. Company Overview
- 12.1.3.2. Products
- 12.1.3.3. Company Financials
- 12.1.3.4. SWOT Analysis
- 12.1.4 AIR LINK
- 12.1.4.1. Company Overview
- 12.1.4.2. Products
- 12.1.4.3. Company Financials
- 12.1.4.4. SWOT Analysis
- 12.1.5 Colombo Pneumatic Tube Systems
- 12.1.5.1. Company Overview
- 12.1.5.2. Products
- 12.1.5.3. Company Financials
- 12.1.5.4. SWOT Analysis
- 12.1.1 Air-Log International GmbH
- 12.2. Market Entropy
- 12.2.1 Company's Key Areas Served
- 12.2.2 Recent Developments
- 12.3. Company Market Share Analysis 2025
- 12.3.1 Top 5 Companies Market Share Analysis
- 12.3.2 Top 3 Companies Market Share Analysis
- 12.4. List of Potential Customers
- 13. Research Methodology
List of Figures
- Figure 1: Global Pneumatic Tube Carriers Revenue Breakdown (billion, %) by Region 2025 & 2033
- Figure 2: North America Pneumatic Tube Carriers Revenue (billion), by Application 2025 & 2033
- Figure 3: North America Pneumatic Tube Carriers Revenue Share (%), by Application 2025 & 2033
- Figure 4: North America Pneumatic Tube Carriers Revenue (billion), by Types 2025 & 2033
- Figure 5: North America Pneumatic Tube Carriers Revenue Share (%), by Types 2025 & 2033
- Figure 6: North America Pneumatic Tube Carriers Revenue (billion), by Country 2025 & 2033
- Figure 7: North America Pneumatic Tube Carriers Revenue Share (%), by Country 2025 & 2033
- Figure 8: South America Pneumatic Tube Carriers Revenue (billion), by Application 2025 & 2033
- Figure 9: South America Pneumatic Tube Carriers Revenue Share (%), by Application 2025 & 2033
- Figure 10: South America Pneumatic Tube Carriers Revenue (billion), by Types 2025 & 2033
- Figure 11: South America Pneumatic Tube Carriers Revenue Share (%), by Types 2025 & 2033
- Figure 12: South America Pneumatic Tube Carriers Revenue (billion), by Country 2025 & 2033
- Figure 13: South America Pneumatic Tube Carriers Revenue Share (%), by Country 2025 & 2033
- Figure 14: Europe Pneumatic Tube Carriers Revenue (billion), by Application 2025 & 2033
- Figure 15: Europe Pneumatic Tube Carriers Revenue Share (%), by Application 2025 & 2033
- Figure 16: Europe Pneumatic Tube Carriers Revenue (billion), by Types 2025 & 2033
- Figure 17: Europe Pneumatic Tube Carriers Revenue Share (%), by Types 2025 & 2033
- Figure 18: Europe Pneumatic Tube Carriers Revenue (billion), by Country 2025 & 2033
- Figure 19: Europe Pneumatic Tube Carriers Revenue Share (%), by Country 2025 & 2033
- Figure 20: Middle East & Africa Pneumatic Tube Carriers Revenue (billion), by Application 2025 & 2033
- Figure 21: Middle East & Africa Pneumatic Tube Carriers Revenue Share (%), by Application 2025 & 2033
- Figure 22: Middle East & Africa Pneumatic Tube Carriers Revenue (billion), by Types 2025 & 2033
- Figure 23: Middle East & Africa Pneumatic Tube Carriers Revenue Share (%), by Types 2025 & 2033
- Figure 24: Middle East & Africa Pneumatic Tube Carriers Revenue (billion), by Country 2025 & 2033
- Figure 25: Middle East & Africa Pneumatic Tube Carriers Revenue Share (%), by Country 2025 & 2033
- Figure 26: Asia Pacific Pneumatic Tube Carriers Revenue (billion), by Application 2025 & 2033
- Figure 27: Asia Pacific Pneumatic Tube Carriers Revenue Share (%), by Application 2025 & 2033
- Figure 28: Asia Pacific Pneumatic Tube Carriers Revenue (billion), by Types 2025 & 2033
- Figure 29: Asia Pacific Pneumatic Tube Carriers Revenue Share (%), by Types 2025 & 2033
- Figure 30: Asia Pacific Pneumatic Tube Carriers Revenue (billion), by Country 2025 & 2033
- Figure 31: Asia Pacific Pneumatic Tube Carriers Revenue Share (%), by Country 2025 & 2033
List of Tables
- Table 1: Global Pneumatic Tube Carriers Revenue billion Forecast, by Application 2020 & 2033
- Table 2: Global Pneumatic Tube Carriers Revenue billion Forecast, by Types 2020 & 2033
- Table 3: Global Pneumatic Tube Carriers Revenue billion Forecast, by Region 2020 & 2033
- Table 4: Global Pneumatic Tube Carriers Revenue billion Forecast, by Application 2020 & 2033
- Table 5: Global Pneumatic Tube Carriers Revenue billion Forecast, by Types 2020 & 2033
- Table 6: Global Pneumatic Tube Carriers Revenue billion Forecast, by Country 2020 & 2033
- Table 7: United States Pneumatic Tube Carriers Revenue (billion) Forecast, by Application 2020 & 2033
- Table 8: Canada Pneumatic Tube Carriers Revenue (billion) Forecast, by Application 2020 & 2033
- Table 9: Mexico Pneumatic Tube Carriers Revenue (billion) Forecast, by Application 2020 & 2033
- Table 10: Global Pneumatic Tube Carriers Revenue billion Forecast, by Application 2020 & 2033
- Table 11: Global Pneumatic Tube Carriers Revenue billion Forecast, by Types 2020 & 2033
- Table 12: Global Pneumatic Tube Carriers Revenue billion Forecast, by Country 2020 & 2033
- Table 13: Brazil Pneumatic Tube Carriers Revenue (billion) Forecast, by Application 2020 & 2033
- Table 14: Argentina Pneumatic Tube Carriers Revenue (billion) Forecast, by Application 2020 & 2033
- Table 15: Rest of South America Pneumatic Tube Carriers Revenue (billion) Forecast, by Application 2020 & 2033
- Table 16: Global Pneumatic Tube Carriers Revenue billion Forecast, by Application 2020 & 2033
- Table 17: Global Pneumatic Tube Carriers Revenue billion Forecast, by Types 2020 & 2033
- Table 18: Global Pneumatic Tube Carriers Revenue billion Forecast, by Country 2020 & 2033
- Table 19: United Kingdom Pneumatic Tube Carriers Revenue (billion) Forecast, by Application 2020 & 2033
- Table 20: Germany Pneumatic Tube Carriers Revenue (billion) Forecast, by Application 2020 & 2033
- Table 21: France Pneumatic Tube Carriers Revenue (billion) Forecast, by Application 2020 & 2033
- Table 22: Italy Pneumatic Tube Carriers Revenue (billion) Forecast, by Application 2020 & 2033
- Table 23: Spain Pneumatic Tube Carriers Revenue (billion) Forecast, by Application 2020 & 2033
- Table 24: Russia Pneumatic Tube Carriers Revenue (billion) Forecast, by Application 2020 & 2033
- Table 25: Benelux Pneumatic Tube Carriers Revenue (billion) Forecast, by Application 2020 & 2033
- Table 26: Nordics Pneumatic Tube Carriers Revenue (billion) Forecast, by Application 2020 & 2033
- Table 27: Rest of Europe Pneumatic Tube Carriers Revenue (billion) Forecast, by Application 2020 & 2033
- Table 28: Global Pneumatic Tube Carriers Revenue billion Forecast, by Application 2020 & 2033
- Table 29: Global Pneumatic Tube Carriers Revenue billion Forecast, by Types 2020 & 2033
- Table 30: Global Pneumatic Tube Carriers Revenue billion Forecast, by Country 2020 & 2033
- Table 31: Turkey Pneumatic Tube Carriers Revenue (billion) Forecast, by Application 2020 & 2033
- Table 32: Israel Pneumatic Tube Carriers Revenue (billion) Forecast, by Application 2020 & 2033
- Table 33: GCC Pneumatic Tube Carriers Revenue (billion) Forecast, by Application 2020 & 2033
- Table 34: North Africa Pneumatic Tube Carriers Revenue (billion) Forecast, by Application 2020 & 2033
- Table 35: South Africa Pneumatic Tube Carriers Revenue (billion) Forecast, by Application 2020 & 2033
- Table 36: Rest of Middle East & Africa Pneumatic Tube Carriers Revenue (billion) Forecast, by Application 2020 & 2033
- Table 37: Global Pneumatic Tube Carriers Revenue billion Forecast, by Application 2020 & 2033
- Table 38: Global Pneumatic Tube Carriers Revenue billion Forecast, by Types 2020 & 2033
- Table 39: Global Pneumatic Tube Carriers Revenue billion Forecast, by Country 2020 & 2033
- Table 40: China Pneumatic Tube Carriers Revenue (billion) Forecast, by Application 2020 & 2033
- Table 41: India Pneumatic Tube Carriers Revenue (billion) Forecast, by Application 2020 & 2033
- Table 42: Japan Pneumatic Tube Carriers Revenue (billion) Forecast, by Application 2020 & 2033
- Table 43: South Korea Pneumatic Tube Carriers Revenue (billion) Forecast, by Application 2020 & 2033
- Table 44: ASEAN Pneumatic Tube Carriers Revenue (billion) Forecast, by Application 2020 & 2033
- Table 45: Oceania Pneumatic Tube Carriers Revenue (billion) Forecast, by Application 2020 & 2033
- Table 46: Rest of Asia Pacific Pneumatic Tube Carriers Revenue (billion) Forecast, by Application 2020 & 2033
Frequently Asked Questions
1. What is the projected Compound Annual Growth Rate (CAGR) of the Pneumatic Tube Carriers?
The projected CAGR is approximately 7.74%.
2. Which companies are prominent players in the Pneumatic Tube Carriers?
Key companies in the market include Air-Log International GmbH, Swisslog, Ing. Sumetzberger GMBH., AIR LINK, Colombo Pneumatic Tube Systems.
3. What are the main segments of the Pneumatic Tube Carriers?
The market segments include Application, Types.
4. Can you provide details about the market size?
The market size is estimated to be USD 14.87 billion as of 2022.
5. What are some drivers contributing to market growth?
N/A
6. What are the notable trends driving market growth?
N/A
7. Are there any restraints impacting market growth?
N/A
8. Can you provide examples of recent developments in the market?
N/A
9. What pricing options are available for accessing the report?
Pricing options include single-user, multi-user, and enterprise licenses priced at USD 2900.00, USD 4350.00, and USD 5800.00 respectively.
10. Is the market size provided in terms of value or volume?
The market size is provided in terms of value, measured in billion.
11. Are there any specific market keywords associated with the report?
Yes, the market keyword associated with the report is "Pneumatic Tube Carriers," which aids in identifying and referencing the specific market segment covered.
12. How do I determine which pricing option suits my needs best?
The pricing options vary based on user requirements and access needs. Individual users may opt for single-user licenses, while businesses requiring broader access may choose multi-user or enterprise licenses for cost-effective access to the report.
13. Are there any additional resources or data provided in the Pneumatic Tube Carriers report?
While the report offers comprehensive insights, it's advisable to review the specific contents or supplementary materials provided to ascertain if additional resources or data are available.
14. How can I stay updated on further developments or reports in the Pneumatic Tube Carriers?
To stay informed about further developments, trends, and reports in the Pneumatic Tube Carriers, consider subscribing to industry newsletters, following relevant companies and organizations, or regularly checking reputable industry news sources and publications.
Methodology
Step 1 - Identification of Relevant Samples Size from Population Database


Step 2 - Approaches for Defining Global Market Size (Value, Volume* & Price*)

Note*: In applicable scenarios
Step 3 - Data Sources
Primary Research
- Web Analytics
- Survey Reports
- Research Institute
- Latest Research Reports
- Opinion Leaders
Secondary Research
- Annual Reports
- White Paper
- Latest Press Release
- Industry Association
- Paid Database
- Investor Presentations

Step 4 - Data Triangulation
Involves using different sources of information in order to increase the validity of a study
These sources are likely to be stakeholders in a program - participants, other researchers, program staff, other community members, and so on.
Then we put all data in single framework & apply various statistical tools to find out the dynamic on the market.
During the analysis stage, feedback from the stakeholder groups would be compared to determine areas of agreement as well as areas of divergence