

Key Insights
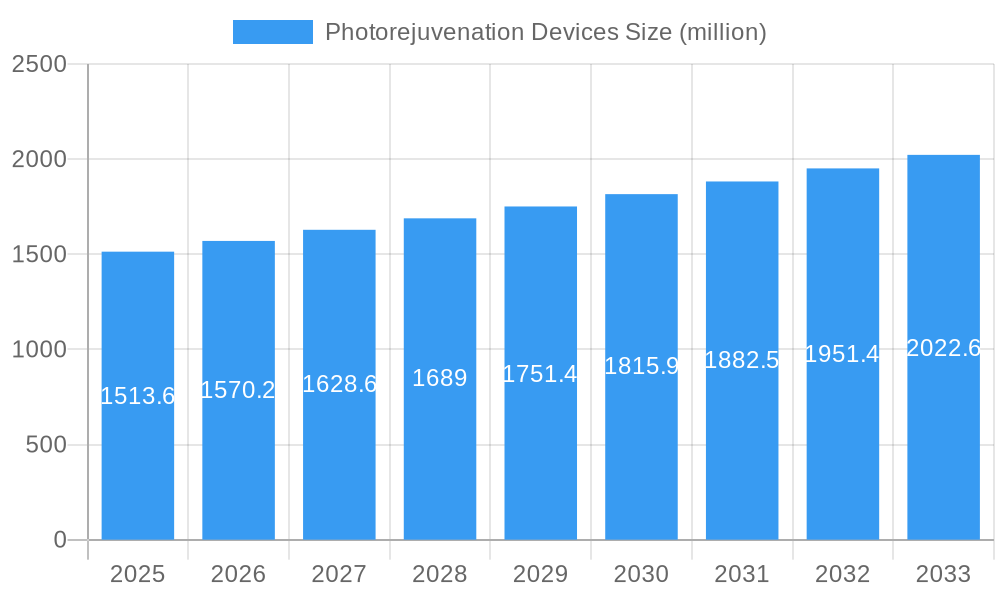
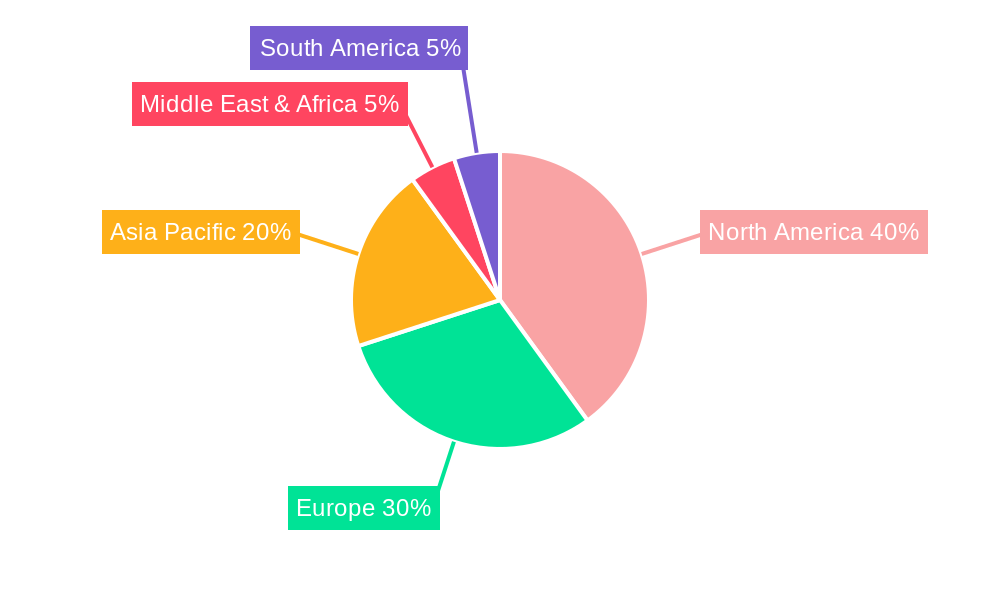
The global photorejuvenation devices market, valued at $1513.6 million in 2025, is projected to experience steady growth, driven by rising prevalence of skin aging and pigmentation disorders, increasing demand for minimally invasive cosmetic procedures, and technological advancements leading to more effective and safer devices. The market's Compound Annual Growth Rate (CAGR) of 3.7% from 2025 to 2033 indicates a continuous, albeit moderate, expansion. Key drivers include the growing adoption of IPL and laser technologies in dermatology clinics and hospitals, along with the increasing popularity of home-care photorejuvenation devices fueled by rising consumer awareness and accessibility. The segmentation reveals a strong preference for IPL and laser equipment, signifying their efficacy and widespread acceptance. However, market growth might face certain restraints such as high initial investment costs associated with acquiring advanced devices, potential side effects of certain treatments, and the emergence of alternative aesthetic procedures. The geographical distribution shows a significant market share held by North America, driven by high disposable income, established healthcare infrastructure, and early adoption of advanced technologies. However, other regions, such as Asia Pacific, are poised for substantial growth due to increasing healthcare expenditure and rising awareness about aesthetic treatments. Competition among established players like Hologic Inc. (Cynosure, Inc.), Lumenis, and Syneron Medical Ltd., alongside emerging players, ensures market dynamism and innovation.
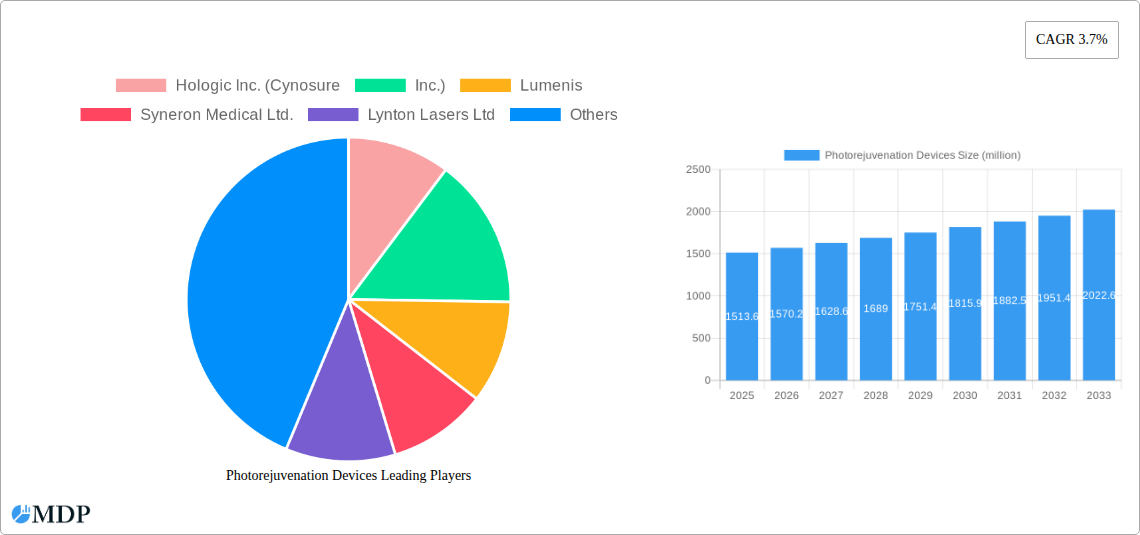
Photorejuvenation Devices Market Size (In Billion)
The forecast for the photorejuvenation devices market suggests continued expansion across various segments. The increasing adoption of non-ablative fractional lasers, offering improved precision and reduced downtime, will likely drive this segment's growth. The rise of LED equipment, offering a more affordable and less intense alternative, is also anticipated to contribute to market expansion. The future will likely witness a focus on technological improvements resulting in higher efficacy, shorter treatment times, and minimized side effects. Furthermore, the market will likely see increased integration of AI and data analytics in device development and treatment planning. Expansion into emerging economies with burgeoning middle classes will further fuel market growth, creating new opportunities for existing and emerging players. The strategic partnerships and collaborations amongst market players will likely accelerate product development and market penetration.
Photorejuvenation Devices Company Market Share
Photorejuvenation Devices Market Report: 2019-2033
This comprehensive report provides an in-depth analysis of the global photorejuvenation devices market, offering valuable insights for stakeholders across the industry. With a study period spanning 2019-2033, a base year of 2025, and a forecast period of 2025-2033, this report meticulously examines market dynamics, trends, leading players, and future opportunities. The market, valued at $xx million in 2025, is projected to reach $xx million by 2033, exhibiting a CAGR of xx%. This report is indispensable for investors, manufacturers, distributors, and anyone seeking a comprehensive understanding of this rapidly evolving sector.
Photorejuvenation Devices Market Dynamics & Concentration
The global photorejuvenation devices market is characterized by a moderately concentrated landscape, with key players such as Hologic Inc. (Cynosure,Inc.), Lumenis, Syneron Medical Ltd., Lynton Lasers Ltd, EL.EN. S.p.A. (Deka Mela S.r.l.), Fotona, Cutera,Inc., Lutronic Corporation, Beijing Nubway S & T Co.,Ltd, and LISA Laser Products holding significant market share. Innovation drives market growth, particularly in non-ablative fractional lasers and IPL technologies offering improved efficacy and reduced downtime. Stringent regulatory frameworks, varying across regions, influence market access and product approvals. Substitute treatments, such as chemical peels and microdermabrasion, exert competitive pressure. Increasing consumer demand for minimally invasive cosmetic procedures fuels market expansion, especially in the dermatology clinic and hospital segments. The historical period (2019-2024) witnessed xx M&A deals, indicating a consolidative trend, with larger companies acquiring smaller players to expand their product portfolios and geographic reach. Market share in 2025 is estimated as follows:
- Hologic Inc. (Cynosure,Inc.): xx%
- Lumenis: xx%
- Syneron Medical Ltd.: xx%
- Other Players: xx%
Photorejuvenation Devices Industry Trends & Analysis
The photorejuvenation devices market exhibits robust growth driven by rising awareness of aesthetic treatments, an aging global population, and increasing disposable incomes. Technological advancements, particularly in laser and IPL technologies, are leading to more effective and safer treatments with minimal side effects. Consumer preferences are shifting towards non-invasive procedures with shorter recovery times, fueling demand for non-ablative fractional lasers and LED devices. The market is experiencing significant competitive dynamics, with companies focusing on product innovation, strategic partnerships, and geographic expansion. The increasing adoption of technologically advanced photorejuvenation devices is also significantly driving the market growth. The market is expected to witness a substantial growth owing to the increasing number of treatment centers and improving healthcare infrastructure across the globe. The market is witnessing a high rate of technological advancements, and players in the market are focused on launching innovative products. The market is expected to witness an upward trend due to the increasing adoption of non-invasive cosmetic procedures. The competitive landscape is intensely competitive, and market players are focusing on providing high-quality products at competitive prices. The CAGR for the forecast period (2025-2033) is projected at xx%, with market penetration expected to reach xx% by 2033.
Leading Markets & Segments in Photorejuvenation Devices
The North American region currently dominates the photorejuvenation devices market, followed by Europe and Asia Pacific. Within these regions, hospitals and dermatology clinics represent the largest application segments, driven by high treatment volumes and advanced infrastructure. The Intense Pulsed Light (IPL) segment holds a significant market share due to its versatility and cost-effectiveness. Key drivers in leading markets include:
North America: High adoption rates of aesthetic procedures, well-established healthcare infrastructure, and high disposable incomes.
Europe: Growing awareness of non-invasive cosmetic treatments, increasing geriatric population and government initiatives promoting healthcare sector.
Asia Pacific: Rapidly expanding middle class, rising disposable incomes, and increasing demand for advanced medical technologies.
Hospitals: High patient volumes, skilled medical professionals, and advanced equipment capabilities.
Dermatology Clinics: Specialized expertise in skin treatments, personalized care, and convenient access.
Home Care Settings: Convenience, affordability, and increasing availability of at-home devices.
IPL: Versatility in treating various skin conditions, cost-effectiveness, and ease of use.
Laser Equipment: High precision, targeted treatment, and superior results for specific skin concerns.
Non-ablative Fractional Laser: Minimal downtime, reduced risk of side effects, and improved patient experience.
LED Equipment: Non-invasive, painless treatment, suitable for various skin types and conditions, and cost-effectiveness.
Photorejuvenation Devices Product Developments
Recent product developments focus on enhancing efficacy, minimizing downtime, and improving patient comfort. Innovations include advanced cooling systems for increased patient comfort during treatments, enhanced pulse delivery systems for improved precision and efficacy, and the integration of AI and machine learning for personalized treatment planning. These advancements cater to the growing demand for safe, effective, and minimally invasive aesthetic procedures. New devices are also being designed with better ergonomics and user-friendliness.
Key Drivers of Photorejuvenation Devices Growth
Several factors drive the growth of the photorejuvenation devices market:
- Technological advancements: Development of more effective and safer devices with minimal side effects.
- Increasing disposable incomes: Growth in affordability of aesthetic procedures.
- Aging population: Rise in the number of individuals seeking anti-aging solutions.
- Growing awareness of aesthetic treatments: Increased acceptance of non-invasive cosmetic procedures.
- Favorable regulatory environment: Approvals and supportive guidelines for new devices.
Challenges in the Photorejuvenation Devices Market
The market faces challenges including:
- Stringent regulatory approvals: Time-consuming and expensive processes for obtaining regulatory clearances.
- High initial investment costs: Expensive equipment requiring significant upfront investment.
- Intense competition: Presence of many established and emerging players.
- Supply chain disruptions: Potential for delays in the procurement of essential components and materials.
Emerging Opportunities in Photorejuvenation Devices
Emerging opportunities include:
- Technological breakthroughs: Development of innovative technologies such as AI-powered treatment planning and personalized therapies.
- Strategic partnerships: Collaborations between device manufacturers and healthcare providers to expand market reach.
- Market expansion: Growth in developing economies with increasing disposable incomes.
- Focus on home-use devices: Growing demand for convenient and affordable at-home treatments.
Leading Players in the Photorejuvenation Devices Sector
- Hologic Inc. (Cynosure,Inc.)
- Lumenis
- Syneron Medical Ltd.
- Lynton Lasers Ltd
- EL.EN. S.p.A. (Deka Mela S.r.l.)
- Fotona
- Cutera,Inc.
- Lutronic Corporation
- Beijing Nubway S & T Co.,Ltd
- LISA Laser Products
Key Milestones in Photorejuvenation Devices Industry
- 2020-Q4: Launch of a new non-ablative fractional laser by Lumenis.
- 2021-Q2: Acquisition of a smaller photorejuvenation device company by Syneron Medical Ltd.
- 2022-Q3: FDA approval of a new IPL device by Cutera,Inc.
- 2023-Q1: Strategic partnership between Hologic Inc. (Cynosure,Inc.) and a major dermatology clinic chain.
- 2024-Q4: Launch of an at-home photorejuvenation device by a new entrant in the market. (Specific details are not available)
Strategic Outlook for Photorejuvenation Devices Market
The photorejuvenation devices market holds immense potential for growth, driven by continuous technological advancements, increasing consumer demand, and expansion into emerging markets. Strategic opportunities lie in focusing on personalized treatment options, developing innovative devices with enhanced efficacy and safety, and fostering strategic partnerships to expand market reach. Companies that prioritize innovation, regulatory compliance, and customer satisfaction are poised to thrive in this dynamic market.
Photorejuvenation Devices Segmentation
-
1. Application
- 1.1. Hospitals
- 1.2. Dermatology Clinics
- 1.3. Home Care Settings
-
2. Types
- 2.1. Intense Pulsed Light (IPL)
- 2.2. Laser Equipment
- 2.3. Non-ablative Fractional Laser
- 2.4. LED Equipment
Photorejuvenation Devices Segmentation By Geography
-
1. North America
- 1.1. United States
- 1.2. Canada
- 1.3. Mexico
-
2. South America
- 2.1. Brazil
- 2.2. Argentina
- 2.3. Rest of South America
-
3. Europe
- 3.1. United Kingdom
- 3.2. Germany
- 3.3. France
- 3.4. Italy
- 3.5. Spain
- 3.6. Russia
- 3.7. Benelux
- 3.8. Nordics
- 3.9. Rest of Europe
-
4. Middle East & Africa
- 4.1. Turkey
- 4.2. Israel
- 4.3. GCC
- 4.4. North Africa
- 4.5. South Africa
- 4.6. Rest of Middle East & Africa
-
5. Asia Pacific
- 5.1. China
- 5.2. India
- 5.3. Japan
- 5.4. South Korea
- 5.5. ASEAN
- 5.6. Oceania
- 5.7. Rest of Asia Pacific
Photorejuvenation Devices Regional Market Share
Geographic Coverage of Photorejuvenation Devices
Photorejuvenation Devices REPORT HIGHLIGHTS
| Aspects | Details |
|---|---|
| Study Period | 2020-2034 |
| Base Year | 2025 |
| Estimated Year | 2026 |
| Forecast Period | 2026-2034 |
| Historical Period | 2020-2025 |
| Growth Rate | CAGR of 3.7% from 2020-2034 |
| Segmentation |
|
Table of Contents
- 1. Introduction
- 1.1. Research Scope
- 1.2. Market Segmentation
- 1.3. Research Objective
- 1.4. Definitions and Assumptions
- 2. Executive Summary
- 2.1. Market Snapshot
- 3. Market Dynamics
- 3.1. Market Drivers
- 3.2. Market Restrains
- 3.3. Market Trends
- 3.4. Market Opportunities
- 4. Market Factor Analysis
- 4.1. Porters Five Forces
- 4.1.1. Bargaining Power of Suppliers
- 4.1.2. Bargaining Power of Buyers
- 4.1.3. Threat of New Entrants
- 4.1.4. Threat of Substitutes
- 4.1.5. Competitive Rivalry
- 4.2. PESTEL analysis
- 4.3. BCG Analysis
- 4.3.1. Stars (High Growth, High Market Share)
- 4.3.2. Cash Cows (Low Growth, High Market Share)
- 4.3.3. Question Mark (High Growth, Low Market Share)
- 4.3.4. Dogs (Low Growth, Low Market Share)
- 4.4. Ansoff Matrix Analysis
- 4.5. Supply Chain Analysis
- 4.6. Regulatory Landscape
- 4.7. Current Market Potential and Opportunity Assessment (TAM–SAM–SOM Framework)
- 4.8. MDP Analyst Note
- 4.1. Porters Five Forces
- 5. Market Analysis, Insights and Forecast 2021-2033
- 5.1. Market Analysis, Insights and Forecast - by Application
- 5.1.1. Hospitals
- 5.1.2. Dermatology Clinics
- 5.1.3. Home Care Settings
- 5.2. Market Analysis, Insights and Forecast - by Types
- 5.2.1. Intense Pulsed Light (IPL)
- 5.2.2. Laser Equipment
- 5.2.3. Non-ablative Fractional Laser
- 5.2.4. LED Equipment
- 5.3. Market Analysis, Insights and Forecast - by Region
- 5.3.1. North America
- 5.3.2. South America
- 5.3.3. Europe
- 5.3.4. Middle East & Africa
- 5.3.5. Asia Pacific
- 5.1. Market Analysis, Insights and Forecast - by Application
- 6. Global Photorejuvenation Devices Analysis, Insights and Forecast, 2021-2033
- 6.1. Market Analysis, Insights and Forecast - by Application
- 6.1.1. Hospitals
- 6.1.2. Dermatology Clinics
- 6.1.3. Home Care Settings
- 6.2. Market Analysis, Insights and Forecast - by Types
- 6.2.1. Intense Pulsed Light (IPL)
- 6.2.2. Laser Equipment
- 6.2.3. Non-ablative Fractional Laser
- 6.2.4. LED Equipment
- 6.1. Market Analysis, Insights and Forecast - by Application
- 7. North America Photorejuvenation Devices Analysis, Insights and Forecast, 2020-2032
- 7.1. Market Analysis, Insights and Forecast - by Application
- 7.1.1. Hospitals
- 7.1.2. Dermatology Clinics
- 7.1.3. Home Care Settings
- 7.2. Market Analysis, Insights and Forecast - by Types
- 7.2.1. Intense Pulsed Light (IPL)
- 7.2.2. Laser Equipment
- 7.2.3. Non-ablative Fractional Laser
- 7.2.4. LED Equipment
- 7.1. Market Analysis, Insights and Forecast - by Application
- 8. South America Photorejuvenation Devices Analysis, Insights and Forecast, 2020-2032
- 8.1. Market Analysis, Insights and Forecast - by Application
- 8.1.1. Hospitals
- 8.1.2. Dermatology Clinics
- 8.1.3. Home Care Settings
- 8.2. Market Analysis, Insights and Forecast - by Types
- 8.2.1. Intense Pulsed Light (IPL)
- 8.2.2. Laser Equipment
- 8.2.3. Non-ablative Fractional Laser
- 8.2.4. LED Equipment
- 8.1. Market Analysis, Insights and Forecast - by Application
- 9. Europe Photorejuvenation Devices Analysis, Insights and Forecast, 2020-2032
- 9.1. Market Analysis, Insights and Forecast - by Application
- 9.1.1. Hospitals
- 9.1.2. Dermatology Clinics
- 9.1.3. Home Care Settings
- 9.2. Market Analysis, Insights and Forecast - by Types
- 9.2.1. Intense Pulsed Light (IPL)
- 9.2.2. Laser Equipment
- 9.2.3. Non-ablative Fractional Laser
- 9.2.4. LED Equipment
- 9.1. Market Analysis, Insights and Forecast - by Application
- 10. Middle East & Africa Photorejuvenation Devices Analysis, Insights and Forecast, 2020-2032
- 10.1. Market Analysis, Insights and Forecast - by Application
- 10.1.1. Hospitals
- 10.1.2. Dermatology Clinics
- 10.1.3. Home Care Settings
- 10.2. Market Analysis, Insights and Forecast - by Types
- 10.2.1. Intense Pulsed Light (IPL)
- 10.2.2. Laser Equipment
- 10.2.3. Non-ablative Fractional Laser
- 10.2.4. LED Equipment
- 10.1. Market Analysis, Insights and Forecast - by Application
- 11. Asia Pacific Photorejuvenation Devices Analysis, Insights and Forecast, 2020-2032
- 11.1. Market Analysis, Insights and Forecast - by Application
- 11.1.1. Hospitals
- 11.1.2. Dermatology Clinics
- 11.1.3. Home Care Settings
- 11.2. Market Analysis, Insights and Forecast - by Types
- 11.2.1. Intense Pulsed Light (IPL)
- 11.2.2. Laser Equipment
- 11.2.3. Non-ablative Fractional Laser
- 11.2.4. LED Equipment
- 11.1. Market Analysis, Insights and Forecast - by Application
- 12. Competitive Analysis
- 12.1. Company Profiles
- 12.1.1 Hologic Inc. (Cynosure
- 12.1.1.1. Company Overview
- 12.1.1.2. Products
- 12.1.1.3. Company Financials
- 12.1.1.4. SWOT Analysis
- 12.1.2 Inc.)
- 12.1.2.1. Company Overview
- 12.1.2.2. Products
- 12.1.2.3. Company Financials
- 12.1.2.4. SWOT Analysis
- 12.1.3 Lumenis
- 12.1.3.1. Company Overview
- 12.1.3.2. Products
- 12.1.3.3. Company Financials
- 12.1.3.4. SWOT Analysis
- 12.1.4 Syneron Medical Ltd.
- 12.1.4.1. Company Overview
- 12.1.4.2. Products
- 12.1.4.3. Company Financials
- 12.1.4.4. SWOT Analysis
- 12.1.5 Lynton Lasers Ltd
- 12.1.5.1. Company Overview
- 12.1.5.2. Products
- 12.1.5.3. Company Financials
- 12.1.5.4. SWOT Analysis
- 12.1.6 EL.EN. S.p.A. (Deka Mela S.r.l.)
- 12.1.6.1. Company Overview
- 12.1.6.2. Products
- 12.1.6.3. Company Financials
- 12.1.6.4. SWOT Analysis
- 12.1.7 Fotona
- 12.1.7.1. Company Overview
- 12.1.7.2. Products
- 12.1.7.3. Company Financials
- 12.1.7.4. SWOT Analysis
- 12.1.8 Cutera
- 12.1.8.1. Company Overview
- 12.1.8.2. Products
- 12.1.8.3. Company Financials
- 12.1.8.4. SWOT Analysis
- 12.1.9 Inc.
- 12.1.9.1. Company Overview
- 12.1.9.2. Products
- 12.1.9.3. Company Financials
- 12.1.9.4. SWOT Analysis
- 12.1.10 Lutronic Corporation
- 12.1.10.1. Company Overview
- 12.1.10.2. Products
- 12.1.10.3. Company Financials
- 12.1.10.4. SWOT Analysis
- 12.1.11 Beijing Nubway S & T Co.
- 12.1.11.1. Company Overview
- 12.1.11.2. Products
- 12.1.11.3. Company Financials
- 12.1.11.4. SWOT Analysis
- 12.1.12 Ltd
- 12.1.12.1. Company Overview
- 12.1.12.2. Products
- 12.1.12.3. Company Financials
- 12.1.12.4. SWOT Analysis
- 12.1.13 LISA Laser Products
- 12.1.13.1. Company Overview
- 12.1.13.2. Products
- 12.1.13.3. Company Financials
- 12.1.13.4. SWOT Analysis
- 12.1.1 Hologic Inc. (Cynosure
- 12.2. Market Entropy
- 12.2.1 Company's Key Areas Served
- 12.2.2 Recent Developments
- 12.3. Company Market Share Analysis 2025
- 12.3.1 Top 5 Companies Market Share Analysis
- 12.3.2 Top 3 Companies Market Share Analysis
- 12.4. List of Potential Customers
- 13. Research Methodology
List of Figures
- Figure 1: Global Photorejuvenation Devices Revenue Breakdown (million, %) by Region 2025 & 2033
- Figure 2: North America Photorejuvenation Devices Revenue (million), by Application 2025 & 2033
- Figure 3: North America Photorejuvenation Devices Revenue Share (%), by Application 2025 & 2033
- Figure 4: North America Photorejuvenation Devices Revenue (million), by Types 2025 & 2033
- Figure 5: North America Photorejuvenation Devices Revenue Share (%), by Types 2025 & 2033
- Figure 6: North America Photorejuvenation Devices Revenue (million), by Country 2025 & 2033
- Figure 7: North America Photorejuvenation Devices Revenue Share (%), by Country 2025 & 2033
- Figure 8: South America Photorejuvenation Devices Revenue (million), by Application 2025 & 2033
- Figure 9: South America Photorejuvenation Devices Revenue Share (%), by Application 2025 & 2033
- Figure 10: South America Photorejuvenation Devices Revenue (million), by Types 2025 & 2033
- Figure 11: South America Photorejuvenation Devices Revenue Share (%), by Types 2025 & 2033
- Figure 12: South America Photorejuvenation Devices Revenue (million), by Country 2025 & 2033
- Figure 13: South America Photorejuvenation Devices Revenue Share (%), by Country 2025 & 2033
- Figure 14: Europe Photorejuvenation Devices Revenue (million), by Application 2025 & 2033
- Figure 15: Europe Photorejuvenation Devices Revenue Share (%), by Application 2025 & 2033
- Figure 16: Europe Photorejuvenation Devices Revenue (million), by Types 2025 & 2033
- Figure 17: Europe Photorejuvenation Devices Revenue Share (%), by Types 2025 & 2033
- Figure 18: Europe Photorejuvenation Devices Revenue (million), by Country 2025 & 2033
- Figure 19: Europe Photorejuvenation Devices Revenue Share (%), by Country 2025 & 2033
- Figure 20: Middle East & Africa Photorejuvenation Devices Revenue (million), by Application 2025 & 2033
- Figure 21: Middle East & Africa Photorejuvenation Devices Revenue Share (%), by Application 2025 & 2033
- Figure 22: Middle East & Africa Photorejuvenation Devices Revenue (million), by Types 2025 & 2033
- Figure 23: Middle East & Africa Photorejuvenation Devices Revenue Share (%), by Types 2025 & 2033
- Figure 24: Middle East & Africa Photorejuvenation Devices Revenue (million), by Country 2025 & 2033
- Figure 25: Middle East & Africa Photorejuvenation Devices Revenue Share (%), by Country 2025 & 2033
- Figure 26: Asia Pacific Photorejuvenation Devices Revenue (million), by Application 2025 & 2033
- Figure 27: Asia Pacific Photorejuvenation Devices Revenue Share (%), by Application 2025 & 2033
- Figure 28: Asia Pacific Photorejuvenation Devices Revenue (million), by Types 2025 & 2033
- Figure 29: Asia Pacific Photorejuvenation Devices Revenue Share (%), by Types 2025 & 2033
- Figure 30: Asia Pacific Photorejuvenation Devices Revenue (million), by Country 2025 & 2033
- Figure 31: Asia Pacific Photorejuvenation Devices Revenue Share (%), by Country 2025 & 2033
List of Tables
- Table 1: Global Photorejuvenation Devices Revenue million Forecast, by Application 2020 & 2033
- Table 2: Global Photorejuvenation Devices Revenue million Forecast, by Types 2020 & 2033
- Table 3: Global Photorejuvenation Devices Revenue million Forecast, by Region 2020 & 2033
- Table 4: Global Photorejuvenation Devices Revenue million Forecast, by Application 2020 & 2033
- Table 5: Global Photorejuvenation Devices Revenue million Forecast, by Types 2020 & 2033
- Table 6: Global Photorejuvenation Devices Revenue million Forecast, by Country 2020 & 2033
- Table 7: United States Photorejuvenation Devices Revenue (million) Forecast, by Application 2020 & 2033
- Table 8: Canada Photorejuvenation Devices Revenue (million) Forecast, by Application 2020 & 2033
- Table 9: Mexico Photorejuvenation Devices Revenue (million) Forecast, by Application 2020 & 2033
- Table 10: Global Photorejuvenation Devices Revenue million Forecast, by Application 2020 & 2033
- Table 11: Global Photorejuvenation Devices Revenue million Forecast, by Types 2020 & 2033
- Table 12: Global Photorejuvenation Devices Revenue million Forecast, by Country 2020 & 2033
- Table 13: Brazil Photorejuvenation Devices Revenue (million) Forecast, by Application 2020 & 2033
- Table 14: Argentina Photorejuvenation Devices Revenue (million) Forecast, by Application 2020 & 2033
- Table 15: Rest of South America Photorejuvenation Devices Revenue (million) Forecast, by Application 2020 & 2033
- Table 16: Global Photorejuvenation Devices Revenue million Forecast, by Application 2020 & 2033
- Table 17: Global Photorejuvenation Devices Revenue million Forecast, by Types 2020 & 2033
- Table 18: Global Photorejuvenation Devices Revenue million Forecast, by Country 2020 & 2033
- Table 19: United Kingdom Photorejuvenation Devices Revenue (million) Forecast, by Application 2020 & 2033
- Table 20: Germany Photorejuvenation Devices Revenue (million) Forecast, by Application 2020 & 2033
- Table 21: France Photorejuvenation Devices Revenue (million) Forecast, by Application 2020 & 2033
- Table 22: Italy Photorejuvenation Devices Revenue (million) Forecast, by Application 2020 & 2033
- Table 23: Spain Photorejuvenation Devices Revenue (million) Forecast, by Application 2020 & 2033
- Table 24: Russia Photorejuvenation Devices Revenue (million) Forecast, by Application 2020 & 2033
- Table 25: Benelux Photorejuvenation Devices Revenue (million) Forecast, by Application 2020 & 2033
- Table 26: Nordics Photorejuvenation Devices Revenue (million) Forecast, by Application 2020 & 2033
- Table 27: Rest of Europe Photorejuvenation Devices Revenue (million) Forecast, by Application 2020 & 2033
- Table 28: Global Photorejuvenation Devices Revenue million Forecast, by Application 2020 & 2033
- Table 29: Global Photorejuvenation Devices Revenue million Forecast, by Types 2020 & 2033
- Table 30: Global Photorejuvenation Devices Revenue million Forecast, by Country 2020 & 2033
- Table 31: Turkey Photorejuvenation Devices Revenue (million) Forecast, by Application 2020 & 2033
- Table 32: Israel Photorejuvenation Devices Revenue (million) Forecast, by Application 2020 & 2033
- Table 33: GCC Photorejuvenation Devices Revenue (million) Forecast, by Application 2020 & 2033
- Table 34: North Africa Photorejuvenation Devices Revenue (million) Forecast, by Application 2020 & 2033
- Table 35: South Africa Photorejuvenation Devices Revenue (million) Forecast, by Application 2020 & 2033
- Table 36: Rest of Middle East & Africa Photorejuvenation Devices Revenue (million) Forecast, by Application 2020 & 2033
- Table 37: Global Photorejuvenation Devices Revenue million Forecast, by Application 2020 & 2033
- Table 38: Global Photorejuvenation Devices Revenue million Forecast, by Types 2020 & 2033
- Table 39: Global Photorejuvenation Devices Revenue million Forecast, by Country 2020 & 2033
- Table 40: China Photorejuvenation Devices Revenue (million) Forecast, by Application 2020 & 2033
- Table 41: India Photorejuvenation Devices Revenue (million) Forecast, by Application 2020 & 2033
- Table 42: Japan Photorejuvenation Devices Revenue (million) Forecast, by Application 2020 & 2033
- Table 43: South Korea Photorejuvenation Devices Revenue (million) Forecast, by Application 2020 & 2033
- Table 44: ASEAN Photorejuvenation Devices Revenue (million) Forecast, by Application 2020 & 2033
- Table 45: Oceania Photorejuvenation Devices Revenue (million) Forecast, by Application 2020 & 2033
- Table 46: Rest of Asia Pacific Photorejuvenation Devices Revenue (million) Forecast, by Application 2020 & 2033
Frequently Asked Questions
1. What is the projected Compound Annual Growth Rate (CAGR) of the Photorejuvenation Devices?
The projected CAGR is approximately 3.7%.
2. Which companies are prominent players in the Photorejuvenation Devices?
Key companies in the market include Hologic Inc. (Cynosure, Inc.), Lumenis, Syneron Medical Ltd., Lynton Lasers Ltd, EL.EN. S.p.A. (Deka Mela S.r.l.), Fotona, Cutera, Inc., Lutronic Corporation, Beijing Nubway S & T Co., Ltd, LISA Laser Products.
3. What are the main segments of the Photorejuvenation Devices?
The market segments include Application, Types.
4. Can you provide details about the market size?
The market size is estimated to be USD 1513.6 million as of 2022.
5. What are some drivers contributing to market growth?
N/A
6. What are the notable trends driving market growth?
N/A
7. Are there any restraints impacting market growth?
N/A
8. Can you provide examples of recent developments in the market?
N/A
9. What pricing options are available for accessing the report?
Pricing options include single-user, multi-user, and enterprise licenses priced at USD 2900.00, USD 4350.00, and USD 5800.00 respectively.
10. Is the market size provided in terms of value or volume?
The market size is provided in terms of value, measured in million.
11. Are there any specific market keywords associated with the report?
Yes, the market keyword associated with the report is "Photorejuvenation Devices," which aids in identifying and referencing the specific market segment covered.
12. How do I determine which pricing option suits my needs best?
The pricing options vary based on user requirements and access needs. Individual users may opt for single-user licenses, while businesses requiring broader access may choose multi-user or enterprise licenses for cost-effective access to the report.
13. Are there any additional resources or data provided in the Photorejuvenation Devices report?
While the report offers comprehensive insights, it's advisable to review the specific contents or supplementary materials provided to ascertain if additional resources or data are available.
14. How can I stay updated on further developments or reports in the Photorejuvenation Devices?
To stay informed about further developments, trends, and reports in the Photorejuvenation Devices, consider subscribing to industry newsletters, following relevant companies and organizations, or regularly checking reputable industry news sources and publications.
Methodology
Step 1 - Identification of Relevant Samples Size from Population Database


Step 2 - Approaches for Defining Global Market Size (Value, Volume* & Price*)

Note*: In applicable scenarios
Step 3 - Data Sources
Primary Research
- Web Analytics
- Survey Reports
- Research Institute
- Latest Research Reports
- Opinion Leaders
Secondary Research
- Annual Reports
- White Paper
- Latest Press Release
- Industry Association
- Paid Database
- Investor Presentations

Step 4 - Data Triangulation
Involves using different sources of information in order to increase the validity of a study
These sources are likely to be stakeholders in a program - participants, other researchers, program staff, other community members, and so on.
Then we put all data in single framework & apply various statistical tools to find out the dynamic on the market.
During the analysis stage, feedback from the stakeholder groups would be compared to determine areas of agreement as well as areas of divergence