

Key Insights
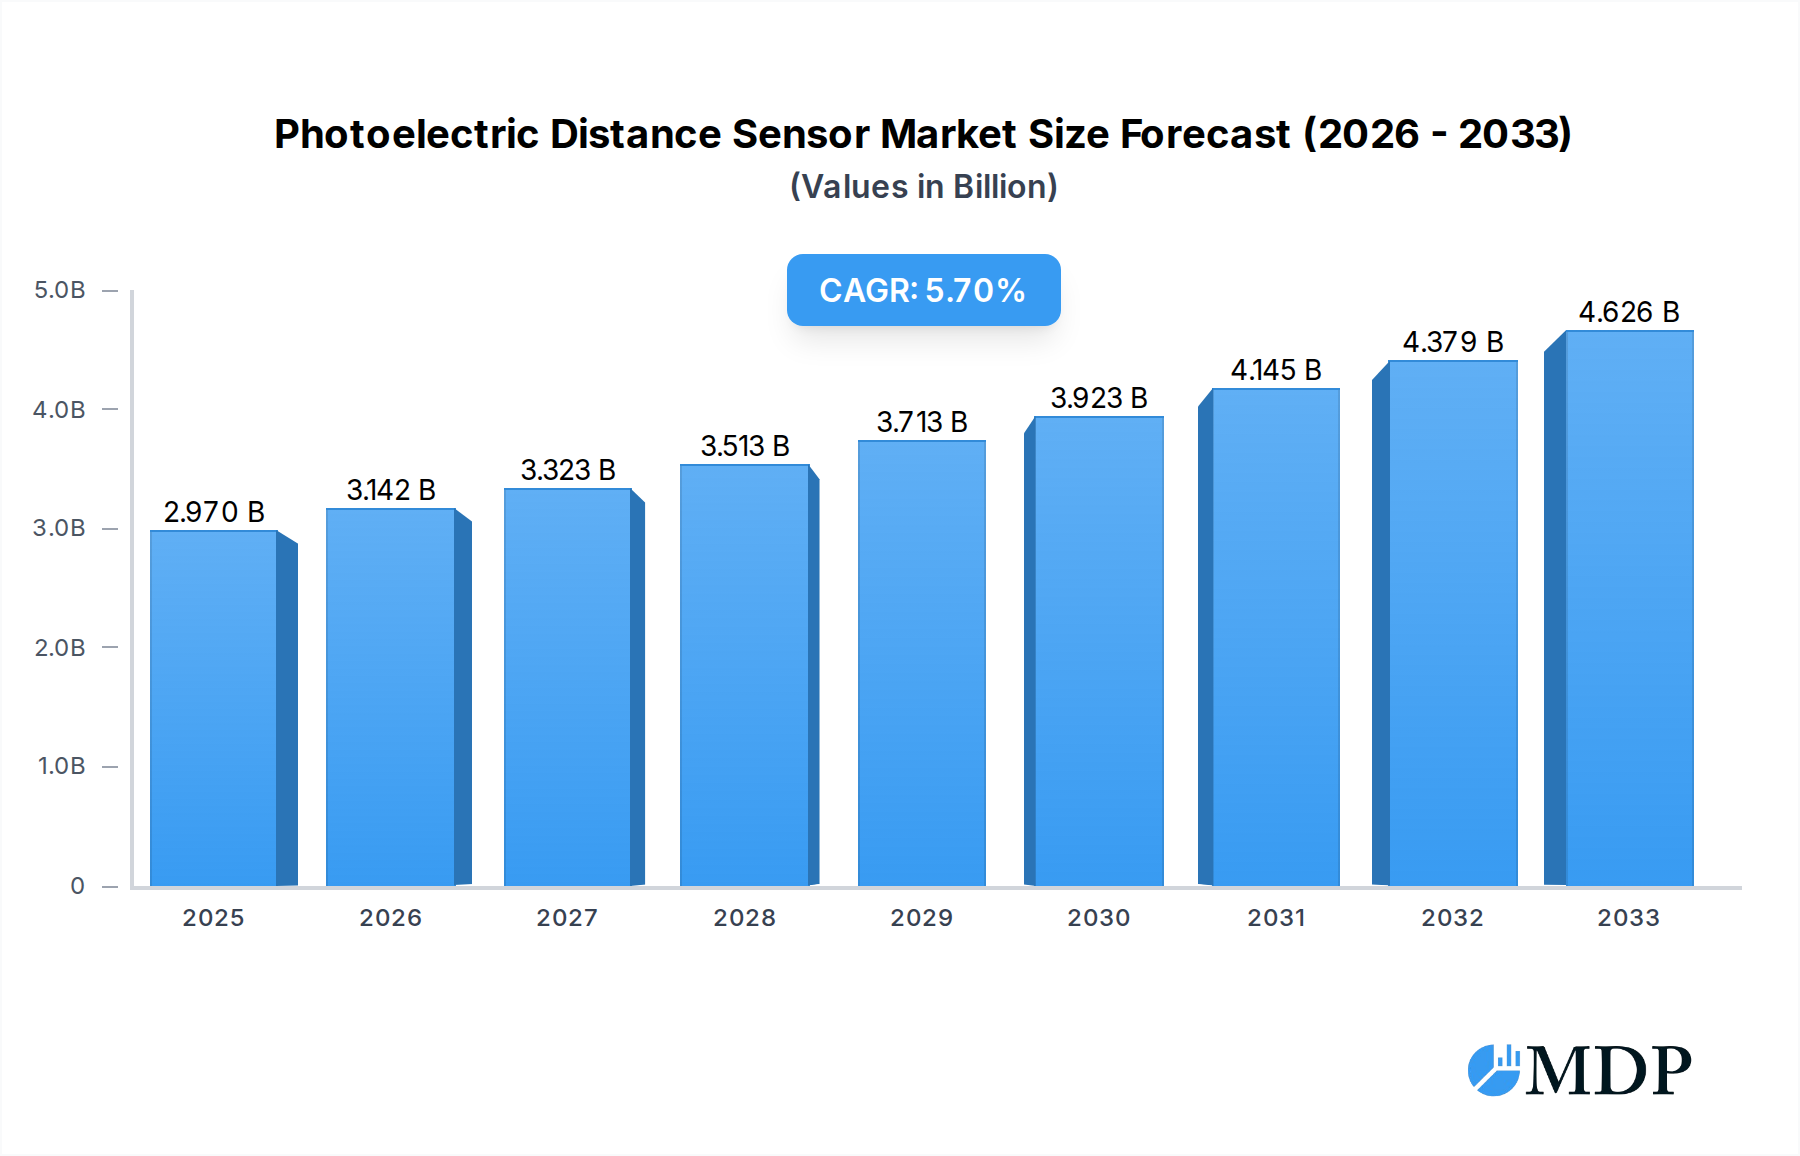
The global photoelectric distance sensor market is poised for substantial expansion, projected to reach USD 2.97 billion in 2025, driven by a robust CAGR of 5.65% throughout the forecast period of 2019-2033. This growth is underpinned by the increasing demand for automation and precision in manufacturing processes across various industries. Key drivers fueling this expansion include the burgeoning adoption of Industry 4.0 technologies, the continuous need for enhanced quality control, and the growing emphasis on operational efficiency. Sectors like Food & Beverage, Automotive, and Pharmaceutical are leading this charge, integrating photoelectric distance sensors for tasks ranging from object detection and measurement to precise positioning and defect identification. The technological advancements, particularly in sensor miniaturization, improved accuracy, and enhanced sensing capabilities like time-of-flight technology, are further stimulating market penetration.

Photoelectric Distance Sensor Market Size (In Billion)
The market is also experiencing significant growth due to the expanding applications in robotics, autonomous systems, and smart factory initiatives. As companies invest in upgrading their infrastructure to meet the demands of modern production, the reliance on sophisticated sensing solutions like photoelectric distance sensors will only intensify. Leading players such as OMRON, Panasonic, SICK, and Keyence are actively innovating, introducing advanced sensor solutions that offer greater reliability and versatility. While the market benefits from strong demand, potential restraints such as the high initial cost of sophisticated sensor systems and the need for skilled personnel for installation and maintenance could present challenges. However, the overarching trend towards digitalization and automation, coupled with increasing investments in R&D, is expected to outweigh these limitations, ensuring a dynamic and growing market landscape for photoelectric distance sensors.
Photoelectric Distance Sensor Company Market Share
Comprehensive Photoelectric Distance Sensor Market Report: Trends, Opportunities, and Leading Players (2019–2033)
This in-depth report provides a detailed analysis of the global Photoelectric Distance Sensor market, encompassing market dynamics, industry trends, leading segments, product innovations, growth drivers, challenges, emerging opportunities, key players, and strategic outlook. Covering a study period from 2019 to 2033, with a base and estimated year of 2025, and a forecast period from 2025 to 2033, this report offers actionable insights for stakeholders looking to navigate and capitalize on this rapidly evolving sector.
Photoelectric Distance Sensor Market Dynamics & Concentration
The global photoelectric distance sensor market exhibits a moderate to high concentration, with a few key players dominating a significant portion of the market share. Innovation is a primary driver, fueled by the increasing demand for precision automation across diverse industries. Companies are investing heavily in research and development to enhance sensor accuracy, range, and integration capabilities, particularly in areas like 10,000 mm measurement. Regulatory frameworks are generally supportive, focusing on safety and interoperability standards, though specific regional compliance can introduce complexity. Product substitutes, such as ultrasonic sensors or LiDAR, exist but often come with trade-offs in terms of cost, performance, or specific application suitability. End-user trends are strongly leaning towards industrial automation, Industry 4.0 adoption, and the Internet of Things (IoT), driving the need for reliable and intelligent sensing solutions. Merger and acquisition (M&A) activities are observed as companies seek to expand their product portfolios, gain market access, and consolidate their positions. For instance, the historical period (2019-2024) saw approximately xx M&A deals valued at over 1 billion. Market share distribution is heavily influenced by technological prowess and established distribution networks, with key players holding upwards of xx% of the market.
Photoelectric Distance Sensor Industry Trends & Analysis
The photoelectric distance sensor industry is poised for robust growth, driven by a confluence of factors. The relentless pursuit of operational efficiency and precision across manufacturing sectors, from Automotive to Food & Beverage and Pharmaceutical Industry, acts as a primary growth accelerator. Advancements in sensing technology, including the development of highly accurate and compact sensors capable of measuring up to 10,000 mm, are enabling new applications and enhancing existing ones. The increasing adoption of IoT and Industry 4.0 principles is further propelling demand, as these sensors become integral components of smart factories, facilitating real-time data collection and automated decision-making. Technological disruptions are constant, with ongoing innovations in signal processing, material science for improved durability, and enhanced environmental resistance broadening the application scope. Consumer preferences are shifting towards integrated solutions that offer ease of installation, seamless data connectivity, and advanced diagnostic capabilities. The competitive dynamics are characterized by intense R&D efforts, strategic partnerships, and a focus on cost optimization. The market penetration of advanced photoelectric distance sensors is expected to rise significantly, with a projected Compound Annual Growth Rate (CAGR) of xx% during the forecast period (2025–2033). The historical growth from 2019-2024 averaged a CAGR of xx%. Investments in smart manufacturing and automation infrastructure are expected to be in the billions globally, further stimulating market expansion.
Leading Markets & Segments in Photoelectric Distance Sensor
The Automotive segment stands out as a dominant force within the global photoelectric distance sensor market, driven by the industry's continuous evolution towards advanced driver-assistance systems (ADAS), automated manufacturing processes, and the burgeoning electric vehicle (EV) sector. The precision required for tasks such as assembly line monitoring, quality control, and robotic guidance is paramount, making photoelectric distance sensors indispensable. The Equipment Manufacturing segment also exhibits significant dominance, fueled by the global demand for sophisticated machinery in various industrial applications. Furthermore, the Electronic Industry is a substantial contributor, leveraging these sensors for high-precision placement, inspection, and automated assembly of electronic components. The Food & Beverage and Pharmaceutical Industry segments are rapidly growing, driven by stringent quality control, hygiene requirements, and the need for precise measurement in packaging and process automation.
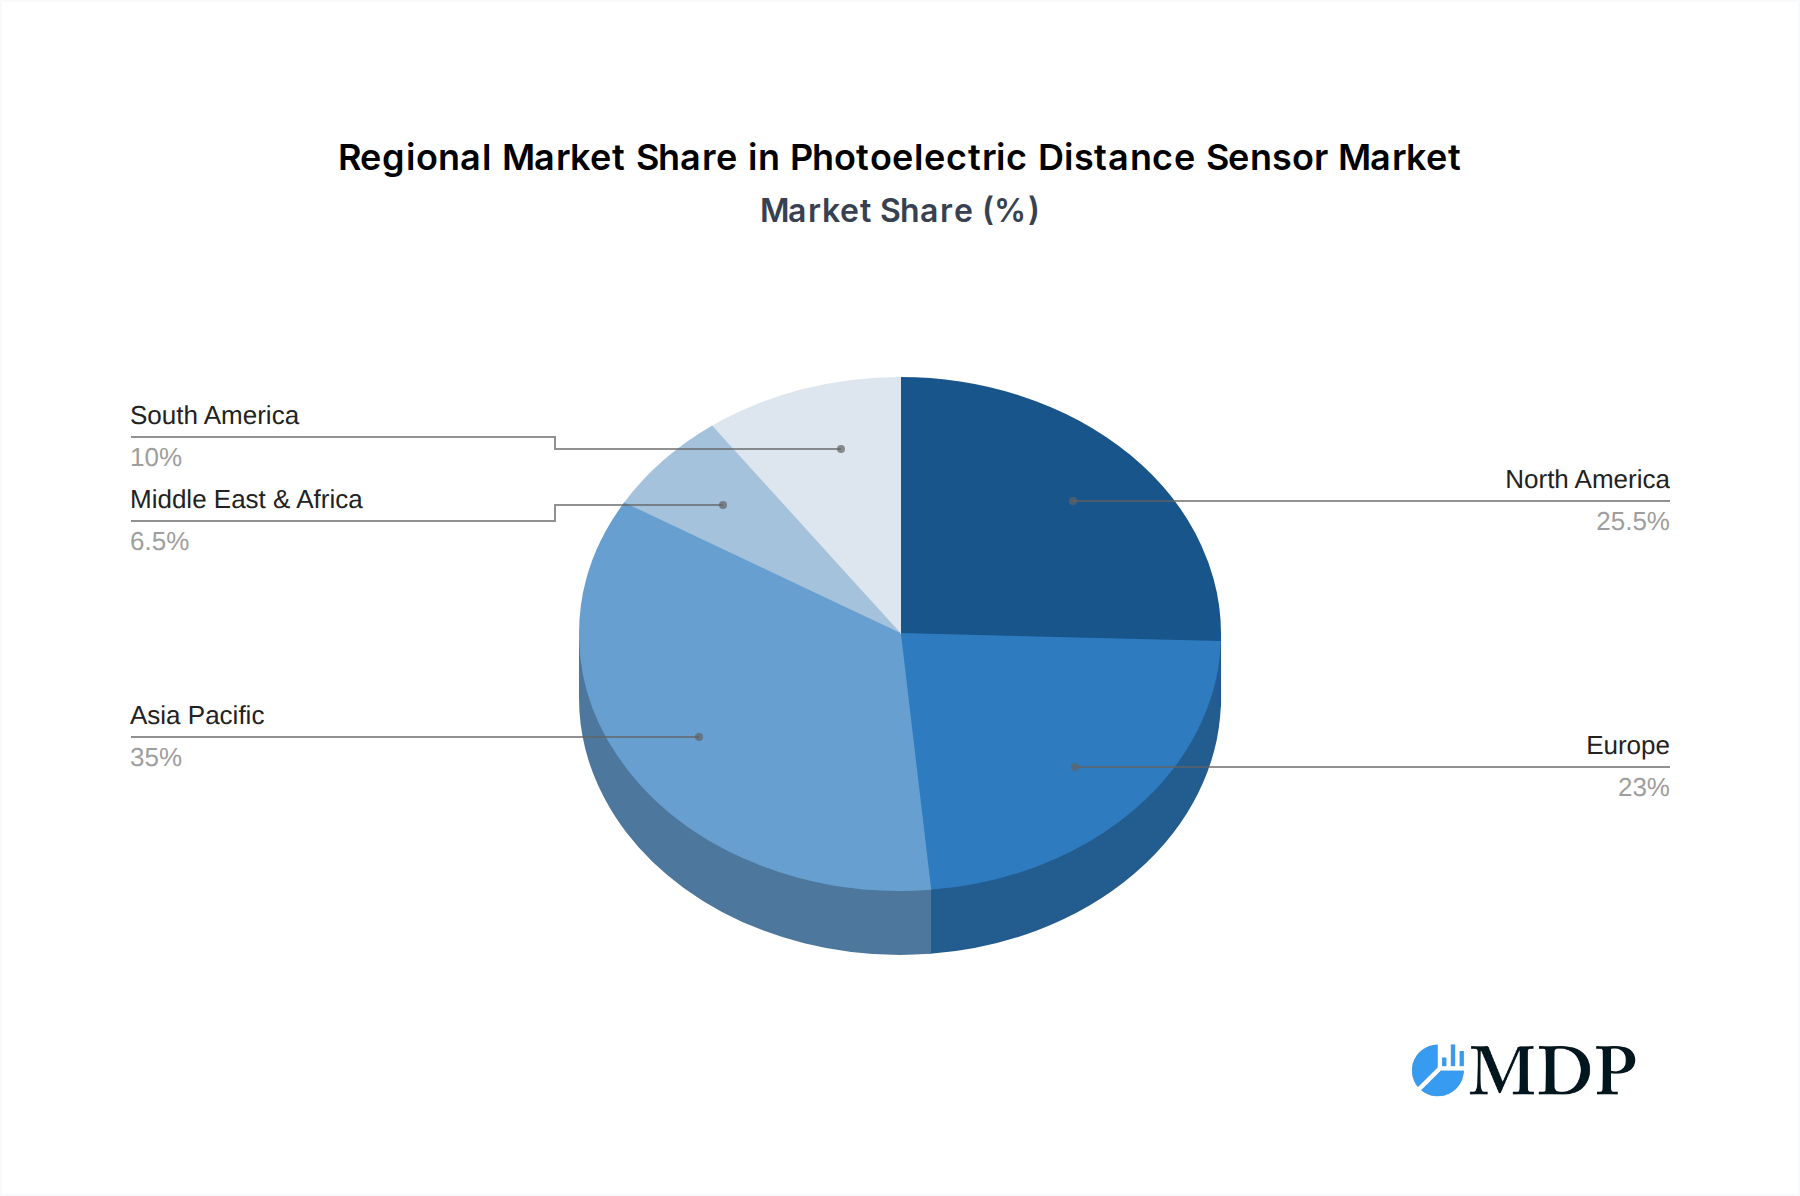
- Dominant Region: North America and Europe are leading regions, characterized by significant investments in automation and advanced manufacturing technologies. Asia Pacific, particularly China, is emerging as a rapidly growing market due to its vast manufacturing base and increasing adoption of Industry 4.0 initiatives.
- Dominant Country: The United States and Germany lead in terms of market share due to their strong automotive and industrial machinery manufacturing sectors. China is rapidly closing the gap due to its extensive industrialization and government support for automation.
- Dominant Application: The Automotive and Equipment Manufacturing segments are the primary revenue generators, with applications ranging from car body assembly to the manufacturing of complex industrial robots and machinery.
- Dominant Type: Sensors with a measuring range of 10,000 mm are increasingly in demand for applications requiring extended reach, such as large-scale automation projects and inventory management systems.
- Key Drivers for Dominance:
- Economic Policies: Government initiatives promoting industrial automation and advanced manufacturing technologies are crucial.
- Infrastructure Development: Robust industrial infrastructure supports the widespread adoption of automation solutions.
- Technological Advancement: Continuous innovation in sensor accuracy, reliability, and connectivity enhances their utility in demanding applications.
- Cost-Effectiveness: The increasing affordability and efficiency of photoelectric distance sensors compared to alternative technologies drive adoption.
- Demand for Precision: Industries requiring high precision in measurement and control are major adopters.
Photoelectric Distance Sensor Product Developments
Recent product developments in the photoelectric distance sensor market are characterized by advancements in sensor resolution, increased measuring ranges, and enhanced communication capabilities. Innovations are focusing on miniaturization for integration into tighter spaces, improved robustness for harsh industrial environments, and the development of smart sensors with embedded processing for real-time data analysis and predictive maintenance. These developments cater to the growing demand for precision automation in sectors like Automotive and Electronic Industry, offering competitive advantages through faster response times, reduced error rates, and seamless integration with existing automation systems. The availability of sensors capable of precise measurements up to 10,000 mm further expands their applicability in large-scale operations and logistics.
Key Drivers of Photoelectric Distance Sensor Growth
Several key factors are driving the growth of the photoelectric distance sensor market. The escalating adoption of Industry 4.0 and the Industrial Internet of Things (IIoT) is a paramount driver, necessitating intelligent and interconnected sensing solutions for automated factories. Technological advancements in sensor accuracy, speed, and reliability, particularly for ranges like 10,000 mm, are enabling new applications and improving existing ones. The increasing demand for precision automation in industries such as Automotive and Pharmaceutical Industry for quality control and process optimization is a significant catalyst. Furthermore, government initiatives promoting industrial modernization and automation, coupled with the growing need for energy-efficient manufacturing processes, contribute to sustained market expansion.
Challenges in the Photoelectric Distance Sensor Market
Despite the robust growth trajectory, the photoelectric distance sensor market faces several challenges. Intense price competition among manufacturers, particularly for standard sensor models, can impact profit margins. Supply chain disruptions, as witnessed in recent years, can lead to component shortages and increased lead times, affecting production schedules. Technological obsolescence is another concern, as rapid innovation necessitates continuous investment in R&D to remain competitive, potentially leading to higher upfront costs for newer technologies. The need for specialized integration expertise in certain complex applications can also act as a barrier for smaller enterprises. While regulatory frameworks are generally supportive, ensuring compliance with diverse international standards can add complexity and cost.
Emerging Opportunities in Photoelectric Distance Sensor
Emerging opportunities in the photoelectric distance sensor market are centered around the burgeoning fields of AI-driven automation and predictive maintenance. The integration of photoelectric sensors with AI algorithms allows for more sophisticated anomaly detection, real-time process optimization, and proactive equipment maintenance, significantly reducing downtime and operational costs. The expansion of smart logistics and warehouse automation presents a substantial growth avenue, with a demand for precise distance sensing in automated guided vehicles (AGVs), robotic arms, and inventory management systems, particularly for extended ranges like 10,000 mm. Strategic partnerships between sensor manufacturers and software providers are creating opportunities for developing comprehensive, end-to-end automation solutions. Furthermore, the increasing focus on sustainability and energy efficiency in manufacturing is driving demand for sensors that can contribute to optimized resource utilization.
Leading Players in the Photoelectric Distance Sensor Sector
- OMRON
- Panasonic
- SICK
- Keyence
- Rockwell Automation
- Balluff
- Optex
- Baumer
- Pepperl+Fuchs
- TAKEX
- Wenglor
- Schneider Electric
Key Milestones in Photoelectric Distance Sensor Industry
- 2019: Introduction of advanced diffuse reflective sensors with enhanced ambient light suppression.
- 2020: Launch of IoT-enabled photoelectric sensors with cloud connectivity for remote monitoring.
- 2021: Development of miniature photoelectric sensors with improved sensing distances for compact applications.
- 2022: Emergence of AI-integrated sensors capable of predictive maintenance in industrial settings.
- 2023: Significant advancements in laser triangulation sensors offering high-precision measurements up to 10,000 mm.
- 2024: Increased focus on robust sensor designs for extreme environmental conditions.
- 2025 (Projected): Introduction of highly integrated sensor solutions with advanced embedded analytics.
- 2026-2033 (Forecast): Continued evolution towards fully autonomous sensing systems and wider adoption across emerging industries.
Strategic Outlook for Photoelectric Distance Sensor Market
The strategic outlook for the photoelectric distance sensor market remains highly optimistic, driven by the accelerating global trend towards industrial automation and digital transformation. Growth accelerators include the continued innovation in sensor accuracy and intelligence, enabling more sophisticated control and monitoring across diverse applications, especially in sectors like Automotive and Electronic Industry. The increasing demand for integrated solutions that combine sensing with data analytics and AI will create significant opportunities for market expansion. Furthermore, the penetration of these sensors into emerging markets and new application areas, such as smart cities and advanced robotics, will fuel long-term growth. Strategic collaborations and investments in R&D will be crucial for players to maintain a competitive edge and capitalize on the evolving landscape of automated systems.
Photoelectric Distance Sensor Segmentation
-
1. Application
- 1.1. Food & Beverage
- 1.2. Automotive
- 1.3. Equipment Manufacturing
- 1.4. Pharmaceutical Industry
- 1.5. Electronic Industry
- 1.6. Others
-
2. Types
- 2.1. < 100 mm
- 2.2. 101 mm - 1,000 mm
- 2.3. 1,001 mm to 10,000 mm
- 2.4. >10,000 mm
Photoelectric Distance Sensor Segmentation By Geography
-
1. North America
- 1.1. United States
- 1.2. Canada
- 1.3. Mexico
-
2. South America
- 2.1. Brazil
- 2.2. Argentina
- 2.3. Rest of South America
-
3. Europe
- 3.1. United Kingdom
- 3.2. Germany
- 3.3. France
- 3.4. Italy
- 3.5. Spain
- 3.6. Russia
- 3.7. Benelux
- 3.8. Nordics
- 3.9. Rest of Europe
-
4. Middle East & Africa
- 4.1. Turkey
- 4.2. Israel
- 4.3. GCC
- 4.4. North Africa
- 4.5. South Africa
- 4.6. Rest of Middle East & Africa
-
5. Asia Pacific
- 5.1. China
- 5.2. India
- 5.3. Japan
- 5.4. South Korea
- 5.5. ASEAN
- 5.6. Oceania
- 5.7. Rest of Asia Pacific
Photoelectric Distance Sensor Regional Market Share
Geographic Coverage of Photoelectric Distance Sensor
Photoelectric Distance Sensor REPORT HIGHLIGHTS
| Aspects | Details |
|---|---|
| Study Period | 2020-2034 |
| Base Year | 2025 |
| Estimated Year | 2026 |
| Forecast Period | 2026-2034 |
| Historical Period | 2020-2025 |
| Growth Rate | CAGR of 5.65% from 2020-2034 |
| Segmentation |
|
Table of Contents
- 1. Introduction
- 1.1. Research Scope
- 1.2. Market Segmentation
- 1.3. Research Methodology
- 1.4. Definitions and Assumptions
- 2. Executive Summary
- 2.1. Introduction
- 3. Market Dynamics
- 3.1. Introduction
- 3.2. Market Drivers
- 3.3. Market Restrains
- 3.4. Market Trends
- 4. Market Factor Analysis
- 4.1. Porters Five Forces
- 4.2. Supply/Value Chain
- 4.3. PESTEL analysis
- 4.4. Market Entropy
- 4.5. Patent/Trademark Analysis
- 5. Global Photoelectric Distance Sensor Analysis, Insights and Forecast, 2020-2032
- 5.1. Market Analysis, Insights and Forecast - by Application
- 5.1.1. Food & Beverage
- 5.1.2. Automotive
- 5.1.3. Equipment Manufacturing
- 5.1.4. Pharmaceutical Industry
- 5.1.5. Electronic Industry
- 5.1.6. Others
- 5.2. Market Analysis, Insights and Forecast - by Types
- 5.2.1. < 100 mm
- 5.2.2. 101 mm - 1,000 mm
- 5.2.3. 1,001 mm to 10,000 mm
- 5.2.4. >10,000 mm
- 5.3. Market Analysis, Insights and Forecast - by Region
- 5.3.1. North America
- 5.3.2. South America
- 5.3.3. Europe
- 5.3.4. Middle East & Africa
- 5.3.5. Asia Pacific
- 5.1. Market Analysis, Insights and Forecast - by Application
- 6. North America Photoelectric Distance Sensor Analysis, Insights and Forecast, 2020-2032
- 6.1. Market Analysis, Insights and Forecast - by Application
- 6.1.1. Food & Beverage
- 6.1.2. Automotive
- 6.1.3. Equipment Manufacturing
- 6.1.4. Pharmaceutical Industry
- 6.1.5. Electronic Industry
- 6.1.6. Others
- 6.2. Market Analysis, Insights and Forecast - by Types
- 6.2.1. < 100 mm
- 6.2.2. 101 mm - 1,000 mm
- 6.2.3. 1,001 mm to 10,000 mm
- 6.2.4. >10,000 mm
- 6.1. Market Analysis, Insights and Forecast - by Application
- 7. South America Photoelectric Distance Sensor Analysis, Insights and Forecast, 2020-2032
- 7.1. Market Analysis, Insights and Forecast - by Application
- 7.1.1. Food & Beverage
- 7.1.2. Automotive
- 7.1.3. Equipment Manufacturing
- 7.1.4. Pharmaceutical Industry
- 7.1.5. Electronic Industry
- 7.1.6. Others
- 7.2. Market Analysis, Insights and Forecast - by Types
- 7.2.1. < 100 mm
- 7.2.2. 101 mm - 1,000 mm
- 7.2.3. 1,001 mm to 10,000 mm
- 7.2.4. >10,000 mm
- 7.1. Market Analysis, Insights and Forecast - by Application
- 8. Europe Photoelectric Distance Sensor Analysis, Insights and Forecast, 2020-2032
- 8.1. Market Analysis, Insights and Forecast - by Application
- 8.1.1. Food & Beverage
- 8.1.2. Automotive
- 8.1.3. Equipment Manufacturing
- 8.1.4. Pharmaceutical Industry
- 8.1.5. Electronic Industry
- 8.1.6. Others
- 8.2. Market Analysis, Insights and Forecast - by Types
- 8.2.1. < 100 mm
- 8.2.2. 101 mm - 1,000 mm
- 8.2.3. 1,001 mm to 10,000 mm
- 8.2.4. >10,000 mm
- 8.1. Market Analysis, Insights and Forecast - by Application
- 9. Middle East & Africa Photoelectric Distance Sensor Analysis, Insights and Forecast, 2020-2032
- 9.1. Market Analysis, Insights and Forecast - by Application
- 9.1.1. Food & Beverage
- 9.1.2. Automotive
- 9.1.3. Equipment Manufacturing
- 9.1.4. Pharmaceutical Industry
- 9.1.5. Electronic Industry
- 9.1.6. Others
- 9.2. Market Analysis, Insights and Forecast - by Types
- 9.2.1. < 100 mm
- 9.2.2. 101 mm - 1,000 mm
- 9.2.3. 1,001 mm to 10,000 mm
- 9.2.4. >10,000 mm
- 9.1. Market Analysis, Insights and Forecast - by Application
- 10. Asia Pacific Photoelectric Distance Sensor Analysis, Insights and Forecast, 2020-2032
- 10.1. Market Analysis, Insights and Forecast - by Application
- 10.1.1. Food & Beverage
- 10.1.2. Automotive
- 10.1.3. Equipment Manufacturing
- 10.1.4. Pharmaceutical Industry
- 10.1.5. Electronic Industry
- 10.1.6. Others
- 10.2. Market Analysis, Insights and Forecast - by Types
- 10.2.1. < 100 mm
- 10.2.2. 101 mm - 1,000 mm
- 10.2.3. 1,001 mm to 10,000 mm
- 10.2.4. >10,000 mm
- 10.1. Market Analysis, Insights and Forecast - by Application
- 11. Competitive Analysis
- 11.1. Global Market Share Analysis 2025
- 11.2. Company Profiles
- 11.2.1 OMRON
- 11.2.1.1. Overview
- 11.2.1.2. Products
- 11.2.1.3. SWOT Analysis
- 11.2.1.4. Recent Developments
- 11.2.1.5. Financials (Based on Availability)
- 11.2.2 Panasonic
- 11.2.2.1. Overview
- 11.2.2.2. Products
- 11.2.2.3. SWOT Analysis
- 11.2.2.4. Recent Developments
- 11.2.2.5. Financials (Based on Availability)
- 11.2.3 SICK
- 11.2.3.1. Overview
- 11.2.3.2. Products
- 11.2.3.3. SWOT Analysis
- 11.2.3.4. Recent Developments
- 11.2.3.5. Financials (Based on Availability)
- 11.2.4 Keyence
- 11.2.4.1. Overview
- 11.2.4.2. Products
- 11.2.4.3. SWOT Analysis
- 11.2.4.4. Recent Developments
- 11.2.4.5. Financials (Based on Availability)
- 11.2.5 Rockwell Automation
- 11.2.5.1. Overview
- 11.2.5.2. Products
- 11.2.5.3. SWOT Analysis
- 11.2.5.4. Recent Developments
- 11.2.5.5. Financials (Based on Availability)
- 11.2.6 Balluff
- 11.2.6.1. Overview
- 11.2.6.2. Products
- 11.2.6.3. SWOT Analysis
- 11.2.6.4. Recent Developments
- 11.2.6.5. Financials (Based on Availability)
- 11.2.7 Optex
- 11.2.7.1. Overview
- 11.2.7.2. Products
- 11.2.7.3. SWOT Analysis
- 11.2.7.4. Recent Developments
- 11.2.7.5. Financials (Based on Availability)
- 11.2.8 Baumer
- 11.2.8.1. Overview
- 11.2.8.2. Products
- 11.2.8.3. SWOT Analysis
- 11.2.8.4. Recent Developments
- 11.2.8.5. Financials (Based on Availability)
- 11.2.9 Pepperl+Fuchs
- 11.2.9.1. Overview
- 11.2.9.2. Products
- 11.2.9.3. SWOT Analysis
- 11.2.9.4. Recent Developments
- 11.2.9.5. Financials (Based on Availability)
- 11.2.10 TAKEX
- 11.2.10.1. Overview
- 11.2.10.2. Products
- 11.2.10.3. SWOT Analysis
- 11.2.10.4. Recent Developments
- 11.2.10.5. Financials (Based on Availability)
- 11.2.11 Wenglor
- 11.2.11.1. Overview
- 11.2.11.2. Products
- 11.2.11.3. SWOT Analysis
- 11.2.11.4. Recent Developments
- 11.2.11.5. Financials (Based on Availability)
- 11.2.12 Schneider Electric
- 11.2.12.1. Overview
- 11.2.12.2. Products
- 11.2.12.3. SWOT Analysis
- 11.2.12.4. Recent Developments
- 11.2.12.5. Financials (Based on Availability)
- 11.2.1 OMRON
List of Figures
- Figure 1: Global Photoelectric Distance Sensor Revenue Breakdown (undefined, %) by Region 2025 & 2033
- Figure 2: Global Photoelectric Distance Sensor Volume Breakdown (K, %) by Region 2025 & 2033
- Figure 3: North America Photoelectric Distance Sensor Revenue (undefined), by Application 2025 & 2033
- Figure 4: North America Photoelectric Distance Sensor Volume (K), by Application 2025 & 2033
- Figure 5: North America Photoelectric Distance Sensor Revenue Share (%), by Application 2025 & 2033
- Figure 6: North America Photoelectric Distance Sensor Volume Share (%), by Application 2025 & 2033
- Figure 7: North America Photoelectric Distance Sensor Revenue (undefined), by Types 2025 & 2033
- Figure 8: North America Photoelectric Distance Sensor Volume (K), by Types 2025 & 2033
- Figure 9: North America Photoelectric Distance Sensor Revenue Share (%), by Types 2025 & 2033
- Figure 10: North America Photoelectric Distance Sensor Volume Share (%), by Types 2025 & 2033
- Figure 11: North America Photoelectric Distance Sensor Revenue (undefined), by Country 2025 & 2033
- Figure 12: North America Photoelectric Distance Sensor Volume (K), by Country 2025 & 2033
- Figure 13: North America Photoelectric Distance Sensor Revenue Share (%), by Country 2025 & 2033
- Figure 14: North America Photoelectric Distance Sensor Volume Share (%), by Country 2025 & 2033
- Figure 15: South America Photoelectric Distance Sensor Revenue (undefined), by Application 2025 & 2033
- Figure 16: South America Photoelectric Distance Sensor Volume (K), by Application 2025 & 2033
- Figure 17: South America Photoelectric Distance Sensor Revenue Share (%), by Application 2025 & 2033
- Figure 18: South America Photoelectric Distance Sensor Volume Share (%), by Application 2025 & 2033
- Figure 19: South America Photoelectric Distance Sensor Revenue (undefined), by Types 2025 & 2033
- Figure 20: South America Photoelectric Distance Sensor Volume (K), by Types 2025 & 2033
- Figure 21: South America Photoelectric Distance Sensor Revenue Share (%), by Types 2025 & 2033
- Figure 22: South America Photoelectric Distance Sensor Volume Share (%), by Types 2025 & 2033
- Figure 23: South America Photoelectric Distance Sensor Revenue (undefined), by Country 2025 & 2033
- Figure 24: South America Photoelectric Distance Sensor Volume (K), by Country 2025 & 2033
- Figure 25: South America Photoelectric Distance Sensor Revenue Share (%), by Country 2025 & 2033
- Figure 26: South America Photoelectric Distance Sensor Volume Share (%), by Country 2025 & 2033
- Figure 27: Europe Photoelectric Distance Sensor Revenue (undefined), by Application 2025 & 2033
- Figure 28: Europe Photoelectric Distance Sensor Volume (K), by Application 2025 & 2033
- Figure 29: Europe Photoelectric Distance Sensor Revenue Share (%), by Application 2025 & 2033
- Figure 30: Europe Photoelectric Distance Sensor Volume Share (%), by Application 2025 & 2033
- Figure 31: Europe Photoelectric Distance Sensor Revenue (undefined), by Types 2025 & 2033
- Figure 32: Europe Photoelectric Distance Sensor Volume (K), by Types 2025 & 2033
- Figure 33: Europe Photoelectric Distance Sensor Revenue Share (%), by Types 2025 & 2033
- Figure 34: Europe Photoelectric Distance Sensor Volume Share (%), by Types 2025 & 2033
- Figure 35: Europe Photoelectric Distance Sensor Revenue (undefined), by Country 2025 & 2033
- Figure 36: Europe Photoelectric Distance Sensor Volume (K), by Country 2025 & 2033
- Figure 37: Europe Photoelectric Distance Sensor Revenue Share (%), by Country 2025 & 2033
- Figure 38: Europe Photoelectric Distance Sensor Volume Share (%), by Country 2025 & 2033
- Figure 39: Middle East & Africa Photoelectric Distance Sensor Revenue (undefined), by Application 2025 & 2033
- Figure 40: Middle East & Africa Photoelectric Distance Sensor Volume (K), by Application 2025 & 2033
- Figure 41: Middle East & Africa Photoelectric Distance Sensor Revenue Share (%), by Application 2025 & 2033
- Figure 42: Middle East & Africa Photoelectric Distance Sensor Volume Share (%), by Application 2025 & 2033
- Figure 43: Middle East & Africa Photoelectric Distance Sensor Revenue (undefined), by Types 2025 & 2033
- Figure 44: Middle East & Africa Photoelectric Distance Sensor Volume (K), by Types 2025 & 2033
- Figure 45: Middle East & Africa Photoelectric Distance Sensor Revenue Share (%), by Types 2025 & 2033
- Figure 46: Middle East & Africa Photoelectric Distance Sensor Volume Share (%), by Types 2025 & 2033
- Figure 47: Middle East & Africa Photoelectric Distance Sensor Revenue (undefined), by Country 2025 & 2033
- Figure 48: Middle East & Africa Photoelectric Distance Sensor Volume (K), by Country 2025 & 2033
- Figure 49: Middle East & Africa Photoelectric Distance Sensor Revenue Share (%), by Country 2025 & 2033
- Figure 50: Middle East & Africa Photoelectric Distance Sensor Volume Share (%), by Country 2025 & 2033
- Figure 51: Asia Pacific Photoelectric Distance Sensor Revenue (undefined), by Application 2025 & 2033
- Figure 52: Asia Pacific Photoelectric Distance Sensor Volume (K), by Application 2025 & 2033
- Figure 53: Asia Pacific Photoelectric Distance Sensor Revenue Share (%), by Application 2025 & 2033
- Figure 54: Asia Pacific Photoelectric Distance Sensor Volume Share (%), by Application 2025 & 2033
- Figure 55: Asia Pacific Photoelectric Distance Sensor Revenue (undefined), by Types 2025 & 2033
- Figure 56: Asia Pacific Photoelectric Distance Sensor Volume (K), by Types 2025 & 2033
- Figure 57: Asia Pacific Photoelectric Distance Sensor Revenue Share (%), by Types 2025 & 2033
- Figure 58: Asia Pacific Photoelectric Distance Sensor Volume Share (%), by Types 2025 & 2033
- Figure 59: Asia Pacific Photoelectric Distance Sensor Revenue (undefined), by Country 2025 & 2033
- Figure 60: Asia Pacific Photoelectric Distance Sensor Volume (K), by Country 2025 & 2033
- Figure 61: Asia Pacific Photoelectric Distance Sensor Revenue Share (%), by Country 2025 & 2033
- Figure 62: Asia Pacific Photoelectric Distance Sensor Volume Share (%), by Country 2025 & 2033
List of Tables
- Table 1: Global Photoelectric Distance Sensor Revenue undefined Forecast, by Application 2020 & 2033
- Table 2: Global Photoelectric Distance Sensor Volume K Forecast, by Application 2020 & 2033
- Table 3: Global Photoelectric Distance Sensor Revenue undefined Forecast, by Types 2020 & 2033
- Table 4: Global Photoelectric Distance Sensor Volume K Forecast, by Types 2020 & 2033
- Table 5: Global Photoelectric Distance Sensor Revenue undefined Forecast, by Region 2020 & 2033
- Table 6: Global Photoelectric Distance Sensor Volume K Forecast, by Region 2020 & 2033
- Table 7: Global Photoelectric Distance Sensor Revenue undefined Forecast, by Application 2020 & 2033
- Table 8: Global Photoelectric Distance Sensor Volume K Forecast, by Application 2020 & 2033
- Table 9: Global Photoelectric Distance Sensor Revenue undefined Forecast, by Types 2020 & 2033
- Table 10: Global Photoelectric Distance Sensor Volume K Forecast, by Types 2020 & 2033
- Table 11: Global Photoelectric Distance Sensor Revenue undefined Forecast, by Country 2020 & 2033
- Table 12: Global Photoelectric Distance Sensor Volume K Forecast, by Country 2020 & 2033
- Table 13: United States Photoelectric Distance Sensor Revenue (undefined) Forecast, by Application 2020 & 2033
- Table 14: United States Photoelectric Distance Sensor Volume (K) Forecast, by Application 2020 & 2033
- Table 15: Canada Photoelectric Distance Sensor Revenue (undefined) Forecast, by Application 2020 & 2033
- Table 16: Canada Photoelectric Distance Sensor Volume (K) Forecast, by Application 2020 & 2033
- Table 17: Mexico Photoelectric Distance Sensor Revenue (undefined) Forecast, by Application 2020 & 2033
- Table 18: Mexico Photoelectric Distance Sensor Volume (K) Forecast, by Application 2020 & 2033
- Table 19: Global Photoelectric Distance Sensor Revenue undefined Forecast, by Application 2020 & 2033
- Table 20: Global Photoelectric Distance Sensor Volume K Forecast, by Application 2020 & 2033
- Table 21: Global Photoelectric Distance Sensor Revenue undefined Forecast, by Types 2020 & 2033
- Table 22: Global Photoelectric Distance Sensor Volume K Forecast, by Types 2020 & 2033
- Table 23: Global Photoelectric Distance Sensor Revenue undefined Forecast, by Country 2020 & 2033
- Table 24: Global Photoelectric Distance Sensor Volume K Forecast, by Country 2020 & 2033
- Table 25: Brazil Photoelectric Distance Sensor Revenue (undefined) Forecast, by Application 2020 & 2033
- Table 26: Brazil Photoelectric Distance Sensor Volume (K) Forecast, by Application 2020 & 2033
- Table 27: Argentina Photoelectric Distance Sensor Revenue (undefined) Forecast, by Application 2020 & 2033
- Table 28: Argentina Photoelectric Distance Sensor Volume (K) Forecast, by Application 2020 & 2033
- Table 29: Rest of South America Photoelectric Distance Sensor Revenue (undefined) Forecast, by Application 2020 & 2033
- Table 30: Rest of South America Photoelectric Distance Sensor Volume (K) Forecast, by Application 2020 & 2033
- Table 31: Global Photoelectric Distance Sensor Revenue undefined Forecast, by Application 2020 & 2033
- Table 32: Global Photoelectric Distance Sensor Volume K Forecast, by Application 2020 & 2033
- Table 33: Global Photoelectric Distance Sensor Revenue undefined Forecast, by Types 2020 & 2033
- Table 34: Global Photoelectric Distance Sensor Volume K Forecast, by Types 2020 & 2033
- Table 35: Global Photoelectric Distance Sensor Revenue undefined Forecast, by Country 2020 & 2033
- Table 36: Global Photoelectric Distance Sensor Volume K Forecast, by Country 2020 & 2033
- Table 37: United Kingdom Photoelectric Distance Sensor Revenue (undefined) Forecast, by Application 2020 & 2033
- Table 38: United Kingdom Photoelectric Distance Sensor Volume (K) Forecast, by Application 2020 & 2033
- Table 39: Germany Photoelectric Distance Sensor Revenue (undefined) Forecast, by Application 2020 & 2033
- Table 40: Germany Photoelectric Distance Sensor Volume (K) Forecast, by Application 2020 & 2033
- Table 41: France Photoelectric Distance Sensor Revenue (undefined) Forecast, by Application 2020 & 2033
- Table 42: France Photoelectric Distance Sensor Volume (K) Forecast, by Application 2020 & 2033
- Table 43: Italy Photoelectric Distance Sensor Revenue (undefined) Forecast, by Application 2020 & 2033
- Table 44: Italy Photoelectric Distance Sensor Volume (K) Forecast, by Application 2020 & 2033
- Table 45: Spain Photoelectric Distance Sensor Revenue (undefined) Forecast, by Application 2020 & 2033
- Table 46: Spain Photoelectric Distance Sensor Volume (K) Forecast, by Application 2020 & 2033
- Table 47: Russia Photoelectric Distance Sensor Revenue (undefined) Forecast, by Application 2020 & 2033
- Table 48: Russia Photoelectric Distance Sensor Volume (K) Forecast, by Application 2020 & 2033
- Table 49: Benelux Photoelectric Distance Sensor Revenue (undefined) Forecast, by Application 2020 & 2033
- Table 50: Benelux Photoelectric Distance Sensor Volume (K) Forecast, by Application 2020 & 2033
- Table 51: Nordics Photoelectric Distance Sensor Revenue (undefined) Forecast, by Application 2020 & 2033
- Table 52: Nordics Photoelectric Distance Sensor Volume (K) Forecast, by Application 2020 & 2033
- Table 53: Rest of Europe Photoelectric Distance Sensor Revenue (undefined) Forecast, by Application 2020 & 2033
- Table 54: Rest of Europe Photoelectric Distance Sensor Volume (K) Forecast, by Application 2020 & 2033
- Table 55: Global Photoelectric Distance Sensor Revenue undefined Forecast, by Application 2020 & 2033
- Table 56: Global Photoelectric Distance Sensor Volume K Forecast, by Application 2020 & 2033
- Table 57: Global Photoelectric Distance Sensor Revenue undefined Forecast, by Types 2020 & 2033
- Table 58: Global Photoelectric Distance Sensor Volume K Forecast, by Types 2020 & 2033
- Table 59: Global Photoelectric Distance Sensor Revenue undefined Forecast, by Country 2020 & 2033
- Table 60: Global Photoelectric Distance Sensor Volume K Forecast, by Country 2020 & 2033
- Table 61: Turkey Photoelectric Distance Sensor Revenue (undefined) Forecast, by Application 2020 & 2033
- Table 62: Turkey Photoelectric Distance Sensor Volume (K) Forecast, by Application 2020 & 2033
- Table 63: Israel Photoelectric Distance Sensor Revenue (undefined) Forecast, by Application 2020 & 2033
- Table 64: Israel Photoelectric Distance Sensor Volume (K) Forecast, by Application 2020 & 2033
- Table 65: GCC Photoelectric Distance Sensor Revenue (undefined) Forecast, by Application 2020 & 2033
- Table 66: GCC Photoelectric Distance Sensor Volume (K) Forecast, by Application 2020 & 2033
- Table 67: North Africa Photoelectric Distance Sensor Revenue (undefined) Forecast, by Application 2020 & 2033
- Table 68: North Africa Photoelectric Distance Sensor Volume (K) Forecast, by Application 2020 & 2033
- Table 69: South Africa Photoelectric Distance Sensor Revenue (undefined) Forecast, by Application 2020 & 2033
- Table 70: South Africa Photoelectric Distance Sensor Volume (K) Forecast, by Application 2020 & 2033
- Table 71: Rest of Middle East & Africa Photoelectric Distance Sensor Revenue (undefined) Forecast, by Application 2020 & 2033
- Table 72: Rest of Middle East & Africa Photoelectric Distance Sensor Volume (K) Forecast, by Application 2020 & 2033
- Table 73: Global Photoelectric Distance Sensor Revenue undefined Forecast, by Application 2020 & 2033
- Table 74: Global Photoelectric Distance Sensor Volume K Forecast, by Application 2020 & 2033
- Table 75: Global Photoelectric Distance Sensor Revenue undefined Forecast, by Types 2020 & 2033
- Table 76: Global Photoelectric Distance Sensor Volume K Forecast, by Types 2020 & 2033
- Table 77: Global Photoelectric Distance Sensor Revenue undefined Forecast, by Country 2020 & 2033
- Table 78: Global Photoelectric Distance Sensor Volume K Forecast, by Country 2020 & 2033
- Table 79: China Photoelectric Distance Sensor Revenue (undefined) Forecast, by Application 2020 & 2033
- Table 80: China Photoelectric Distance Sensor Volume (K) Forecast, by Application 2020 & 2033
- Table 81: India Photoelectric Distance Sensor Revenue (undefined) Forecast, by Application 2020 & 2033
- Table 82: India Photoelectric Distance Sensor Volume (K) Forecast, by Application 2020 & 2033
- Table 83: Japan Photoelectric Distance Sensor Revenue (undefined) Forecast, by Application 2020 & 2033
- Table 84: Japan Photoelectric Distance Sensor Volume (K) Forecast, by Application 2020 & 2033
- Table 85: South Korea Photoelectric Distance Sensor Revenue (undefined) Forecast, by Application 2020 & 2033
- Table 86: South Korea Photoelectric Distance Sensor Volume (K) Forecast, by Application 2020 & 2033
- Table 87: ASEAN Photoelectric Distance Sensor Revenue (undefined) Forecast, by Application 2020 & 2033
- Table 88: ASEAN Photoelectric Distance Sensor Volume (K) Forecast, by Application 2020 & 2033
- Table 89: Oceania Photoelectric Distance Sensor Revenue (undefined) Forecast, by Application 2020 & 2033
- Table 90: Oceania Photoelectric Distance Sensor Volume (K) Forecast, by Application 2020 & 2033
- Table 91: Rest of Asia Pacific Photoelectric Distance Sensor Revenue (undefined) Forecast, by Application 2020 & 2033
- Table 92: Rest of Asia Pacific Photoelectric Distance Sensor Volume (K) Forecast, by Application 2020 & 2033
Frequently Asked Questions
1. What is the projected Compound Annual Growth Rate (CAGR) of the Photoelectric Distance Sensor?
The projected CAGR is approximately 5.65%.
2. Which companies are prominent players in the Photoelectric Distance Sensor?
Key companies in the market include OMRON, Panasonic, SICK, Keyence, Rockwell Automation, Balluff, Optex, Baumer, Pepperl+Fuchs, TAKEX, Wenglor, Schneider Electric.
3. What are the main segments of the Photoelectric Distance Sensor?
The market segments include Application, Types.
4. Can you provide details about the market size?
The market size is estimated to be USD XXX N/A as of 2022.
5. What are some drivers contributing to market growth?
N/A
6. What are the notable trends driving market growth?
N/A
7. Are there any restraints impacting market growth?
N/A
8. Can you provide examples of recent developments in the market?
N/A
9. What pricing options are available for accessing the report?
Pricing options include single-user, multi-user, and enterprise licenses priced at USD 3350.00, USD 5025.00, and USD 6700.00 respectively.
10. Is the market size provided in terms of value or volume?
The market size is provided in terms of value, measured in N/A and volume, measured in K.
11. Are there any specific market keywords associated with the report?
Yes, the market keyword associated with the report is "Photoelectric Distance Sensor," which aids in identifying and referencing the specific market segment covered.
12. How do I determine which pricing option suits my needs best?
The pricing options vary based on user requirements and access needs. Individual users may opt for single-user licenses, while businesses requiring broader access may choose multi-user or enterprise licenses for cost-effective access to the report.
13. Are there any additional resources or data provided in the Photoelectric Distance Sensor report?
While the report offers comprehensive insights, it's advisable to review the specific contents or supplementary materials provided to ascertain if additional resources or data are available.
14. How can I stay updated on further developments or reports in the Photoelectric Distance Sensor?
To stay informed about further developments, trends, and reports in the Photoelectric Distance Sensor, consider subscribing to industry newsletters, following relevant companies and organizations, or regularly checking reputable industry news sources and publications.
Methodology
Step 1 - Identification of Relevant Samples Size from Population Database


Step 2 - Approaches for Defining Global Market Size (Value, Volume* & Price*)

Note*: In applicable scenarios
Step 3 - Data Sources
Primary Research
- Web Analytics
- Survey Reports
- Research Institute
- Latest Research Reports
- Opinion Leaders
Secondary Research
- Annual Reports
- White Paper
- Latest Press Release
- Industry Association
- Paid Database
- Investor Presentations

Step 4 - Data Triangulation
Involves using different sources of information in order to increase the validity of a study
These sources are likely to be stakeholders in a program - participants, other researchers, program staff, other community members, and so on.
Then we put all data in single framework & apply various statistical tools to find out the dynamic on the market.
During the analysis stage, feedback from the stakeholder groups would be compared to determine areas of agreement as well as areas of divergence