

Key Insights
The PCI Express (PCIe) market is projected for substantial expansion, fueled by escalating demand for high-bandwidth connectivity across data centers, high-performance computing (HPC), and artificial intelligence (AI) sectors. This growth is intrinsically linked to the rise of data-intensive workloads necessitating superior data transfer speeds and reduced latency. Technological advancements, including the widespread adoption of PCIe 5.0 and the anticipated arrival of PCIe 6.0, are key accelerators, offering marked improvements in bandwidth to seamlessly support increasingly sophisticated applications. Major industry leaders, such as Intel, NVIDIA, and Samsung, are significantly investing in research and development, as well as manufacturing capabilities, to leverage this dynamic market and foster innovation. The market is segmented by interface type (e.g., PCIe 4.0, PCIe 5.0), application (e.g., data centers, networking), and geographical region. Continued market growth is expected, particularly with the increasing integration of NVMe SSDs and advanced networking solutions that are fundamentally reliant on PCIe technology.
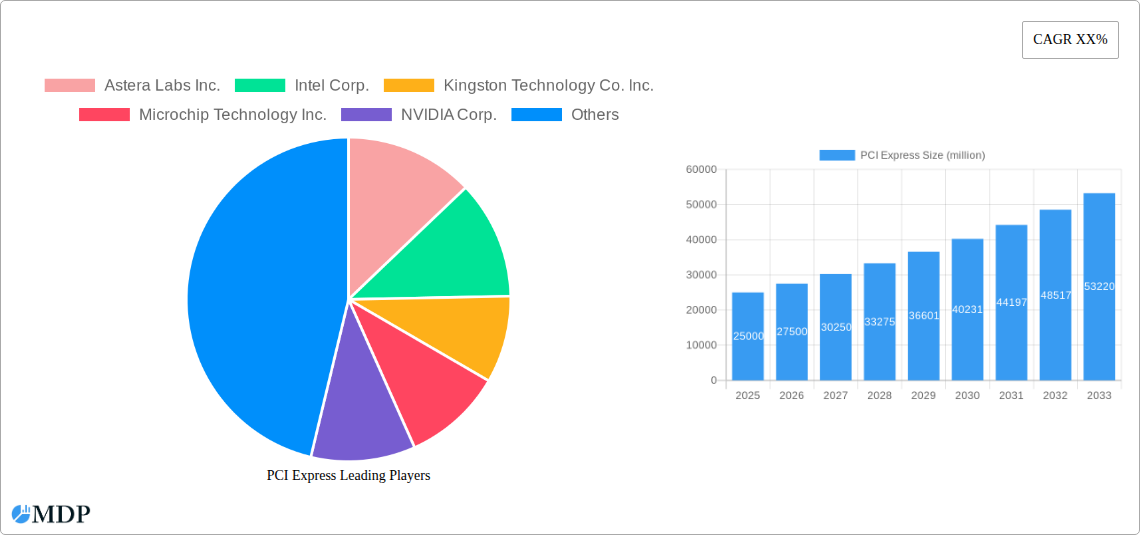
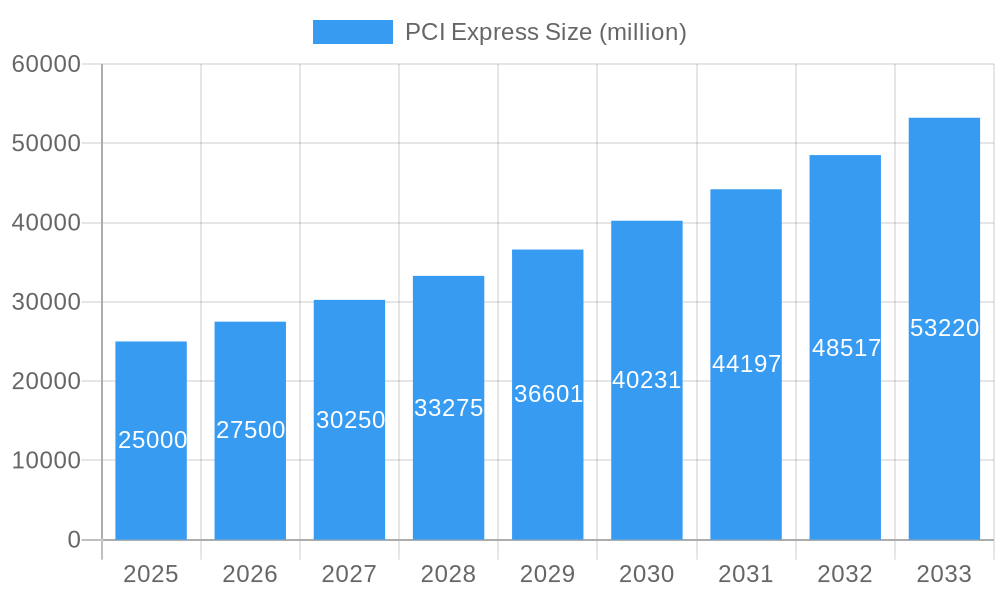
PCI Express Market Size (In Billion)
The forecast period, commencing from 2025, anticipates a Compound Annual Growth Rate (CAGR) of 12.2%, driving the market size to an estimated $1962.5 million by 2033. The ongoing development of high-performance computing infrastructure and the sustained growth of AI and machine learning sectors are pivotal drivers for this expansion. While initial investment costs for advanced PCIe technologies may present a temporary hurdle, the long-term performance and efficiency gains are expected to mitigate these concerns. The competitive arena features established enterprises and emerging innovators, collectively contributing to continuous technological advancements and a diversified product portfolio, ultimately benefiting end-users with enhanced performance and greater choice. The escalating adoption of cloud computing and the demand for rapid data processing within edge computing environments will further propel market growth throughout the forecast period.
PCI Express Company Market Share
PCI Express Market Report: A Comprehensive Analysis (2019-2033)
This in-depth report provides a comprehensive analysis of the PCI Express market, encompassing market dynamics, industry trends, leading players, and future growth opportunities. The study period covers 2019-2033, with a focus on the estimated year 2025 and a forecast period of 2025-2033. This report is essential for industry stakeholders, investors, and anyone seeking to understand the evolution and future trajectory of this critical technology. The market is projected to reach xx million by 2033, exhibiting a CAGR of xx% during the forecast period.
PCI Express Market Dynamics & Concentration
The PCI Express market exhibits a moderately concentrated landscape, with key players like Intel Corp, NVIDIA Corp, and Samsung Electronics Co. Ltd holding significant market share. The estimated market share of Intel Corp in 2025 is xx%, NVIDIA Corp xx%, and Samsung Electronics Co. Ltd xx%. Innovation in high-speed data transfer capabilities, driven by the increasing demand for data-intensive applications, is a major driver. Stringent regulatory compliance requirements, particularly concerning data security and interoperability, shape market dynamics. Product substitutes, such as alternative interconnect technologies, pose a competitive threat, albeit limited due to PCI Express's established dominance. The M&A landscape has seen xx deals in the historical period (2019-2024), primarily focused on strengthening product portfolios and expanding market reach. End-user trends indicate a growing preference for high-bandwidth solutions across diverse sectors, including data centers, high-performance computing, and consumer electronics.
PCI Express Industry Trends & Analysis
The PCI Express market is experiencing robust growth fueled by several factors. The increasing demand for high-speed data transfer in data centers, driven by the exponential growth of data and cloud computing, is a primary driver. Technological advancements, such as the introduction of PCIe 5.0 and the upcoming PCIe 6.0, are significantly impacting market dynamics. This translates to a market penetration of xx% for PCIe 5.0 in 2025 and a projected xx% for PCIe 6.0 by 2033. Consumer preferences are shifting towards devices with enhanced performance and faster data transfer capabilities, further boosting demand. Competitive dynamics are characterized by ongoing innovation, strategic partnerships, and a focus on delivering differentiated products and solutions. The market’s CAGR is projected at xx% during the forecast period (2025-2033).
Leading Markets & Segments in PCI Express
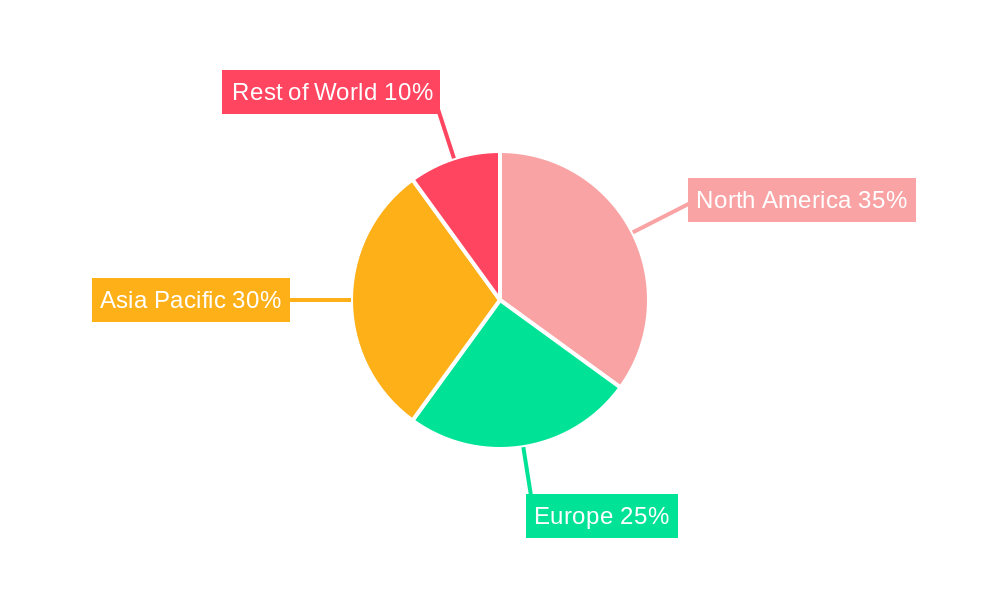
The North American region currently holds the dominant position in the PCI Express market, accounting for xx% of the global market share in 2025. This dominance is attributed to:
- Strong technological infrastructure: Extensive and advanced data centers, high-speed internet connectivity, and a vibrant tech ecosystem.
- High adoption rates: Early adoption of new technologies across various sectors, creating a high demand for PCI Express solutions.
- Favorable economic policies: Government support for R&D in the technology sector and a business-friendly regulatory environment.
The data center segment is the leading application for PCI Express, driven by the increasing adoption of cloud computing, AI, and high-performance computing. Detailed analysis indicates that this segment is expected to maintain its leadership throughout the forecast period, with projected growth of xx million by 2033. This is due to the continuous growth in data volumes and the need for seamless data transfer within these complex environments.
PCI Express Product Developments
Recent product developments focus on increasing data transfer speeds, improving power efficiency, and enhancing security features. The introduction of PCIe 5.0 and the upcoming PCIe 6.0 significantly improve bandwidth, enabling faster data transfer rates and supporting higher-performance applications. These advancements cater to the growing demand for high-bandwidth solutions across data centers, servers, and high-end consumer electronics, ensuring a strong market fit for future innovations. Competition is intensifying within this space, pushing companies to enhance their existing technology and introduce new value-added features to remain competitive.
Key Drivers of PCI Express Growth
Technological advancements are the primary drivers of PCI Express growth. The ongoing development of higher-speed standards like PCIe 6.0 and beyond fuels market expansion. The increasing demand from data centers, particularly for high-bandwidth applications such as cloud computing and AI, acts as another major driver. Moreover, supportive government policies and investments in technological infrastructure further propel growth.
Challenges in the PCI Express Market
Challenges include high initial costs of adopting new PCI Express standards and potential supply chain disruptions that could affect production and delivery. Competition from alternative interconnect technologies and maintaining interoperability across different devices and standards pose significant challenges. These challenges combined could result in a projected xx% decrease in market growth if not effectively addressed.
Emerging Opportunities in PCI Express
Emerging opportunities lie in the expansion of PCI Express into new applications, including advanced automotive systems, high-performance embedded systems, and next-generation networking technologies. Strategic partnerships and collaborations will be crucial for companies to accelerate innovation and tap into emerging markets. The successful integration of PCI Express into 5G and beyond networks will offer significant growth potential.
Leading Players in the PCI Express Sector
Key Milestones in PCI Express Industry
- 2019: PCIe 4.0 gains widespread adoption.
- 2021: Several companies announce support for PCIe 5.0.
- 2023: First commercial products using PCIe 5.0 are launched.
- 2025: Initial PCIe 6.0 specifications announced, marking a significant milestone.
- 2028: Expected commercial availability of PCIe 6.0 products.
Strategic Outlook for PCI Express Market
The PCI Express market is poised for continued growth driven by technological innovation, increasing data demands, and expansion into new applications. Strategic partnerships and collaborations, focused on developing higher-speed, more power-efficient solutions, will be critical for success. Companies that effectively address the challenges and capitalize on emerging opportunities are well-positioned to capture significant market share and drive industry growth.
PCI Express Segmentation
-
1. Application
- 1.1. Storage
- 1.2. Data Center
- 1.3. Others
-
2. Types
- 2.1. PCIe 1.0
- 2.2. PCIe 2.0
- 2.3. PCIe 3.0
- 2.4. PCIe 4.0
- 2.5. PCIe 5.0
PCI Express Segmentation By Geography
-
1. North America
- 1.1. United States
- 1.2. Canada
- 1.3. Mexico
-
2. South America
- 2.1. Brazil
- 2.2. Argentina
- 2.3. Rest of South America
-
3. Europe
- 3.1. United Kingdom
- 3.2. Germany
- 3.3. France
- 3.4. Italy
- 3.5. Spain
- 3.6. Russia
- 3.7. Benelux
- 3.8. Nordics
- 3.9. Rest of Europe
-
4. Middle East & Africa
- 4.1. Turkey
- 4.2. Israel
- 4.3. GCC
- 4.4. North Africa
- 4.5. South Africa
- 4.6. Rest of Middle East & Africa
-
5. Asia Pacific
- 5.1. China
- 5.2. India
- 5.3. Japan
- 5.4. South Korea
- 5.5. ASEAN
- 5.6. Oceania
- 5.7. Rest of Asia Pacific
PCI Express Regional Market Share
Geographic Coverage of PCI Express
PCI Express REPORT HIGHLIGHTS
| Aspects | Details |
|---|---|
| Study Period | 2020-2034 |
| Base Year | 2025 |
| Estimated Year | 2026 |
| Forecast Period | 2026-2034 |
| Historical Period | 2020-2025 |
| Growth Rate | CAGR of 12.2% from 2020-2034 |
| Segmentation |
|
Table of Contents
- 1. Introduction
- 1.1. Research Scope
- 1.2. Market Segmentation
- 1.3. Research Methodology
- 1.4. Definitions and Assumptions
- 2. Executive Summary
- 2.1. Introduction
- 3. Market Dynamics
- 3.1. Introduction
- 3.2. Market Drivers
- 3.3. Market Restrains
- 3.4. Market Trends
- 4. Market Factor Analysis
- 4.1. Porters Five Forces
- 4.2. Supply/Value Chain
- 4.3. PESTEL analysis
- 4.4. Market Entropy
- 4.5. Patent/Trademark Analysis
- 5. Global PCI Express Analysis, Insights and Forecast, 2020-2032
- 5.1. Market Analysis, Insights and Forecast - by Application
- 5.1.1. Storage
- 5.1.2. Data Center
- 5.1.3. Others
- 5.2. Market Analysis, Insights and Forecast - by Types
- 5.2.1. PCIe 1.0
- 5.2.2. PCIe 2.0
- 5.2.3. PCIe 3.0
- 5.2.4. PCIe 4.0
- 5.2.5. PCIe 5.0
- 5.3. Market Analysis, Insights and Forecast - by Region
- 5.3.1. North America
- 5.3.2. South America
- 5.3.3. Europe
- 5.3.4. Middle East & Africa
- 5.3.5. Asia Pacific
- 5.1. Market Analysis, Insights and Forecast - by Application
- 6. North America PCI Express Analysis, Insights and Forecast, 2020-2032
- 6.1. Market Analysis, Insights and Forecast - by Application
- 6.1.1. Storage
- 6.1.2. Data Center
- 6.1.3. Others
- 6.2. Market Analysis, Insights and Forecast - by Types
- 6.2.1. PCIe 1.0
- 6.2.2. PCIe 2.0
- 6.2.3. PCIe 3.0
- 6.2.4. PCIe 4.0
- 6.2.5. PCIe 5.0
- 6.1. Market Analysis, Insights and Forecast - by Application
- 7. South America PCI Express Analysis, Insights and Forecast, 2020-2032
- 7.1. Market Analysis, Insights and Forecast - by Application
- 7.1.1. Storage
- 7.1.2. Data Center
- 7.1.3. Others
- 7.2. Market Analysis, Insights and Forecast - by Types
- 7.2.1. PCIe 1.0
- 7.2.2. PCIe 2.0
- 7.2.3. PCIe 3.0
- 7.2.4. PCIe 4.0
- 7.2.5. PCIe 5.0
- 7.1. Market Analysis, Insights and Forecast - by Application
- 8. Europe PCI Express Analysis, Insights and Forecast, 2020-2032
- 8.1. Market Analysis, Insights and Forecast - by Application
- 8.1.1. Storage
- 8.1.2. Data Center
- 8.1.3. Others
- 8.2. Market Analysis, Insights and Forecast - by Types
- 8.2.1. PCIe 1.0
- 8.2.2. PCIe 2.0
- 8.2.3. PCIe 3.0
- 8.2.4. PCIe 4.0
- 8.2.5. PCIe 5.0
- 8.1. Market Analysis, Insights and Forecast - by Application
- 9. Middle East & Africa PCI Express Analysis, Insights and Forecast, 2020-2032
- 9.1. Market Analysis, Insights and Forecast - by Application
- 9.1.1. Storage
- 9.1.2. Data Center
- 9.1.3. Others
- 9.2. Market Analysis, Insights and Forecast - by Types
- 9.2.1. PCIe 1.0
- 9.2.2. PCIe 2.0
- 9.2.3. PCIe 3.0
- 9.2.4. PCIe 4.0
- 9.2.5. PCIe 5.0
- 9.1. Market Analysis, Insights and Forecast - by Application
- 10. Asia Pacific PCI Express Analysis, Insights and Forecast, 2020-2032
- 10.1. Market Analysis, Insights and Forecast - by Application
- 10.1.1. Storage
- 10.1.2. Data Center
- 10.1.3. Others
- 10.2. Market Analysis, Insights and Forecast - by Types
- 10.2.1. PCIe 1.0
- 10.2.2. PCIe 2.0
- 10.2.3. PCIe 3.0
- 10.2.4. PCIe 4.0
- 10.2.5. PCIe 5.0
- 10.1. Market Analysis, Insights and Forecast - by Application
- 11. Competitive Analysis
- 11.1. Global Market Share Analysis 2025
- 11.2. Company Profiles
- 11.2.1 Astera Labs Inc.
- 11.2.1.1. Overview
- 11.2.1.2. Products
- 11.2.1.3. SWOT Analysis
- 11.2.1.4. Recent Developments
- 11.2.1.5. Financials (Based on Availability)
- 11.2.2 Intel Corp.
- 11.2.2.1. Overview
- 11.2.2.2. Products
- 11.2.2.3. SWOT Analysis
- 11.2.2.4. Recent Developments
- 11.2.2.5. Financials (Based on Availability)
- 11.2.3 Kingston Technology Co. Inc.
- 11.2.3.1. Overview
- 11.2.3.2. Products
- 11.2.3.3. SWOT Analysis
- 11.2.3.4. Recent Developments
- 11.2.3.5. Financials (Based on Availability)
- 11.2.4 Microchip Technology Inc.
- 11.2.4.1. Overview
- 11.2.4.2. Products
- 11.2.4.3. SWOT Analysis
- 11.2.4.4. Recent Developments
- 11.2.4.5. Financials (Based on Availability)
- 11.2.5 NVIDIA Corp.
- 11.2.5.1. Overview
- 11.2.5.2. Products
- 11.2.5.3. SWOT Analysis
- 11.2.5.4. Recent Developments
- 11.2.5.5. Financials (Based on Availability)
- 11.2.6 Rambus Inc.
- 11.2.6.1. Overview
- 11.2.6.2. Products
- 11.2.6.3. SWOT Analysis
- 11.2.6.4. Recent Developments
- 11.2.6.5. Financials (Based on Availability)
- 11.2.7 Samsung Electronics Co. Ltd.
- 11.2.7.1. Overview
- 11.2.7.2. Products
- 11.2.7.3. SWOT Analysis
- 11.2.7.4. Recent Developments
- 11.2.7.5. Financials (Based on Availability)
- 11.2.8 Texas Instruments Inc.
- 11.2.8.1. Overview
- 11.2.8.2. Products
- 11.2.8.3. SWOT Analysis
- 11.2.8.4. Recent Developments
- 11.2.8.5. Financials (Based on Availability)
- 11.2.9 Toshiba Corp.
- 11.2.9.1. Overview
- 11.2.9.2. Products
- 11.2.9.3. SWOT Analysis
- 11.2.9.4. Recent Developments
- 11.2.9.5. Financials (Based on Availability)
- 11.2.10 Xilinx Inc.
- 11.2.10.1. Overview
- 11.2.10.2. Products
- 11.2.10.3. SWOT Analysis
- 11.2.10.4. Recent Developments
- 11.2.10.5. Financials (Based on Availability)
- 11.2.1 Astera Labs Inc.
List of Figures
- Figure 1: Global PCI Express Revenue Breakdown (million, %) by Region 2025 & 2033
- Figure 2: Global PCI Express Volume Breakdown (K, %) by Region 2025 & 2033
- Figure 3: North America PCI Express Revenue (million), by Application 2025 & 2033
- Figure 4: North America PCI Express Volume (K), by Application 2025 & 2033
- Figure 5: North America PCI Express Revenue Share (%), by Application 2025 & 2033
- Figure 6: North America PCI Express Volume Share (%), by Application 2025 & 2033
- Figure 7: North America PCI Express Revenue (million), by Types 2025 & 2033
- Figure 8: North America PCI Express Volume (K), by Types 2025 & 2033
- Figure 9: North America PCI Express Revenue Share (%), by Types 2025 & 2033
- Figure 10: North America PCI Express Volume Share (%), by Types 2025 & 2033
- Figure 11: North America PCI Express Revenue (million), by Country 2025 & 2033
- Figure 12: North America PCI Express Volume (K), by Country 2025 & 2033
- Figure 13: North America PCI Express Revenue Share (%), by Country 2025 & 2033
- Figure 14: North America PCI Express Volume Share (%), by Country 2025 & 2033
- Figure 15: South America PCI Express Revenue (million), by Application 2025 & 2033
- Figure 16: South America PCI Express Volume (K), by Application 2025 & 2033
- Figure 17: South America PCI Express Revenue Share (%), by Application 2025 & 2033
- Figure 18: South America PCI Express Volume Share (%), by Application 2025 & 2033
- Figure 19: South America PCI Express Revenue (million), by Types 2025 & 2033
- Figure 20: South America PCI Express Volume (K), by Types 2025 & 2033
- Figure 21: South America PCI Express Revenue Share (%), by Types 2025 & 2033
- Figure 22: South America PCI Express Volume Share (%), by Types 2025 & 2033
- Figure 23: South America PCI Express Revenue (million), by Country 2025 & 2033
- Figure 24: South America PCI Express Volume (K), by Country 2025 & 2033
- Figure 25: South America PCI Express Revenue Share (%), by Country 2025 & 2033
- Figure 26: South America PCI Express Volume Share (%), by Country 2025 & 2033
- Figure 27: Europe PCI Express Revenue (million), by Application 2025 & 2033
- Figure 28: Europe PCI Express Volume (K), by Application 2025 & 2033
- Figure 29: Europe PCI Express Revenue Share (%), by Application 2025 & 2033
- Figure 30: Europe PCI Express Volume Share (%), by Application 2025 & 2033
- Figure 31: Europe PCI Express Revenue (million), by Types 2025 & 2033
- Figure 32: Europe PCI Express Volume (K), by Types 2025 & 2033
- Figure 33: Europe PCI Express Revenue Share (%), by Types 2025 & 2033
- Figure 34: Europe PCI Express Volume Share (%), by Types 2025 & 2033
- Figure 35: Europe PCI Express Revenue (million), by Country 2025 & 2033
- Figure 36: Europe PCI Express Volume (K), by Country 2025 & 2033
- Figure 37: Europe PCI Express Revenue Share (%), by Country 2025 & 2033
- Figure 38: Europe PCI Express Volume Share (%), by Country 2025 & 2033
- Figure 39: Middle East & Africa PCI Express Revenue (million), by Application 2025 & 2033
- Figure 40: Middle East & Africa PCI Express Volume (K), by Application 2025 & 2033
- Figure 41: Middle East & Africa PCI Express Revenue Share (%), by Application 2025 & 2033
- Figure 42: Middle East & Africa PCI Express Volume Share (%), by Application 2025 & 2033
- Figure 43: Middle East & Africa PCI Express Revenue (million), by Types 2025 & 2033
- Figure 44: Middle East & Africa PCI Express Volume (K), by Types 2025 & 2033
- Figure 45: Middle East & Africa PCI Express Revenue Share (%), by Types 2025 & 2033
- Figure 46: Middle East & Africa PCI Express Volume Share (%), by Types 2025 & 2033
- Figure 47: Middle East & Africa PCI Express Revenue (million), by Country 2025 & 2033
- Figure 48: Middle East & Africa PCI Express Volume (K), by Country 2025 & 2033
- Figure 49: Middle East & Africa PCI Express Revenue Share (%), by Country 2025 & 2033
- Figure 50: Middle East & Africa PCI Express Volume Share (%), by Country 2025 & 2033
- Figure 51: Asia Pacific PCI Express Revenue (million), by Application 2025 & 2033
- Figure 52: Asia Pacific PCI Express Volume (K), by Application 2025 & 2033
- Figure 53: Asia Pacific PCI Express Revenue Share (%), by Application 2025 & 2033
- Figure 54: Asia Pacific PCI Express Volume Share (%), by Application 2025 & 2033
- Figure 55: Asia Pacific PCI Express Revenue (million), by Types 2025 & 2033
- Figure 56: Asia Pacific PCI Express Volume (K), by Types 2025 & 2033
- Figure 57: Asia Pacific PCI Express Revenue Share (%), by Types 2025 & 2033
- Figure 58: Asia Pacific PCI Express Volume Share (%), by Types 2025 & 2033
- Figure 59: Asia Pacific PCI Express Revenue (million), by Country 2025 & 2033
- Figure 60: Asia Pacific PCI Express Volume (K), by Country 2025 & 2033
- Figure 61: Asia Pacific PCI Express Revenue Share (%), by Country 2025 & 2033
- Figure 62: Asia Pacific PCI Express Volume Share (%), by Country 2025 & 2033
List of Tables
- Table 1: Global PCI Express Revenue million Forecast, by Application 2020 & 2033
- Table 2: Global PCI Express Volume K Forecast, by Application 2020 & 2033
- Table 3: Global PCI Express Revenue million Forecast, by Types 2020 & 2033
- Table 4: Global PCI Express Volume K Forecast, by Types 2020 & 2033
- Table 5: Global PCI Express Revenue million Forecast, by Region 2020 & 2033
- Table 6: Global PCI Express Volume K Forecast, by Region 2020 & 2033
- Table 7: Global PCI Express Revenue million Forecast, by Application 2020 & 2033
- Table 8: Global PCI Express Volume K Forecast, by Application 2020 & 2033
- Table 9: Global PCI Express Revenue million Forecast, by Types 2020 & 2033
- Table 10: Global PCI Express Volume K Forecast, by Types 2020 & 2033
- Table 11: Global PCI Express Revenue million Forecast, by Country 2020 & 2033
- Table 12: Global PCI Express Volume K Forecast, by Country 2020 & 2033
- Table 13: United States PCI Express Revenue (million) Forecast, by Application 2020 & 2033
- Table 14: United States PCI Express Volume (K) Forecast, by Application 2020 & 2033
- Table 15: Canada PCI Express Revenue (million) Forecast, by Application 2020 & 2033
- Table 16: Canada PCI Express Volume (K) Forecast, by Application 2020 & 2033
- Table 17: Mexico PCI Express Revenue (million) Forecast, by Application 2020 & 2033
- Table 18: Mexico PCI Express Volume (K) Forecast, by Application 2020 & 2033
- Table 19: Global PCI Express Revenue million Forecast, by Application 2020 & 2033
- Table 20: Global PCI Express Volume K Forecast, by Application 2020 & 2033
- Table 21: Global PCI Express Revenue million Forecast, by Types 2020 & 2033
- Table 22: Global PCI Express Volume K Forecast, by Types 2020 & 2033
- Table 23: Global PCI Express Revenue million Forecast, by Country 2020 & 2033
- Table 24: Global PCI Express Volume K Forecast, by Country 2020 & 2033
- Table 25: Brazil PCI Express Revenue (million) Forecast, by Application 2020 & 2033
- Table 26: Brazil PCI Express Volume (K) Forecast, by Application 2020 & 2033
- Table 27: Argentina PCI Express Revenue (million) Forecast, by Application 2020 & 2033
- Table 28: Argentina PCI Express Volume (K) Forecast, by Application 2020 & 2033
- Table 29: Rest of South America PCI Express Revenue (million) Forecast, by Application 2020 & 2033
- Table 30: Rest of South America PCI Express Volume (K) Forecast, by Application 2020 & 2033
- Table 31: Global PCI Express Revenue million Forecast, by Application 2020 & 2033
- Table 32: Global PCI Express Volume K Forecast, by Application 2020 & 2033
- Table 33: Global PCI Express Revenue million Forecast, by Types 2020 & 2033
- Table 34: Global PCI Express Volume K Forecast, by Types 2020 & 2033
- Table 35: Global PCI Express Revenue million Forecast, by Country 2020 & 2033
- Table 36: Global PCI Express Volume K Forecast, by Country 2020 & 2033
- Table 37: United Kingdom PCI Express Revenue (million) Forecast, by Application 2020 & 2033
- Table 38: United Kingdom PCI Express Volume (K) Forecast, by Application 2020 & 2033
- Table 39: Germany PCI Express Revenue (million) Forecast, by Application 2020 & 2033
- Table 40: Germany PCI Express Volume (K) Forecast, by Application 2020 & 2033
- Table 41: France PCI Express Revenue (million) Forecast, by Application 2020 & 2033
- Table 42: France PCI Express Volume (K) Forecast, by Application 2020 & 2033
- Table 43: Italy PCI Express Revenue (million) Forecast, by Application 2020 & 2033
- Table 44: Italy PCI Express Volume (K) Forecast, by Application 2020 & 2033
- Table 45: Spain PCI Express Revenue (million) Forecast, by Application 2020 & 2033
- Table 46: Spain PCI Express Volume (K) Forecast, by Application 2020 & 2033
- Table 47: Russia PCI Express Revenue (million) Forecast, by Application 2020 & 2033
- Table 48: Russia PCI Express Volume (K) Forecast, by Application 2020 & 2033
- Table 49: Benelux PCI Express Revenue (million) Forecast, by Application 2020 & 2033
- Table 50: Benelux PCI Express Volume (K) Forecast, by Application 2020 & 2033
- Table 51: Nordics PCI Express Revenue (million) Forecast, by Application 2020 & 2033
- Table 52: Nordics PCI Express Volume (K) Forecast, by Application 2020 & 2033
- Table 53: Rest of Europe PCI Express Revenue (million) Forecast, by Application 2020 & 2033
- Table 54: Rest of Europe PCI Express Volume (K) Forecast, by Application 2020 & 2033
- Table 55: Global PCI Express Revenue million Forecast, by Application 2020 & 2033
- Table 56: Global PCI Express Volume K Forecast, by Application 2020 & 2033
- Table 57: Global PCI Express Revenue million Forecast, by Types 2020 & 2033
- Table 58: Global PCI Express Volume K Forecast, by Types 2020 & 2033
- Table 59: Global PCI Express Revenue million Forecast, by Country 2020 & 2033
- Table 60: Global PCI Express Volume K Forecast, by Country 2020 & 2033
- Table 61: Turkey PCI Express Revenue (million) Forecast, by Application 2020 & 2033
- Table 62: Turkey PCI Express Volume (K) Forecast, by Application 2020 & 2033
- Table 63: Israel PCI Express Revenue (million) Forecast, by Application 2020 & 2033
- Table 64: Israel PCI Express Volume (K) Forecast, by Application 2020 & 2033
- Table 65: GCC PCI Express Revenue (million) Forecast, by Application 2020 & 2033
- Table 66: GCC PCI Express Volume (K) Forecast, by Application 2020 & 2033
- Table 67: North Africa PCI Express Revenue (million) Forecast, by Application 2020 & 2033
- Table 68: North Africa PCI Express Volume (K) Forecast, by Application 2020 & 2033
- Table 69: South Africa PCI Express Revenue (million) Forecast, by Application 2020 & 2033
- Table 70: South Africa PCI Express Volume (K) Forecast, by Application 2020 & 2033
- Table 71: Rest of Middle East & Africa PCI Express Revenue (million) Forecast, by Application 2020 & 2033
- Table 72: Rest of Middle East & Africa PCI Express Volume (K) Forecast, by Application 2020 & 2033
- Table 73: Global PCI Express Revenue million Forecast, by Application 2020 & 2033
- Table 74: Global PCI Express Volume K Forecast, by Application 2020 & 2033
- Table 75: Global PCI Express Revenue million Forecast, by Types 2020 & 2033
- Table 76: Global PCI Express Volume K Forecast, by Types 2020 & 2033
- Table 77: Global PCI Express Revenue million Forecast, by Country 2020 & 2033
- Table 78: Global PCI Express Volume K Forecast, by Country 2020 & 2033
- Table 79: China PCI Express Revenue (million) Forecast, by Application 2020 & 2033
- Table 80: China PCI Express Volume (K) Forecast, by Application 2020 & 2033
- Table 81: India PCI Express Revenue (million) Forecast, by Application 2020 & 2033
- Table 82: India PCI Express Volume (K) Forecast, by Application 2020 & 2033
- Table 83: Japan PCI Express Revenue (million) Forecast, by Application 2020 & 2033
- Table 84: Japan PCI Express Volume (K) Forecast, by Application 2020 & 2033
- Table 85: South Korea PCI Express Revenue (million) Forecast, by Application 2020 & 2033
- Table 86: South Korea PCI Express Volume (K) Forecast, by Application 2020 & 2033
- Table 87: ASEAN PCI Express Revenue (million) Forecast, by Application 2020 & 2033
- Table 88: ASEAN PCI Express Volume (K) Forecast, by Application 2020 & 2033
- Table 89: Oceania PCI Express Revenue (million) Forecast, by Application 2020 & 2033
- Table 90: Oceania PCI Express Volume (K) Forecast, by Application 2020 & 2033
- Table 91: Rest of Asia Pacific PCI Express Revenue (million) Forecast, by Application 2020 & 2033
- Table 92: Rest of Asia Pacific PCI Express Volume (K) Forecast, by Application 2020 & 2033
Frequently Asked Questions
1. What is the projected Compound Annual Growth Rate (CAGR) of the PCI Express?
The projected CAGR is approximately 12.2%.
2. Which companies are prominent players in the PCI Express?
Key companies in the market include Astera Labs Inc., Intel Corp., Kingston Technology Co. Inc., Microchip Technology Inc., NVIDIA Corp., Rambus Inc., Samsung Electronics Co. Ltd., Texas Instruments Inc., Toshiba Corp., Xilinx Inc..
3. What are the main segments of the PCI Express?
The market segments include Application, Types.
4. Can you provide details about the market size?
The market size is estimated to be USD 1962.5 million as of 2022.
5. What are some drivers contributing to market growth?
N/A
6. What are the notable trends driving market growth?
N/A
7. Are there any restraints impacting market growth?
N/A
8. Can you provide examples of recent developments in the market?
N/A
9. What pricing options are available for accessing the report?
Pricing options include single-user, multi-user, and enterprise licenses priced at USD 3350.00, USD 5025.00, and USD 6700.00 respectively.
10. Is the market size provided in terms of value or volume?
The market size is provided in terms of value, measured in million and volume, measured in K.
11. Are there any specific market keywords associated with the report?
Yes, the market keyword associated with the report is "PCI Express," which aids in identifying and referencing the specific market segment covered.
12. How do I determine which pricing option suits my needs best?
The pricing options vary based on user requirements and access needs. Individual users may opt for single-user licenses, while businesses requiring broader access may choose multi-user or enterprise licenses for cost-effective access to the report.
13. Are there any additional resources or data provided in the PCI Express report?
While the report offers comprehensive insights, it's advisable to review the specific contents or supplementary materials provided to ascertain if additional resources or data are available.
14. How can I stay updated on further developments or reports in the PCI Express?
To stay informed about further developments, trends, and reports in the PCI Express, consider subscribing to industry newsletters, following relevant companies and organizations, or regularly checking reputable industry news sources and publications.
Methodology
Step 1 - Identification of Relevant Samples Size from Population Database


Step 2 - Approaches for Defining Global Market Size (Value, Volume* & Price*)

Note*: In applicable scenarios
Step 3 - Data Sources
Primary Research
- Web Analytics
- Survey Reports
- Research Institute
- Latest Research Reports
- Opinion Leaders
Secondary Research
- Annual Reports
- White Paper
- Latest Press Release
- Industry Association
- Paid Database
- Investor Presentations

Step 4 - Data Triangulation
Involves using different sources of information in order to increase the validity of a study
These sources are likely to be stakeholders in a program - participants, other researchers, program staff, other community members, and so on.
Then we put all data in single framework & apply various statistical tools to find out the dynamic on the market.
During the analysis stage, feedback from the stakeholder groups would be compared to determine areas of agreement as well as areas of divergence