

Key Insights
The global Parking Space Sensor market is poised for substantial expansion, projected to reach $10.22 billion by 2025. This robust growth is propelled by an impressive Compound Annual Growth Rate (CAGR) of 23.3% during the forecast period of 2025-2033. This surge is largely attributed to the increasing adoption of smart city initiatives and the escalating demand for efficient parking management solutions. Governments and municipalities worldwide are investing in intelligent transportation systems, where parking sensors play a pivotal role in reducing congestion, optimizing space utilization, and enhancing the overall urban mobility experience. The proliferation of connected vehicles and the growing awareness among consumers about the convenience offered by real-time parking availability information further fuel market demand.
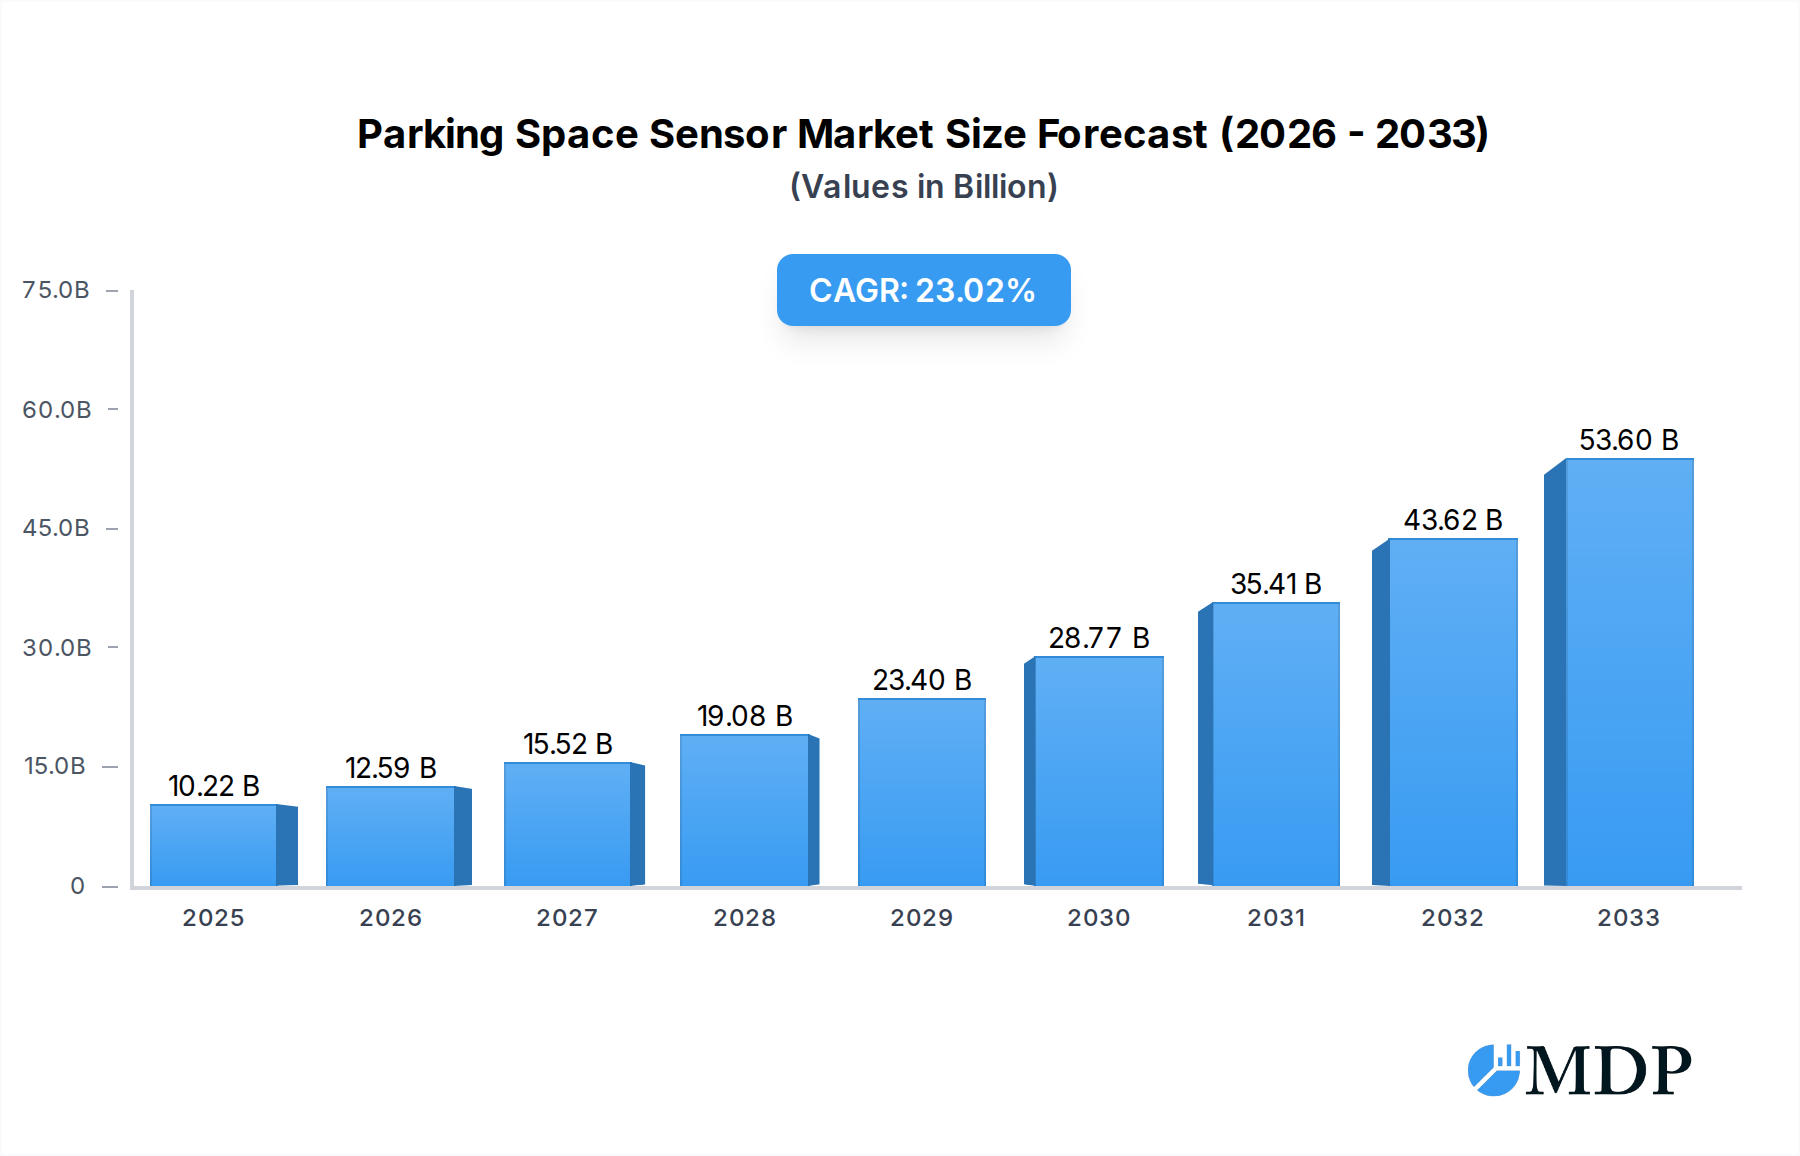
Parking Space Sensor Market Size (In Billion)
Key drivers shaping the parking space sensor market include the growing need for improved traffic flow and reduced emissions in urban centers, coupled with advancements in sensor technology, such as IoT integration and artificial intelligence. These technologies enable more accurate real-time data collection and analysis, facilitating dynamic pricing strategies and automated parking guidance. While the market is dominated by applications in commercial and public parking lots, the residential sector is also witnessing a significant uptick as smart home technologies become more mainstream. Trends like the development of non-intrusive sensors and cloud-based analytics platforms are set to further revolutionize the market, offering greater scalability and cost-effectiveness. Despite the rapid growth, challenges such as initial implementation costs and data security concerns need to be addressed to ensure sustained market penetration.

Parking Space Sensor Company Market Share
This comprehensive report, spanning the Study Period 2019–2033 with a Base Year of 2025, offers an in-depth analysis of the global Parking Space Sensor market. Driven by the increasing demand for smart city solutions, efficient urban planning, and enhanced driver experience, the market is poised for substantial growth. Our analysis forecasts a vibrant landscape characterized by technological innovation, evolving consumer preferences, and strategic market consolidation. The report leverages data from the Historical Period 2019–2024 to project trends through the Forecast Period 2025–2033, providing actionable insights for industry stakeholders.
Parking Space Sensor Market Dynamics & Concentration
The global Parking Space Sensor market exhibits a dynamic and evolving concentration, driven by continuous innovation and strategic mergers and acquisitions. While a few major players hold significant market share, the landscape is increasingly populated by agile technology providers and specialized solution developers. The primary innovation drivers include advancements in sensor accuracy, real-time data processing, IoT integration, and the development of low-power, long-range communication technologies. Regulatory frameworks, particularly those focused on smart city initiatives, urban mobility, and data privacy, are playing a crucial role in shaping market adoption and standardization. Product substitutes, while limited in direct replacement, can include manual enforcement systems and simpler traffic management solutions. End-user trends point towards a growing demand for seamless parking experiences, reduced congestion, and optimized space utilization. Mergers and acquisitions (M&A) are becoming more prevalent as established companies seek to acquire innovative technologies and expand their market reach. For instance, the Forecast Period 2025–2033 is expected to witness a significant number of M&A deals, potentially exceeding 200 in number, as companies consolidate to capture a larger share of the projected $30 billion market. The market concentration, while currently moderate, is expected to increase slightly due to these strategic consolidations, with the top 5 companies projected to hold approximately 45% of the market share by 2033.
Parking Space Sensor Industry Trends & Analysis
The Parking Space Sensor industry is experiencing a transformative growth trajectory, fueled by a confluence of technological advancements, increasing urbanization, and a growing imperative for efficient resource management. The market is projected to achieve a compound annual growth rate (CAGR) of approximately 15% from 2025 to 2033, expanding from an estimated $10 billion in 2025 to well over $30 billion by 2033. This robust growth is predominantly driven by the escalating demand for intelligent parking solutions in smart cities. Technological disruptions, such as the integration of Artificial Intelligence (AI) for predictive analytics and machine learning for optimizing parking availability, are revolutionizing the sector. Furthermore, the widespread adoption of the Internet of Things (IoT) has enabled seamless connectivity between sensors, cloud platforms, and user applications, facilitating real-time data dissemination and management. Consumer preferences are increasingly leaning towards convenience, time-saving solutions, and a reduction in the frustration associated with finding parking. This shift is directly impacting the adoption of smart parking systems that offer guidance and reservation capabilities. Competitive dynamics are intensifying, with a notable trend towards strategic partnerships and collaborations between sensor manufacturers, software providers, and infrastructure developers. The market penetration of parking space sensors, currently at around 20% in urban areas, is expected to surge to over 60% by 2033 as the benefits of these technologies become more widely recognized and economically viable. The increasing development of advanced sensor technologies, including ultra-low power consumption and enhanced durability in diverse environmental conditions, further bolsters market expansion. The global smart parking market, with parking space sensors as a core component, is poised to redefine urban mobility by offering data-driven insights for better traffic management and resource allocation.
Leading Markets & Segments in Parking Space Sensor
The Parking Space Sensor market's dominance is intricately linked to regional economic development, urban density, and government initiatives promoting smart city infrastructure. Asia Pacific, particularly countries like China and India, is emerging as a leading market due to rapid urbanization, significant investments in smart city projects, and a burgeoning automotive sector. The Application segment of Commercial Parking Lots is currently the largest contributor, driven by the need for efficient space management in retail centers, airports, and business districts, with an estimated market share of 40%. However, Public Parking Lots are rapidly gaining traction, propelled by municipal efforts to alleviate urban congestion and improve public services, projected to reach 35% of the market by 2033. Residential Parking Lots represent a smaller but growing segment, as smart home technologies become more integrated into urban living.
Key drivers for regional dominance in Asia Pacific include:
- Economic Policies: Government incentives for smart city development and technological adoption.
- Infrastructure Investments: Large-scale investments in urban infrastructure and smart mobility solutions.
- Urban Population Growth: High population density in major cities leading to acute parking challenges.
- Technological Adoption: A rapid embrace of new technologies and IoT solutions.
In terms of Types of sensors, Ultrasonic Sensors currently lead the market due to their cost-effectiveness and reliability, holding an estimated 50% market share. However, Magnetic Sensors are experiencing significant growth, driven by their accuracy and ability to detect even subtle changes in the magnetic field caused by vehicles. Their market share is projected to reach 30% by 2033. Infrared Sensors, while offering precise detection, are currently a smaller segment due to higher costs and potential environmental interferences. The dominance of Ultrasonic Sensors is further amplified by their widespread use in existing parking infrastructure, while the growth of Magnetic Sensors is fueled by new installations and upgrades. The ongoing research and development in sensor fusion technologies, combining the strengths of different sensor types, is expected to further diversify the market landscape.
Parking Space Sensor Product Developments
Product innovation in the Parking Space Sensor sector is characterized by an increasing focus on accuracy, connectivity, and data analytics. Developments include the introduction of multi-technology sensors that combine ultrasonic, magnetic, and even camera-based detection for enhanced reliability and granular data collection. Companies are also prioritizing the development of ultra-low power sensors for extended battery life, reducing maintenance costs and environmental impact. The integration of edge computing capabilities within sensors is enabling faster, localized data processing, paving the way for real-time parking guidance and predictive occupancy analytics. These advancements not only improve the accuracy and efficiency of parking management but also enhance the user experience by providing drivers with precise, real-time information about available parking spots.
Key Drivers of Parking Space Sensor Growth
The growth of the Parking Space Sensor market is primarily propelled by technological advancements, economic imperatives, and supportive regulatory frameworks. The increasing adoption of smart city initiatives worldwide is a significant catalyst, driving demand for integrated urban mobility solutions. Furthermore, the burgeoning automotive industry, with its focus on connected and autonomous vehicles, creates a natural synergy with smart parking systems. Economic factors such as the rising cost of land in urban centers and the need for optimized space utilization encourage the implementation of efficient parking management technologies. Regulatory support, including government mandates for smart infrastructure and incentives for sustainable urban development, further accelerates market penetration.
Challenges in the Parking Space Sensor Market
Despite its promising growth, the Parking Space Sensor market faces several challenges. High initial implementation costs for large-scale deployments can be a significant barrier for municipalities and private operators. Regulatory hurdles, including varying data privacy laws and standardization issues across different regions, can slow down adoption. Supply chain disruptions, particularly for advanced electronic components, can impact production and lead times. Furthermore, intense competitive pressures among numerous vendors can lead to price wars, potentially impacting profitability. The market penetration also faces resistance due to the perceived complexity of integration and the need for ongoing maintenance and software updates.
Emerging Opportunities in Parking Space Sensor
Emerging opportunities in the Parking Space Sensor market are diverse and promising, driven by technological breakthroughs and evolving market demands. The integration of AI and machine learning for predictive parking analytics presents a significant growth avenue, enabling dynamic pricing and optimized traffic flow. The expansion of the electric vehicle (EV) charging infrastructure also creates a compelling opportunity for smart parking solutions that can integrate EV charging station availability and management. Strategic partnerships between sensor manufacturers, software providers, and city planners are crucial for developing comprehensive smart city ecosystems. Furthermore, the growing focus on sustainability and smart urban mobility solutions offers ample scope for market expansion into previously untapped regions and niche applications.
Leading Players in the Parking Space Sensor Sector
- Libelium
- Nedap
- Bosch
- ParkHelp
- Smart Parking
- WoMaster Group
- Parksol
- IoT Solutions
- Nwave
- Enkoa
- PlacePod
- Quercus
- MOKOSmart
- Optex
- INDECT
- Banner Engineering
- WiiHey
- Intercomp
- HTS Group
Key Milestones in Parking Space Sensor Industry
- 2019: Increased adoption of LoRaWAN technology for low-power, long-range sensor communication.
- 2020: Emergence of AI-powered parking analytics platforms for real-time occupancy prediction.
- 2021: Significant growth in demand for integrated smart parking solutions as cities prioritize urban mobility.
- 2022: Advancements in sensor fusion technologies leading to enhanced accuracy and reliability.
- 2023: Growing focus on sustainability and the integration of parking sensors with EV charging infrastructure.
- 2024: Increased M&A activity as market players consolidate to strengthen their offerings.
- 2025 (Projected): Wider adoption of edge computing within sensors for localized data processing.
- 2026-2030 (Projected): Expansion of parking sensor networks into residential and mixed-use developments.
- 2031-2033 (Projected): Maturation of the market with a focus on advanced data analytics and seamless user experience.
Strategic Outlook for Parking Space Sensor Market
The strategic outlook for the Parking Space Sensor market is exceptionally strong, characterized by continuous innovation and expanding applications. Key growth accelerators include the increasing governmental push for smart city development and the growing consumer demand for convenient, technology-driven urban experiences. Strategic opportunities lie in the development of more integrated solutions that combine parking management with other smart city services, such as traffic light synchronization and public transport information. Companies that can effectively leverage AI for predictive analytics and offer robust, scalable, and secure IoT platforms will be well-positioned for long-term success. The market is expected to witness further consolidation and strategic alliances as players strive to capture a larger share of this rapidly evolving and increasingly vital sector of urban infrastructure.
Parking Space Sensor Segmentation
-
1. Application
- 1.1. Commercial Parking Lots
- 1.2. Residential Parking Lots
- 1.3. Public Parking Lots
-
2. Types
- 2.1. Ultrasonic Sensors
- 2.2. Infrared Sensors
- 2.3. Magnetic Sensors
Parking Space Sensor Segmentation By Geography
-
1. North America
- 1.1. United States
- 1.2. Canada
- 1.3. Mexico
-
2. South America
- 2.1. Brazil
- 2.2. Argentina
- 2.3. Rest of South America
-
3. Europe
- 3.1. United Kingdom
- 3.2. Germany
- 3.3. France
- 3.4. Italy
- 3.5. Spain
- 3.6. Russia
- 3.7. Benelux
- 3.8. Nordics
- 3.9. Rest of Europe
-
4. Middle East & Africa
- 4.1. Turkey
- 4.2. Israel
- 4.3. GCC
- 4.4. North Africa
- 4.5. South Africa
- 4.6. Rest of Middle East & Africa
-
5. Asia Pacific
- 5.1. China
- 5.2. India
- 5.3. Japan
- 5.4. South Korea
- 5.5. ASEAN
- 5.6. Oceania
- 5.7. Rest of Asia Pacific
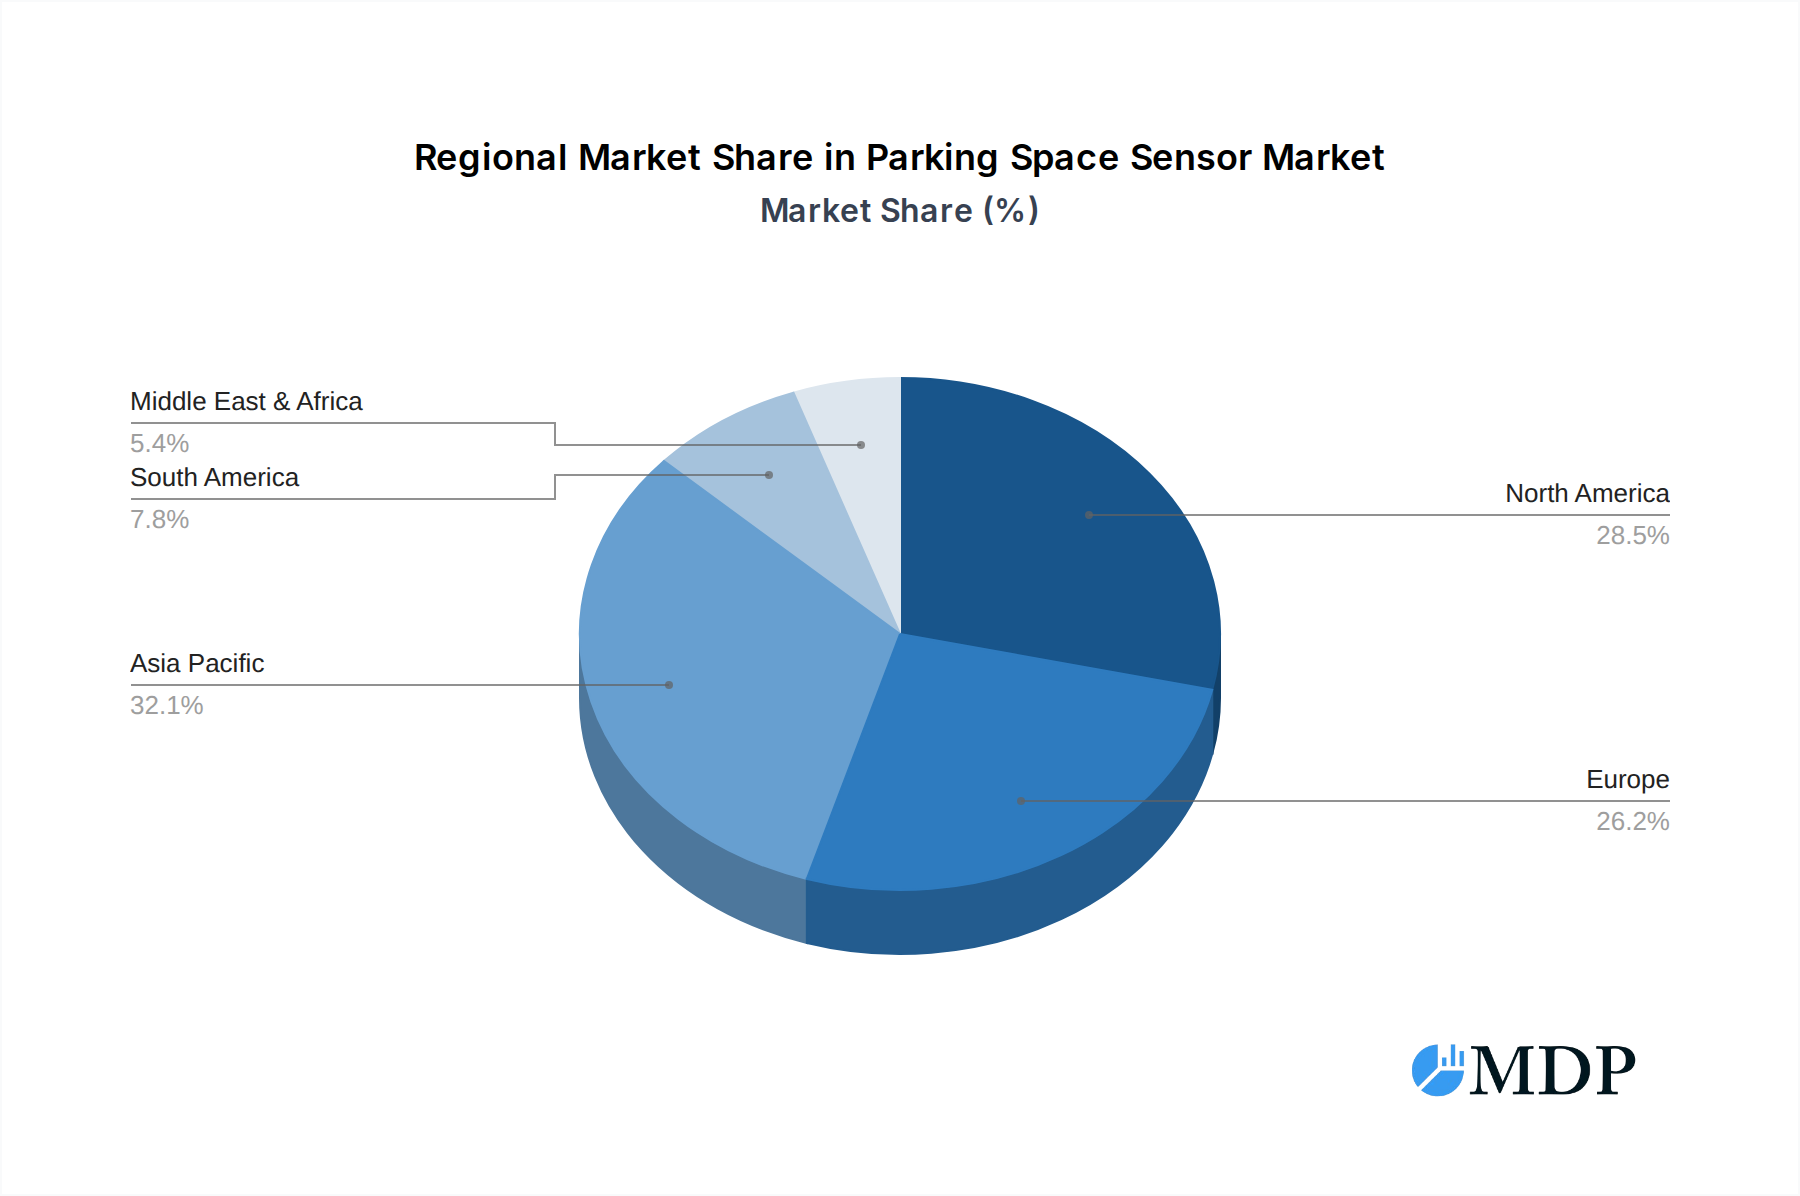
Parking Space Sensor Regional Market Share
Geographic Coverage of Parking Space Sensor
Parking Space Sensor REPORT HIGHLIGHTS
| Aspects | Details |
|---|---|
| Study Period | 2020-2034 |
| Base Year | 2025 |
| Estimated Year | 2026 |
| Forecast Period | 2026-2034 |
| Historical Period | 2020-2025 |
| Growth Rate | CAGR of 23.3% from 2020-2034 |
| Segmentation |
|
Table of Contents
- 1. Introduction
- 1.1. Research Scope
- 1.2. Market Segmentation
- 1.3. Research Methodology
- 1.4. Definitions and Assumptions
- 2. Executive Summary
- 2.1. Introduction
- 3. Market Dynamics
- 3.1. Introduction
- 3.2. Market Drivers
- 3.3. Market Restrains
- 3.4. Market Trends
- 4. Market Factor Analysis
- 4.1. Porters Five Forces
- 4.2. Supply/Value Chain
- 4.3. PESTEL analysis
- 4.4. Market Entropy
- 4.5. Patent/Trademark Analysis
- 5. Global Parking Space Sensor Analysis, Insights and Forecast, 2020-2032
- 5.1. Market Analysis, Insights and Forecast - by Application
- 5.1.1. Commercial Parking Lots
- 5.1.2. Residential Parking Lots
- 5.1.3. Public Parking Lots
- 5.2. Market Analysis, Insights and Forecast - by Types
- 5.2.1. Ultrasonic Sensors
- 5.2.2. Infrared Sensors
- 5.2.3. Magnetic Sensors
- 5.3. Market Analysis, Insights and Forecast - by Region
- 5.3.1. North America
- 5.3.2. South America
- 5.3.3. Europe
- 5.3.4. Middle East & Africa
- 5.3.5. Asia Pacific
- 5.1. Market Analysis, Insights and Forecast - by Application
- 6. North America Parking Space Sensor Analysis, Insights and Forecast, 2020-2032
- 6.1. Market Analysis, Insights and Forecast - by Application
- 6.1.1. Commercial Parking Lots
- 6.1.2. Residential Parking Lots
- 6.1.3. Public Parking Lots
- 6.2. Market Analysis, Insights and Forecast - by Types
- 6.2.1. Ultrasonic Sensors
- 6.2.2. Infrared Sensors
- 6.2.3. Magnetic Sensors
- 6.1. Market Analysis, Insights and Forecast - by Application
- 7. South America Parking Space Sensor Analysis, Insights and Forecast, 2020-2032
- 7.1. Market Analysis, Insights and Forecast - by Application
- 7.1.1. Commercial Parking Lots
- 7.1.2. Residential Parking Lots
- 7.1.3. Public Parking Lots
- 7.2. Market Analysis, Insights and Forecast - by Types
- 7.2.1. Ultrasonic Sensors
- 7.2.2. Infrared Sensors
- 7.2.3. Magnetic Sensors
- 7.1. Market Analysis, Insights and Forecast - by Application
- 8. Europe Parking Space Sensor Analysis, Insights and Forecast, 2020-2032
- 8.1. Market Analysis, Insights and Forecast - by Application
- 8.1.1. Commercial Parking Lots
- 8.1.2. Residential Parking Lots
- 8.1.3. Public Parking Lots
- 8.2. Market Analysis, Insights and Forecast - by Types
- 8.2.1. Ultrasonic Sensors
- 8.2.2. Infrared Sensors
- 8.2.3. Magnetic Sensors
- 8.1. Market Analysis, Insights and Forecast - by Application
- 9. Middle East & Africa Parking Space Sensor Analysis, Insights and Forecast, 2020-2032
- 9.1. Market Analysis, Insights and Forecast - by Application
- 9.1.1. Commercial Parking Lots
- 9.1.2. Residential Parking Lots
- 9.1.3. Public Parking Lots
- 9.2. Market Analysis, Insights and Forecast - by Types
- 9.2.1. Ultrasonic Sensors
- 9.2.2. Infrared Sensors
- 9.2.3. Magnetic Sensors
- 9.1. Market Analysis, Insights and Forecast - by Application
- 10. Asia Pacific Parking Space Sensor Analysis, Insights and Forecast, 2020-2032
- 10.1. Market Analysis, Insights and Forecast - by Application
- 10.1.1. Commercial Parking Lots
- 10.1.2. Residential Parking Lots
- 10.1.3. Public Parking Lots
- 10.2. Market Analysis, Insights and Forecast - by Types
- 10.2.1. Ultrasonic Sensors
- 10.2.2. Infrared Sensors
- 10.2.3. Magnetic Sensors
- 10.1. Market Analysis, Insights and Forecast - by Application
- 11. Competitive Analysis
- 11.1. Global Market Share Analysis 2025
- 11.2. Company Profiles
- 11.2.1 Libelium
- 11.2.1.1. Overview
- 11.2.1.2. Products
- 11.2.1.3. SWOT Analysis
- 11.2.1.4. Recent Developments
- 11.2.1.5. Financials (Based on Availability)
- 11.2.2 Nedap
- 11.2.2.1. Overview
- 11.2.2.2. Products
- 11.2.2.3. SWOT Analysis
- 11.2.2.4. Recent Developments
- 11.2.2.5. Financials (Based on Availability)
- 11.2.3 Bosch
- 11.2.3.1. Overview
- 11.2.3.2. Products
- 11.2.3.3. SWOT Analysis
- 11.2.3.4. Recent Developments
- 11.2.3.5. Financials (Based on Availability)
- 11.2.4 ParkHelp
- 11.2.4.1. Overview
- 11.2.4.2. Products
- 11.2.4.3. SWOT Analysis
- 11.2.4.4. Recent Developments
- 11.2.4.5. Financials (Based on Availability)
- 11.2.5 Smart Parking
- 11.2.5.1. Overview
- 11.2.5.2. Products
- 11.2.5.3. SWOT Analysis
- 11.2.5.4. Recent Developments
- 11.2.5.5. Financials (Based on Availability)
- 11.2.6 WoMaster Group
- 11.2.6.1. Overview
- 11.2.6.2. Products
- 11.2.6.3. SWOT Analysis
- 11.2.6.4. Recent Developments
- 11.2.6.5. Financials (Based on Availability)
- 11.2.7 Parksol
- 11.2.7.1. Overview
- 11.2.7.2. Products
- 11.2.7.3. SWOT Analysis
- 11.2.7.4. Recent Developments
- 11.2.7.5. Financials (Based on Availability)
- 11.2.8 IoT Solutions
- 11.2.8.1. Overview
- 11.2.8.2. Products
- 11.2.8.3. SWOT Analysis
- 11.2.8.4. Recent Developments
- 11.2.8.5. Financials (Based on Availability)
- 11.2.9 Nwave
- 11.2.9.1. Overview
- 11.2.9.2. Products
- 11.2.9.3. SWOT Analysis
- 11.2.9.4. Recent Developments
- 11.2.9.5. Financials (Based on Availability)
- 11.2.10 Enkoa
- 11.2.10.1. Overview
- 11.2.10.2. Products
- 11.2.10.3. SWOT Analysis
- 11.2.10.4. Recent Developments
- 11.2.10.5. Financials (Based on Availability)
- 11.2.11 PlacePod
- 11.2.11.1. Overview
- 11.2.11.2. Products
- 11.2.11.3. SWOT Analysis
- 11.2.11.4. Recent Developments
- 11.2.11.5. Financials (Based on Availability)
- 11.2.12 Quercus
- 11.2.12.1. Overview
- 11.2.12.2. Products
- 11.2.12.3. SWOT Analysis
- 11.2.12.4. Recent Developments
- 11.2.12.5. Financials (Based on Availability)
- 11.2.13 MOKOSmart
- 11.2.13.1. Overview
- 11.2.13.2. Products
- 11.2.13.3. SWOT Analysis
- 11.2.13.4. Recent Developments
- 11.2.13.5. Financials (Based on Availability)
- 11.2.14 Optex
- 11.2.14.1. Overview
- 11.2.14.2. Products
- 11.2.14.3. SWOT Analysis
- 11.2.14.4. Recent Developments
- 11.2.14.5. Financials (Based on Availability)
- 11.2.15 INDECT
- 11.2.15.1. Overview
- 11.2.15.2. Products
- 11.2.15.3. SWOT Analysis
- 11.2.15.4. Recent Developments
- 11.2.15.5. Financials (Based on Availability)
- 11.2.16 Banner Engineering
- 11.2.16.1. Overview
- 11.2.16.2. Products
- 11.2.16.3. SWOT Analysis
- 11.2.16.4. Recent Developments
- 11.2.16.5. Financials (Based on Availability)
- 11.2.17 WiiHey
- 11.2.17.1. Overview
- 11.2.17.2. Products
- 11.2.17.3. SWOT Analysis
- 11.2.17.4. Recent Developments
- 11.2.17.5. Financials (Based on Availability)
- 11.2.18 Intercomp
- 11.2.18.1. Overview
- 11.2.18.2. Products
- 11.2.18.3. SWOT Analysis
- 11.2.18.4. Recent Developments
- 11.2.18.5. Financials (Based on Availability)
- 11.2.19 HTS Group
- 11.2.19.1. Overview
- 11.2.19.2. Products
- 11.2.19.3. SWOT Analysis
- 11.2.19.4. Recent Developments
- 11.2.19.5. Financials (Based on Availability)
- 11.2.1 Libelium
List of Figures
- Figure 1: Global Parking Space Sensor Revenue Breakdown (billion, %) by Region 2025 & 2033
- Figure 2: Global Parking Space Sensor Volume Breakdown (K, %) by Region 2025 & 2033
- Figure 3: North America Parking Space Sensor Revenue (billion), by Application 2025 & 2033
- Figure 4: North America Parking Space Sensor Volume (K), by Application 2025 & 2033
- Figure 5: North America Parking Space Sensor Revenue Share (%), by Application 2025 & 2033
- Figure 6: North America Parking Space Sensor Volume Share (%), by Application 2025 & 2033
- Figure 7: North America Parking Space Sensor Revenue (billion), by Types 2025 & 2033
- Figure 8: North America Parking Space Sensor Volume (K), by Types 2025 & 2033
- Figure 9: North America Parking Space Sensor Revenue Share (%), by Types 2025 & 2033
- Figure 10: North America Parking Space Sensor Volume Share (%), by Types 2025 & 2033
- Figure 11: North America Parking Space Sensor Revenue (billion), by Country 2025 & 2033
- Figure 12: North America Parking Space Sensor Volume (K), by Country 2025 & 2033
- Figure 13: North America Parking Space Sensor Revenue Share (%), by Country 2025 & 2033
- Figure 14: North America Parking Space Sensor Volume Share (%), by Country 2025 & 2033
- Figure 15: South America Parking Space Sensor Revenue (billion), by Application 2025 & 2033
- Figure 16: South America Parking Space Sensor Volume (K), by Application 2025 & 2033
- Figure 17: South America Parking Space Sensor Revenue Share (%), by Application 2025 & 2033
- Figure 18: South America Parking Space Sensor Volume Share (%), by Application 2025 & 2033
- Figure 19: South America Parking Space Sensor Revenue (billion), by Types 2025 & 2033
- Figure 20: South America Parking Space Sensor Volume (K), by Types 2025 & 2033
- Figure 21: South America Parking Space Sensor Revenue Share (%), by Types 2025 & 2033
- Figure 22: South America Parking Space Sensor Volume Share (%), by Types 2025 & 2033
- Figure 23: South America Parking Space Sensor Revenue (billion), by Country 2025 & 2033
- Figure 24: South America Parking Space Sensor Volume (K), by Country 2025 & 2033
- Figure 25: South America Parking Space Sensor Revenue Share (%), by Country 2025 & 2033
- Figure 26: South America Parking Space Sensor Volume Share (%), by Country 2025 & 2033
- Figure 27: Europe Parking Space Sensor Revenue (billion), by Application 2025 & 2033
- Figure 28: Europe Parking Space Sensor Volume (K), by Application 2025 & 2033
- Figure 29: Europe Parking Space Sensor Revenue Share (%), by Application 2025 & 2033
- Figure 30: Europe Parking Space Sensor Volume Share (%), by Application 2025 & 2033
- Figure 31: Europe Parking Space Sensor Revenue (billion), by Types 2025 & 2033
- Figure 32: Europe Parking Space Sensor Volume (K), by Types 2025 & 2033
- Figure 33: Europe Parking Space Sensor Revenue Share (%), by Types 2025 & 2033
- Figure 34: Europe Parking Space Sensor Volume Share (%), by Types 2025 & 2033
- Figure 35: Europe Parking Space Sensor Revenue (billion), by Country 2025 & 2033
- Figure 36: Europe Parking Space Sensor Volume (K), by Country 2025 & 2033
- Figure 37: Europe Parking Space Sensor Revenue Share (%), by Country 2025 & 2033
- Figure 38: Europe Parking Space Sensor Volume Share (%), by Country 2025 & 2033
- Figure 39: Middle East & Africa Parking Space Sensor Revenue (billion), by Application 2025 & 2033
- Figure 40: Middle East & Africa Parking Space Sensor Volume (K), by Application 2025 & 2033
- Figure 41: Middle East & Africa Parking Space Sensor Revenue Share (%), by Application 2025 & 2033
- Figure 42: Middle East & Africa Parking Space Sensor Volume Share (%), by Application 2025 & 2033
- Figure 43: Middle East & Africa Parking Space Sensor Revenue (billion), by Types 2025 & 2033
- Figure 44: Middle East & Africa Parking Space Sensor Volume (K), by Types 2025 & 2033
- Figure 45: Middle East & Africa Parking Space Sensor Revenue Share (%), by Types 2025 & 2033
- Figure 46: Middle East & Africa Parking Space Sensor Volume Share (%), by Types 2025 & 2033
- Figure 47: Middle East & Africa Parking Space Sensor Revenue (billion), by Country 2025 & 2033
- Figure 48: Middle East & Africa Parking Space Sensor Volume (K), by Country 2025 & 2033
- Figure 49: Middle East & Africa Parking Space Sensor Revenue Share (%), by Country 2025 & 2033
- Figure 50: Middle East & Africa Parking Space Sensor Volume Share (%), by Country 2025 & 2033
- Figure 51: Asia Pacific Parking Space Sensor Revenue (billion), by Application 2025 & 2033
- Figure 52: Asia Pacific Parking Space Sensor Volume (K), by Application 2025 & 2033
- Figure 53: Asia Pacific Parking Space Sensor Revenue Share (%), by Application 2025 & 2033
- Figure 54: Asia Pacific Parking Space Sensor Volume Share (%), by Application 2025 & 2033
- Figure 55: Asia Pacific Parking Space Sensor Revenue (billion), by Types 2025 & 2033
- Figure 56: Asia Pacific Parking Space Sensor Volume (K), by Types 2025 & 2033
- Figure 57: Asia Pacific Parking Space Sensor Revenue Share (%), by Types 2025 & 2033
- Figure 58: Asia Pacific Parking Space Sensor Volume Share (%), by Types 2025 & 2033
- Figure 59: Asia Pacific Parking Space Sensor Revenue (billion), by Country 2025 & 2033
- Figure 60: Asia Pacific Parking Space Sensor Volume (K), by Country 2025 & 2033
- Figure 61: Asia Pacific Parking Space Sensor Revenue Share (%), by Country 2025 & 2033
- Figure 62: Asia Pacific Parking Space Sensor Volume Share (%), by Country 2025 & 2033
List of Tables
- Table 1: Global Parking Space Sensor Revenue billion Forecast, by Application 2020 & 2033
- Table 2: Global Parking Space Sensor Volume K Forecast, by Application 2020 & 2033
- Table 3: Global Parking Space Sensor Revenue billion Forecast, by Types 2020 & 2033
- Table 4: Global Parking Space Sensor Volume K Forecast, by Types 2020 & 2033
- Table 5: Global Parking Space Sensor Revenue billion Forecast, by Region 2020 & 2033
- Table 6: Global Parking Space Sensor Volume K Forecast, by Region 2020 & 2033
- Table 7: Global Parking Space Sensor Revenue billion Forecast, by Application 2020 & 2033
- Table 8: Global Parking Space Sensor Volume K Forecast, by Application 2020 & 2033
- Table 9: Global Parking Space Sensor Revenue billion Forecast, by Types 2020 & 2033
- Table 10: Global Parking Space Sensor Volume K Forecast, by Types 2020 & 2033
- Table 11: Global Parking Space Sensor Revenue billion Forecast, by Country 2020 & 2033
- Table 12: Global Parking Space Sensor Volume K Forecast, by Country 2020 & 2033
- Table 13: United States Parking Space Sensor Revenue (billion) Forecast, by Application 2020 & 2033
- Table 14: United States Parking Space Sensor Volume (K) Forecast, by Application 2020 & 2033
- Table 15: Canada Parking Space Sensor Revenue (billion) Forecast, by Application 2020 & 2033
- Table 16: Canada Parking Space Sensor Volume (K) Forecast, by Application 2020 & 2033
- Table 17: Mexico Parking Space Sensor Revenue (billion) Forecast, by Application 2020 & 2033
- Table 18: Mexico Parking Space Sensor Volume (K) Forecast, by Application 2020 & 2033
- Table 19: Global Parking Space Sensor Revenue billion Forecast, by Application 2020 & 2033
- Table 20: Global Parking Space Sensor Volume K Forecast, by Application 2020 & 2033
- Table 21: Global Parking Space Sensor Revenue billion Forecast, by Types 2020 & 2033
- Table 22: Global Parking Space Sensor Volume K Forecast, by Types 2020 & 2033
- Table 23: Global Parking Space Sensor Revenue billion Forecast, by Country 2020 & 2033
- Table 24: Global Parking Space Sensor Volume K Forecast, by Country 2020 & 2033
- Table 25: Brazil Parking Space Sensor Revenue (billion) Forecast, by Application 2020 & 2033
- Table 26: Brazil Parking Space Sensor Volume (K) Forecast, by Application 2020 & 2033
- Table 27: Argentina Parking Space Sensor Revenue (billion) Forecast, by Application 2020 & 2033
- Table 28: Argentina Parking Space Sensor Volume (K) Forecast, by Application 2020 & 2033
- Table 29: Rest of South America Parking Space Sensor Revenue (billion) Forecast, by Application 2020 & 2033
- Table 30: Rest of South America Parking Space Sensor Volume (K) Forecast, by Application 2020 & 2033
- Table 31: Global Parking Space Sensor Revenue billion Forecast, by Application 2020 & 2033
- Table 32: Global Parking Space Sensor Volume K Forecast, by Application 2020 & 2033
- Table 33: Global Parking Space Sensor Revenue billion Forecast, by Types 2020 & 2033
- Table 34: Global Parking Space Sensor Volume K Forecast, by Types 2020 & 2033
- Table 35: Global Parking Space Sensor Revenue billion Forecast, by Country 2020 & 2033
- Table 36: Global Parking Space Sensor Volume K Forecast, by Country 2020 & 2033
- Table 37: United Kingdom Parking Space Sensor Revenue (billion) Forecast, by Application 2020 & 2033
- Table 38: United Kingdom Parking Space Sensor Volume (K) Forecast, by Application 2020 & 2033
- Table 39: Germany Parking Space Sensor Revenue (billion) Forecast, by Application 2020 & 2033
- Table 40: Germany Parking Space Sensor Volume (K) Forecast, by Application 2020 & 2033
- Table 41: France Parking Space Sensor Revenue (billion) Forecast, by Application 2020 & 2033
- Table 42: France Parking Space Sensor Volume (K) Forecast, by Application 2020 & 2033
- Table 43: Italy Parking Space Sensor Revenue (billion) Forecast, by Application 2020 & 2033
- Table 44: Italy Parking Space Sensor Volume (K) Forecast, by Application 2020 & 2033
- Table 45: Spain Parking Space Sensor Revenue (billion) Forecast, by Application 2020 & 2033
- Table 46: Spain Parking Space Sensor Volume (K) Forecast, by Application 2020 & 2033
- Table 47: Russia Parking Space Sensor Revenue (billion) Forecast, by Application 2020 & 2033
- Table 48: Russia Parking Space Sensor Volume (K) Forecast, by Application 2020 & 2033
- Table 49: Benelux Parking Space Sensor Revenue (billion) Forecast, by Application 2020 & 2033
- Table 50: Benelux Parking Space Sensor Volume (K) Forecast, by Application 2020 & 2033
- Table 51: Nordics Parking Space Sensor Revenue (billion) Forecast, by Application 2020 & 2033
- Table 52: Nordics Parking Space Sensor Volume (K) Forecast, by Application 2020 & 2033
- Table 53: Rest of Europe Parking Space Sensor Revenue (billion) Forecast, by Application 2020 & 2033
- Table 54: Rest of Europe Parking Space Sensor Volume (K) Forecast, by Application 2020 & 2033
- Table 55: Global Parking Space Sensor Revenue billion Forecast, by Application 2020 & 2033
- Table 56: Global Parking Space Sensor Volume K Forecast, by Application 2020 & 2033
- Table 57: Global Parking Space Sensor Revenue billion Forecast, by Types 2020 & 2033
- Table 58: Global Parking Space Sensor Volume K Forecast, by Types 2020 & 2033
- Table 59: Global Parking Space Sensor Revenue billion Forecast, by Country 2020 & 2033
- Table 60: Global Parking Space Sensor Volume K Forecast, by Country 2020 & 2033
- Table 61: Turkey Parking Space Sensor Revenue (billion) Forecast, by Application 2020 & 2033
- Table 62: Turkey Parking Space Sensor Volume (K) Forecast, by Application 2020 & 2033
- Table 63: Israel Parking Space Sensor Revenue (billion) Forecast, by Application 2020 & 2033
- Table 64: Israel Parking Space Sensor Volume (K) Forecast, by Application 2020 & 2033
- Table 65: GCC Parking Space Sensor Revenue (billion) Forecast, by Application 2020 & 2033
- Table 66: GCC Parking Space Sensor Volume (K) Forecast, by Application 2020 & 2033
- Table 67: North Africa Parking Space Sensor Revenue (billion) Forecast, by Application 2020 & 2033
- Table 68: North Africa Parking Space Sensor Volume (K) Forecast, by Application 2020 & 2033
- Table 69: South Africa Parking Space Sensor Revenue (billion) Forecast, by Application 2020 & 2033
- Table 70: South Africa Parking Space Sensor Volume (K) Forecast, by Application 2020 & 2033
- Table 71: Rest of Middle East & Africa Parking Space Sensor Revenue (billion) Forecast, by Application 2020 & 2033
- Table 72: Rest of Middle East & Africa Parking Space Sensor Volume (K) Forecast, by Application 2020 & 2033
- Table 73: Global Parking Space Sensor Revenue billion Forecast, by Application 2020 & 2033
- Table 74: Global Parking Space Sensor Volume K Forecast, by Application 2020 & 2033
- Table 75: Global Parking Space Sensor Revenue billion Forecast, by Types 2020 & 2033
- Table 76: Global Parking Space Sensor Volume K Forecast, by Types 2020 & 2033
- Table 77: Global Parking Space Sensor Revenue billion Forecast, by Country 2020 & 2033
- Table 78: Global Parking Space Sensor Volume K Forecast, by Country 2020 & 2033
- Table 79: China Parking Space Sensor Revenue (billion) Forecast, by Application 2020 & 2033
- Table 80: China Parking Space Sensor Volume (K) Forecast, by Application 2020 & 2033
- Table 81: India Parking Space Sensor Revenue (billion) Forecast, by Application 2020 & 2033
- Table 82: India Parking Space Sensor Volume (K) Forecast, by Application 2020 & 2033
- Table 83: Japan Parking Space Sensor Revenue (billion) Forecast, by Application 2020 & 2033
- Table 84: Japan Parking Space Sensor Volume (K) Forecast, by Application 2020 & 2033
- Table 85: South Korea Parking Space Sensor Revenue (billion) Forecast, by Application 2020 & 2033
- Table 86: South Korea Parking Space Sensor Volume (K) Forecast, by Application 2020 & 2033
- Table 87: ASEAN Parking Space Sensor Revenue (billion) Forecast, by Application 2020 & 2033
- Table 88: ASEAN Parking Space Sensor Volume (K) Forecast, by Application 2020 & 2033
- Table 89: Oceania Parking Space Sensor Revenue (billion) Forecast, by Application 2020 & 2033
- Table 90: Oceania Parking Space Sensor Volume (K) Forecast, by Application 2020 & 2033
- Table 91: Rest of Asia Pacific Parking Space Sensor Revenue (billion) Forecast, by Application 2020 & 2033
- Table 92: Rest of Asia Pacific Parking Space Sensor Volume (K) Forecast, by Application 2020 & 2033
Frequently Asked Questions
1. What is the projected Compound Annual Growth Rate (CAGR) of the Parking Space Sensor?
The projected CAGR is approximately 23.3%.
2. Which companies are prominent players in the Parking Space Sensor?
Key companies in the market include Libelium, Nedap, Bosch, ParkHelp, Smart Parking, WoMaster Group, Parksol, IoT Solutions, Nwave, Enkoa, PlacePod, Quercus, MOKOSmart, Optex, INDECT, Banner Engineering, WiiHey, Intercomp, HTS Group.
3. What are the main segments of the Parking Space Sensor?
The market segments include Application, Types.
4. Can you provide details about the market size?
The market size is estimated to be USD 10.22 billion as of 2022.
5. What are some drivers contributing to market growth?
N/A
6. What are the notable trends driving market growth?
N/A
7. Are there any restraints impacting market growth?
N/A
8. Can you provide examples of recent developments in the market?
N/A
9. What pricing options are available for accessing the report?
Pricing options include single-user, multi-user, and enterprise licenses priced at USD 3350.00, USD 5025.00, and USD 6700.00 respectively.
10. Is the market size provided in terms of value or volume?
The market size is provided in terms of value, measured in billion and volume, measured in K.
11. Are there any specific market keywords associated with the report?
Yes, the market keyword associated with the report is "Parking Space Sensor," which aids in identifying and referencing the specific market segment covered.
12. How do I determine which pricing option suits my needs best?
The pricing options vary based on user requirements and access needs. Individual users may opt for single-user licenses, while businesses requiring broader access may choose multi-user or enterprise licenses for cost-effective access to the report.
13. Are there any additional resources or data provided in the Parking Space Sensor report?
While the report offers comprehensive insights, it's advisable to review the specific contents or supplementary materials provided to ascertain if additional resources or data are available.
14. How can I stay updated on further developments or reports in the Parking Space Sensor?
To stay informed about further developments, trends, and reports in the Parking Space Sensor, consider subscribing to industry newsletters, following relevant companies and organizations, or regularly checking reputable industry news sources and publications.
Methodology
Step 1 - Identification of Relevant Samples Size from Population Database


Step 2 - Approaches for Defining Global Market Size (Value, Volume* & Price*)

Note*: In applicable scenarios
Step 3 - Data Sources
Primary Research
- Web Analytics
- Survey Reports
- Research Institute
- Latest Research Reports
- Opinion Leaders
Secondary Research
- Annual Reports
- White Paper
- Latest Press Release
- Industry Association
- Paid Database
- Investor Presentations

Step 4 - Data Triangulation
Involves using different sources of information in order to increase the validity of a study
These sources are likely to be stakeholders in a program - participants, other researchers, program staff, other community members, and so on.
Then we put all data in single framework & apply various statistical tools to find out the dynamic on the market.
During the analysis stage, feedback from the stakeholder groups would be compared to determine areas of agreement as well as areas of divergence