

Key Insights
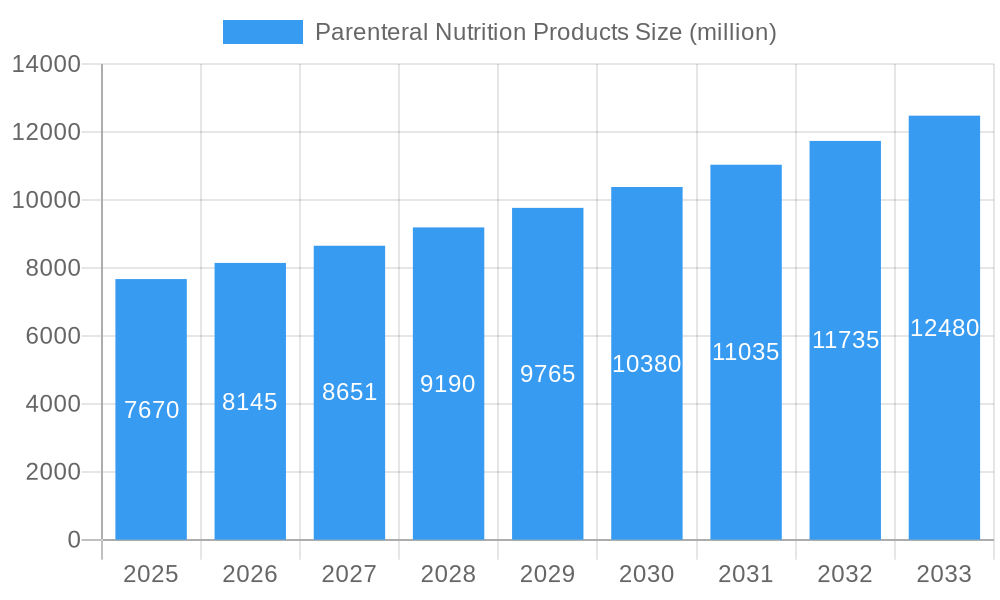
The Parenteral Nutrition Products Market, a critical segment within the broader Medical Nutrition Market, is exhibiting robust expansion driven by an escalating global burden of chronic diseases, a burgeoning geriatric population, and significant advancements in nutritional support therapies. Valued at an estimated $7.94 billion in 2024, the market is poised for substantial growth, projected to reach approximately $14.07 billion by 2034, demonstrating a compound annual growth rate (CAGR) of 5.9% over the forecast period. This upward trajectory is fundamentally propelled by the increasing incidence of conditions such as short bowel syndrome, severe gastrointestinal disorders, and various forms of cancer-related malnutrition that necessitate parenteral nutritional support.
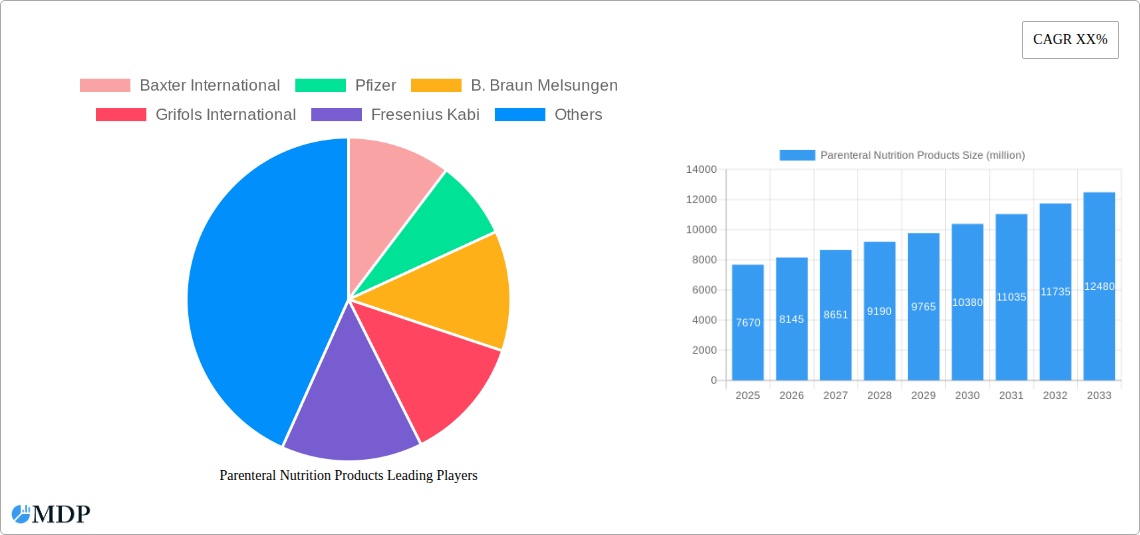
Parenteral Nutrition Products Market Size (In Billion)
Technological innovations, particularly in the development of multi-chamber bags and specialized lipid emulsions, are enhancing the safety, efficacy, and ease of administration of parenteral nutrition. The growing preference for the Home Healthcare Market, facilitating patient recovery and management outside traditional clinical settings, further contributes to market momentum. Macro tailwinds include improving healthcare infrastructure in emerging economies, increasing awareness among healthcare professionals regarding the critical role of nutritional intervention, and favorable reimbursement policies for both hospital and home-based PN therapies. The shift towards personalized nutrition and the integration of advanced monitoring systems for patients receiving Infusion Therapy Market solutions are also shaping the competitive landscape. As healthcare systems globally prioritize patient outcomes and cost-efficiency, the demand for sophisticated and user-friendly parenteral nutrition products is expected to intensify, making the Parenteral Nutrition Products Market a dynamic and strategically important sector within the healthcare industry.
Parenteral Nutrition Products Company Market Share
Dominant Product Segment Analysis in Parenteral Nutrition Products Market
Within the diverse landscape of the Parenteral Nutrition Products Market, the Ready-to-Use PN Bags Market segment currently holds the dominant revenue share, largely attributed to its inherent advantages in terms of convenience, safety, and streamlined clinical workflow. These pre-formulated, multi-chamber bags contain a balanced combination of macronutrients (amino acids, lipids, and carbohydrates) and micronutrients (vitamins, trace elements, and electrolytes), eliminating the need for complex compounding processes at the point of care. This reduces the risk of medication errors, contamination, and microbial growth, thereby enhancing patient safety and significantly decreasing preparation time for healthcare professionals. The sterility assurance and extended shelf-life offered by these products are particularly appealing to Hospital Nutrition Market settings, where efficiency and patient safety are paramount.
Major players such as Fresenius Kabi, Baxter International, and B. Braun Melsungen have heavily invested in the research and development, as well as the manufacturing, of these sophisticated Ready-to-Use PN Bags Market products. Their dominance is a result of established supply chains, robust regulatory approvals, and extensive marketing and distribution networks that cater to a global patient population. While the Compounded Parenteral Nutrition Market offers tailored formulations for specific patient needs (e.g., neonates, severe organ dysfunction), the complexities and higher labor costs associated with their preparation, alongside potential risks of compounding errors, have tempered their overall market share compared to their ready-to-use counterparts. However, specialized compounded solutions remain indispensable for a niche patient population requiring highly individualized nutrient profiles. The growing emphasis on reducing healthcare-associated infections and optimizing resource utilization continues to bolster the dominance of the Ready-to-Use PN Bags Market segment, with its share expected to further consolidate as healthcare facilities worldwide adopt standardized and safer nutritional support protocols. The ongoing innovation in lipid emulsion formulations, such as those incorporating fish oil, also contributes to the enhanced therapeutic profile of these ready-to-use solutions, making them a preferred choice in a wide array of clinical indications.
Key Market Drivers & Constraints in Parenteral Nutrition Products Market
The Parenteral Nutrition Products Market is influenced by a confluence of powerful drivers and inherent constraints, each with quantifiable impacts. One significant driver is the rising global incidence of chronic diseases, which often lead to malabsorption, intestinal failure, or severe malnutrition requiring PN. For instance, the global burden of inflammatory bowel diseases (IBD), including Crohn's Disease, is estimated to affect over 6.8 million individuals by 2025, a patient cohort frequently requiring nutritional support. Similarly, cancer-related malnutrition affects up to 80% of oncology patients, directly driving demand for effective PN solutions. The increasing number of surgical procedures, particularly complex gastrointestinal surgeries, also contributes to the need for perioperative nutritional management.
Another critical driver is the rapidly expanding geriatric population. Individuals aged 65 and above are highly susceptible to chronic conditions, polypharmacy, and age-related physiological changes that impair nutrient intake and absorption. With the global geriatric population projected to exceed 1.6 billion by 2050, the demand for nutritional support, including parenteral nutrition, is set to surge dramatically. Furthermore, continuous advancements in PN formulations, such as the development of optimized lipid emulsions containing specific fatty acid profiles, enhance patient outcomes and reduce complications, thereby expanding clinical adoption. For example, the incorporation of omega-3 fatty acids has been shown to improve anti-inflammatory responses.
Conversely, the high cost associated with PN therapy presents a substantial constraint. The annual cost for home parenteral nutrition can exceed $100,000 per patient in developed economies, making it a significant financial burden for healthcare systems and patients alike, especially in regions with limited insurance coverage or lower per capita healthcare expenditure. The risk of complications, such as central line-associated bloodstream infections (CLABSIs) with reported rates ranging from 0.9 to 4.5 per 1,000 catheter-days for PN patients, and parenteral nutrition-associated liver disease, also necessitates vigilant monitoring and specialized care, adding to the overall cost and complexity of the therapy. Lastly, stringent regulatory requirements for manufacturing, labeling, and quality control of parenteral nutrition products, particularly for the Amino Acids Market and Lipids Emulsion Market components, impose significant R&D and compliance costs on manufacturers, which can slow product innovation and market entry for smaller players.
Competitive Ecosystem of Parenteral Nutrition Products Market
The Parenteral Nutrition Products Market is characterized by the presence of several established global pharmaceutical and medical nutrition companies, alongside specialized regional players. These companies continually strive for innovation in formulations, delivery systems, and patient support services to maintain and expand their market footprint. The competitive landscape is influenced by factors such as product efficacy, safety profiles, regulatory approvals, and global distribution capabilities.
- Baxter International: A global leader in clinical nutrition, Baxter offers a comprehensive portfolio of parenteral nutrition solutions, including multi-chamber bags and premixed formulations, alongside advanced infusion pumps and related medical devices. Their focus is on improving patient outcomes and simplifying care delivery in both hospital and home settings.
- Pfizer: While primarily known for its pharmaceutical products, Pfizer has a presence in the sterile injectables and nutrition support space, indirectly contributing to the Parenteral Nutrition Products Market through a range of critical care and hospital-based therapies.
- B. Braun Melsungen: A prominent provider of healthcare solutions, B. Braun offers a wide range of parenteral nutrition products, including ready-to-use solutions, individualized compounding services, and infusion technology, emphasizing patient safety and therapy efficacy.
- Grifols International: Specializes in plasma-derived medicines and sterile solutions. Grifols contributes to the parenteral nutrition ecosystem through its range of intravenous solutions and components critical for nutritional support, focusing on patient well-being and clinical reliability.
- Fresenius Kabi: A global leader in clinical nutrition, Fresenius Kabi offers an extensive portfolio encompassing parenteral and enteral nutrition, IV drugs, and medical devices. They are particularly strong in multi-chamber bag technology and advanced lipid emulsions, providing comprehensive solutions for critical and chronic care.
- Otsuka Pharmaceutical: Focused on pharmaceuticals and nutraceuticals, Otsuka provides a range of medical nutrition products, including specialized parenteral solutions, particularly prominent in Asian markets. Their strategic emphasis is on addressing unmet medical needs through innovative research and development.
- Teva Pharmaceutical: A leading generic pharmaceutical company, Teva may contribute to the Parenteral Nutrition Products Market through its portfolio of sterile injectable medications and bulk pharmaceutical ingredients, essential for compounding various nutritional solutions.
- Sichuan Kelun Pharmaceutical: A significant player in the Chinese pharmaceutical market, Sichuan Kelun Pharmaceutical has expanded its presence in the parenteral nutrition sector, offering a range of IV solutions and nutritional products, leveraging its strong domestic manufacturing and distribution capabilities.
Recent Developments & Milestones in Parenteral Nutrition Products Market
The Parenteral Nutrition Products Market continues to evolve with key strategic advancements and regulatory shifts aimed at enhancing patient safety, improving therapeutic outcomes, and expanding accessibility.
- Q4 2023: Introduction of a novel multi-chamber bag formulation integrating advanced lipid emulsions, including those with higher omega-3 fatty acid content, for enhanced patient outcomes, specifically targeting critically ill adults with inflammatory conditions.
- Q3 2023: Regulatory approval received in key European markets for a pediatric-specific parenteral nutrition solution, addressing the unique nutritional needs of neonates and infants with conditions such as short bowel syndrome, offering precise nutrient ratios and improved osmolality.
- Q2 2023: Major collaboration announced between a leading pharmaceutical company and a medical device manufacturer to develop integrated smart infusion pumps with built-in dose error reduction software, specifically designed for improved home parenteral nutrition delivery and remote patient monitoring.
- Q1 2024: Launch of an educational initiative focusing on optimizing clinical practices for parenteral nutrition administration in oncology settings, aiming to reduce malnutrition rates in cancer patients undergoing chemotherapy and radiation therapies by improving adherence to evidence-based guidelines.
- Q4 2024: Expansion of manufacturing capabilities by a prominent market player in the Asia Pacific region, specifically targeting an increased production volume for Ready-to-Use PN Bags Market products to meet the escalating regional demand driven by improving healthcare access and rising prevalence of chronic diseases.
- Q1 2025: A significant partnership formed between a leading provider of Compounded Parenteral Nutrition Market solutions and a logistics firm to enhance cold chain distribution networks, ensuring the integrity and timely delivery of customized PN formulations to remote Home Healthcare Market patients.
Regional Market Breakdown for Parenteral Nutrition Products Market
The global Parenteral Nutrition Products Market exhibits distinct regional dynamics, influenced by varying healthcare infrastructures, disease prevalence, aging populations, and economic factors. While the overall market projects a 5.9% CAGR, regional growth rates and market shares diverge significantly.
North America holds the largest revenue share in the Parenteral Nutrition Products Market, driven by high healthcare expenditure, a significant prevalence of chronic diseases requiring nutritional support, and advanced clinical practices. The United States, in particular, accounts for a substantial portion of this share due to its well-established healthcare system and a high adoption rate of advanced PN therapies, including a robust Home Healthcare Market. The region is expected to demonstrate a moderate CAGR of around 5.0%, maintaining its leadership position through continuous innovation in product formulations and delivery systems, alongside favorable reimbursement policies.
Europe represents the second-largest market, characterized by an aging population and high awareness of malnutrition. Countries such as Germany, France, and the UK contribute significantly, benefiting from established healthcare systems and increasing utilization of ready-to-use PN solutions. The European market is anticipated to grow at a CAGR of approximately 4.8%, slightly slower than the global average, reflecting market maturity but sustained demand from an increasing number of patients with gastrointestinal disorders and cancer.
Asia Pacific is identified as the fastest-growing region in the Parenteral Nutrition Products Market, projected to achieve a CAGR of approximately 7.5%. This rapid expansion is primarily fueled by a large and expanding patient pool, improving healthcare infrastructure, increasing disposable incomes, and rising awareness of clinical nutrition. Countries like China, India, and Japan are at the forefront of this growth, with significant investments in hospital facilities and a growing emphasis on managing conditions that necessitate the use of Gastrointestinal Therapeutics Market and nutritional interventions. The region's expanding geriatric population and the increasing prevalence of malnutrition in critical care settings are key demand drivers.
Latin America and the Middle East & Africa (MEA) regions collectively represent emerging markets, experiencing promising growth rates, estimated at CAGRs of around 6.5% and 6.0%, respectively. These regions are characterized by increasing healthcare investments, a rising incidence of chronic diseases, and improving access to specialized medical care. However, market penetration and adoption rates are comparatively lower than in developed regions, offering substantial untapped potential for future growth as healthcare systems mature and economic conditions improve.
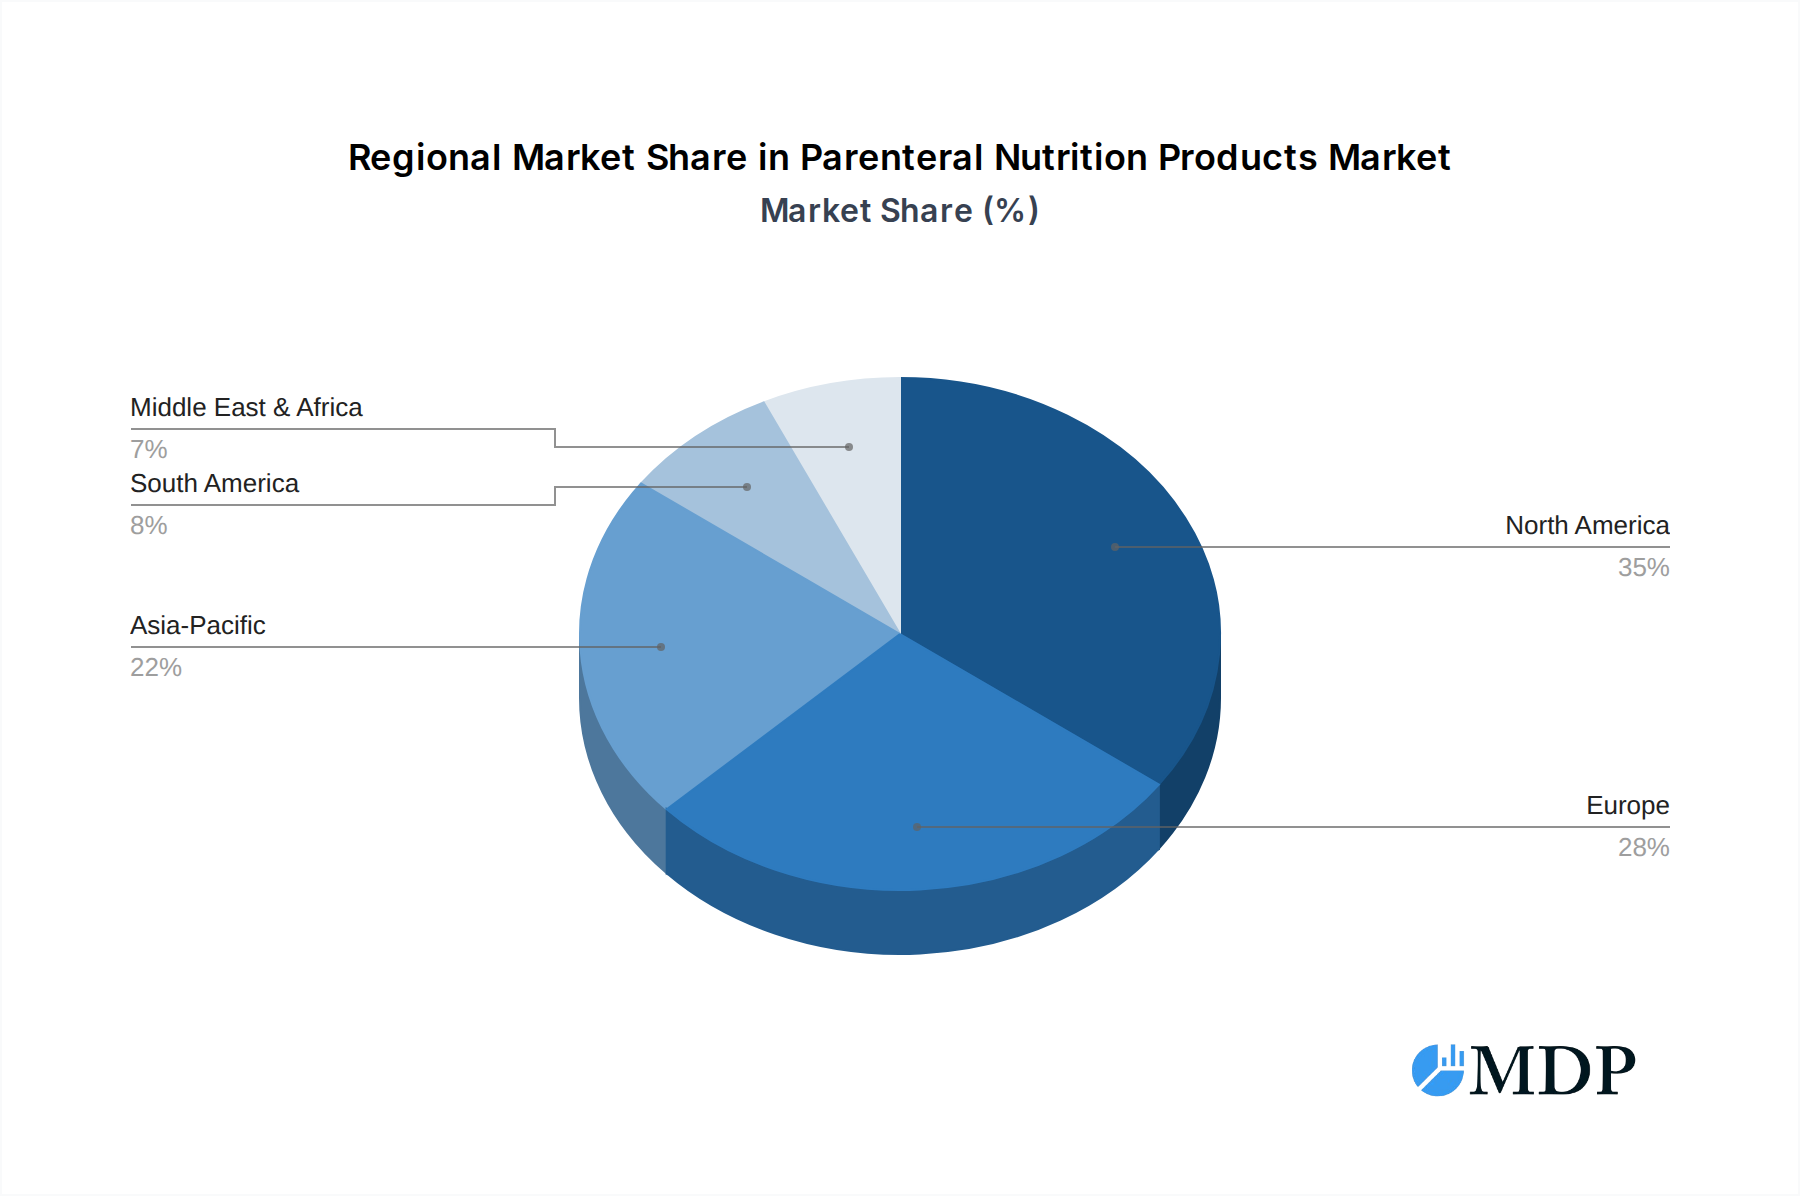
Parenteral Nutrition Products Regional Market Share
Pricing Dynamics & Margin Pressure in Parenteral Nutrition Products Market
The Parenteral Nutrition Products Market exhibits complex pricing dynamics and is subject to significant margin pressures influenced by several factors across the value chain. Average selling prices (ASPs) for parenteral nutrition products vary considerably depending on the formulation complexity, delivery format (ready-to-use vs. compounded), nutrient composition (e.g., specialized Amino Acids Market or Lipids Emulsion Market), and regional market competition. Ready-to-Use PN Bags Market generally command a premium over bulk components due to their inherent convenience, reduced preparation time, and lower risk of contamination, justifying higher ASPs for hospitals and home care providers.
Margin structures throughout the value chain are influenced by raw material costs, which can be volatile due to commodity cycles for amino acids, dextrose, and lipid sources. Manufacturing complexities, including aseptic processing and sterile packaging, also contribute substantially to production costs. Regulatory compliance, encompassing stringent quality control and extensive clinical trials, adds another layer of cost, particularly for novel formulations or product expansions into new therapeutic indications. Competitive intensity among key players like Fresenius Kabi, Baxter International, and B. Braun Melsungen often leads to pricing pressures, especially in tendering processes for large Hospital Nutrition Market contracts. Generic competition for basic components and less complex formulations further erodes margins. Innovations in delivery systems, such as advanced infusion pumps, can create opportunities for premium pricing, but also necessitate significant R&D investment. Moreover, the shift towards the Home Healthcare Market introduces new cost levers related to logistics, distribution, and patient support services, which can impact overall profitability. Manufacturers must balance innovation with cost-efficiency to sustain margins in this highly regulated and competitive market segment.
Customer Segmentation & Buying Behavior in Parenteral Nutrition Products Market
Customer segmentation in the Parenteral Nutrition Products Market is multifaceted, primarily categorized by care setting, therapeutic indication, and age group, each exhibiting distinct purchasing criteria and buying behaviors. The primary end-user segments include hospitals (acute and chronic care facilities), home care providers, and, to a lesser extent, specialized clinics.
Hospital/Clinical PN settings represent the largest procurement channel. Hospitals prioritize product efficacy, patient safety (e.g., reduced infection risk from Ready-to-Use PN Bags Market), ease of administration for nursing staff, and cost-effectiveness through bulk purchasing and long-term contracts. Procurement decisions are often driven by formulary committees, considering clinical evidence, total cost of ownership, and vendor reputation. Price sensitivity in this segment is moderate but critical, as PN expenses contribute significantly to overall hospital budgets. The adoption of new products is heavily influenced by clinical trial data and peer recommendations.
Home Parenteral Nutrition, a rapidly growing segment, focuses heavily on product convenience, user-friendliness for patients and caregivers, and the availability of comprehensive support services. For instance, the demand for user-friendly devices in the Infusion Therapy Market for home use is a key driver. Key purchasing criteria include product stability, simple storage requirements, easy-to-understand administration protocols, and robust patient education and monitoring programs. Price sensitivity for home care can be high, often linked to insurance coverage and out-of-pocket expenses. Patients and caregivers in the Home Healthcare Market often prefer multi-chamber bags for their simplicity, which minimizes the risk of preparation errors.
From a therapeutic indication perspective, patients with Short Bowel Syndrome, Cancer-Related Malnutrition, and Gastrointestinal Disorders constitute significant user groups. For these segments, specific nutrient profiles (e.g., specialized Amino Acids Market, Lipids Emulsion Market) and formulations tailored to disease-specific metabolic needs are crucial. Pediatric and Neonatal patients form a highly sensitive segment, demanding highly specialized, precisely dosed, and safe formulations, where product safety and efficacy outweigh price considerations. Shifts in buyer preference are increasingly leaning towards personalized nutrition, technologically advanced delivery systems that integrate with digital health platforms, and products that offer enhanced safety features to minimize complications, reflecting a broader trend towards value-based care within the Parenteral Nutrition Products Market.
Parenteral Nutrition Products Segmentation
-
1. Product Type
- 1.1. Ready-to-Use (RTU) PN Bags
- 1.2. Compounded Parenteral Nutrition (PN)
-
2. Care Setting
- 2.1. Hospital/Clinical PN
- 2.2. Home Parenteral Nutrition
-
3. Nutrient Type
-
3.1. Macronutrients
- 3.1.1. Amino Acids
- 3.1.2. Lipids
- 3.1.3. Carbohydrates
-
3.2. Micronutrients
- 3.2.1. Vitamins
- 3.2.2. Trace Elements
- 3.2.3. Electrolytes
-
3.1. Macronutrients
-
4. Therapeutic Indication
- 4.1. Short Bowel Syndrome
- 4.2. Cancer-Related Malnutrition
- 4.3. Gastrointestinal Disorders
- 4.4. Crohn's Disease
- 4.5. Intestinal Failure
- 4.6. Others
-
5. Age Group
- 5.1. Adult
- 5.2. Pediatric
- 5.3. Neonatal
Parenteral Nutrition Products Segmentation By Geography
-
1. North America
- 1.1. United States
- 1.2. Canada
- 1.3. Mexico
-
2. South America
- 2.1. Brazil
- 2.2. Argentina
- 2.3. Rest of South America
-
3. Europe
- 3.1. United Kingdom
- 3.2. Germany
- 3.3. France
- 3.4. Italy
- 3.5. Spain
- 3.6. Russia
- 3.7. Benelux
- 3.8. Nordics
- 3.9. Rest of Europe
-
4. Middle East & Africa
- 4.1. Turkey
- 4.2. Israel
- 4.3. GCC
- 4.4. North Africa
- 4.5. South Africa
- 4.6. Rest of Middle East & Africa
-
5. Asia Pacific
- 5.1. China
- 5.2. India
- 5.3. Japan
- 5.4. South Korea
- 5.5. ASEAN
- 5.6. Oceania
- 5.7. Rest of Asia Pacific
Parenteral Nutrition Products Regional Market Share
Geographic Coverage of Parenteral Nutrition Products
Parenteral Nutrition Products REPORT HIGHLIGHTS
| Aspects | Details |
|---|---|
| Study Period | 2020-2034 |
| Base Year | 2025 |
| Estimated Year | 2026 |
| Forecast Period | 2026-2034 |
| Historical Period | 2020-2025 |
| Growth Rate | CAGR of 5.9% from 2020-2034 |
| Segmentation |
|
Table of Contents
- 1. Introduction
- 1.1. Research Scope
- 1.2. Market Segmentation
- 1.3. Research Objective
- 1.4. Definitions and Assumptions
- 2. Executive Summary
- 2.1. Market Snapshot
- 3. Market Dynamics
- 3.1. Market Drivers
- 3.2. Market Restrains
- 3.3. Market Trends
- 3.4. Market Opportunities
- 4. Market Factor Analysis
- 4.1. Porters Five Forces
- 4.1.1. Bargaining Power of Suppliers
- 4.1.2. Bargaining Power of Buyers
- 4.1.3. Threat of New Entrants
- 4.1.4. Threat of Substitutes
- 4.1.5. Competitive Rivalry
- 4.2. PESTEL analysis
- 4.3. BCG Analysis
- 4.3.1. Stars (High Growth, High Market Share)
- 4.3.2. Cash Cows (Low Growth, High Market Share)
- 4.3.3. Question Mark (High Growth, Low Market Share)
- 4.3.4. Dogs (Low Growth, Low Market Share)
- 4.4. Ansoff Matrix Analysis
- 4.5. Supply Chain Analysis
- 4.6. Regulatory Landscape
- 4.7. Current Market Potential and Opportunity Assessment (TAM–SAM–SOM Framework)
- 4.8. MDP Analyst Note
- 4.1. Porters Five Forces
- 5. Market Analysis, Insights and Forecast 2021-2033
- 5.1. Market Analysis, Insights and Forecast - by Product Type
- 5.1.1. Ready-to-Use (RTU) PN Bags
- 5.1.2. Compounded Parenteral Nutrition (PN)
- 5.2. Market Analysis, Insights and Forecast - by Care Setting
- 5.2.1. Hospital/Clinical PN
- 5.2.2. Home Parenteral Nutrition
- 5.3. Market Analysis, Insights and Forecast - by Nutrient Type
- 5.3.1. Macronutrients
- 5.3.1.1. Amino Acids
- 5.3.1.2. Lipids
- 5.3.1.3. Carbohydrates
- 5.3.2. Micronutrients
- 5.3.2.1. Vitamins
- 5.3.2.2. Trace Elements
- 5.3.2.3. Electrolytes
- 5.3.1. Macronutrients
- 5.4. Market Analysis, Insights and Forecast - by Therapeutic Indication
- 5.4.1. Short Bowel Syndrome
- 5.4.2. Cancer-Related Malnutrition
- 5.4.3. Gastrointestinal Disorders
- 5.4.4. Crohn's Disease
- 5.4.5. Intestinal Failure
- 5.4.6. Others
- 5.5. Market Analysis, Insights and Forecast - by Age Group
- 5.5.1. Adult
- 5.5.2. Pediatric
- 5.5.3. Neonatal
- 5.6. Market Analysis, Insights and Forecast - by Region
- 5.6.1. North America
- 5.6.2. South America
- 5.6.3. Europe
- 5.6.4. Middle East & Africa
- 5.6.5. Asia Pacific
- 5.1. Market Analysis, Insights and Forecast - by Product Type
- 6. Global Parenteral Nutrition Products Analysis, Insights and Forecast, 2021-2033
- 6.1. Market Analysis, Insights and Forecast - by Product Type
- 6.1.1. Ready-to-Use (RTU) PN Bags
- 6.1.2. Compounded Parenteral Nutrition (PN)
- 6.2. Market Analysis, Insights and Forecast - by Care Setting
- 6.2.1. Hospital/Clinical PN
- 6.2.2. Home Parenteral Nutrition
- 6.3. Market Analysis, Insights and Forecast - by Nutrient Type
- 6.3.1. Macronutrients
- 6.3.1.1. Amino Acids
- 6.3.1.2. Lipids
- 6.3.1.3. Carbohydrates
- 6.3.2. Micronutrients
- 6.3.2.1. Vitamins
- 6.3.2.2. Trace Elements
- 6.3.2.3. Electrolytes
- 6.3.1. Macronutrients
- 6.4. Market Analysis, Insights and Forecast - by Therapeutic Indication
- 6.4.1. Short Bowel Syndrome
- 6.4.2. Cancer-Related Malnutrition
- 6.4.3. Gastrointestinal Disorders
- 6.4.4. Crohn's Disease
- 6.4.5. Intestinal Failure
- 6.4.6. Others
- 6.5. Market Analysis, Insights and Forecast - by Age Group
- 6.5.1. Adult
- 6.5.2. Pediatric
- 6.5.3. Neonatal
- 6.1. Market Analysis, Insights and Forecast - by Product Type
- 7. North America Parenteral Nutrition Products Analysis, Insights and Forecast, 2020-2032
- 7.1. Market Analysis, Insights and Forecast - by Product Type
- 7.1.1. Ready-to-Use (RTU) PN Bags
- 7.1.2. Compounded Parenteral Nutrition (PN)
- 7.2. Market Analysis, Insights and Forecast - by Care Setting
- 7.2.1. Hospital/Clinical PN
- 7.2.2. Home Parenteral Nutrition
- 7.3. Market Analysis, Insights and Forecast - by Nutrient Type
- 7.3.1. Macronutrients
- 7.3.1.1. Amino Acids
- 7.3.1.2. Lipids
- 7.3.1.3. Carbohydrates
- 7.3.2. Micronutrients
- 7.3.2.1. Vitamins
- 7.3.2.2. Trace Elements
- 7.3.2.3. Electrolytes
- 7.3.1. Macronutrients
- 7.4. Market Analysis, Insights and Forecast - by Therapeutic Indication
- 7.4.1. Short Bowel Syndrome
- 7.4.2. Cancer-Related Malnutrition
- 7.4.3. Gastrointestinal Disorders
- 7.4.4. Crohn's Disease
- 7.4.5. Intestinal Failure
- 7.4.6. Others
- 7.5. Market Analysis, Insights and Forecast - by Age Group
- 7.5.1. Adult
- 7.5.2. Pediatric
- 7.5.3. Neonatal
- 7.1. Market Analysis, Insights and Forecast - by Product Type
- 8. South America Parenteral Nutrition Products Analysis, Insights and Forecast, 2020-2032
- 8.1. Market Analysis, Insights and Forecast - by Product Type
- 8.1.1. Ready-to-Use (RTU) PN Bags
- 8.1.2. Compounded Parenteral Nutrition (PN)
- 8.2. Market Analysis, Insights and Forecast - by Care Setting
- 8.2.1. Hospital/Clinical PN
- 8.2.2. Home Parenteral Nutrition
- 8.3. Market Analysis, Insights and Forecast - by Nutrient Type
- 8.3.1. Macronutrients
- 8.3.1.1. Amino Acids
- 8.3.1.2. Lipids
- 8.3.1.3. Carbohydrates
- 8.3.2. Micronutrients
- 8.3.2.1. Vitamins
- 8.3.2.2. Trace Elements
- 8.3.2.3. Electrolytes
- 8.3.1. Macronutrients
- 8.4. Market Analysis, Insights and Forecast - by Therapeutic Indication
- 8.4.1. Short Bowel Syndrome
- 8.4.2. Cancer-Related Malnutrition
- 8.4.3. Gastrointestinal Disorders
- 8.4.4. Crohn's Disease
- 8.4.5. Intestinal Failure
- 8.4.6. Others
- 8.5. Market Analysis, Insights and Forecast - by Age Group
- 8.5.1. Adult
- 8.5.2. Pediatric
- 8.5.3. Neonatal
- 8.1. Market Analysis, Insights and Forecast - by Product Type
- 9. Europe Parenteral Nutrition Products Analysis, Insights and Forecast, 2020-2032
- 9.1. Market Analysis, Insights and Forecast - by Product Type
- 9.1.1. Ready-to-Use (RTU) PN Bags
- 9.1.2. Compounded Parenteral Nutrition (PN)
- 9.2. Market Analysis, Insights and Forecast - by Care Setting
- 9.2.1. Hospital/Clinical PN
- 9.2.2. Home Parenteral Nutrition
- 9.3. Market Analysis, Insights and Forecast - by Nutrient Type
- 9.3.1. Macronutrients
- 9.3.1.1. Amino Acids
- 9.3.1.2. Lipids
- 9.3.1.3. Carbohydrates
- 9.3.2. Micronutrients
- 9.3.2.1. Vitamins
- 9.3.2.2. Trace Elements
- 9.3.2.3. Electrolytes
- 9.3.1. Macronutrients
- 9.4. Market Analysis, Insights and Forecast - by Therapeutic Indication
- 9.4.1. Short Bowel Syndrome
- 9.4.2. Cancer-Related Malnutrition
- 9.4.3. Gastrointestinal Disorders
- 9.4.4. Crohn's Disease
- 9.4.5. Intestinal Failure
- 9.4.6. Others
- 9.5. Market Analysis, Insights and Forecast - by Age Group
- 9.5.1. Adult
- 9.5.2. Pediatric
- 9.5.3. Neonatal
- 9.1. Market Analysis, Insights and Forecast - by Product Type
- 10. Middle East & Africa Parenteral Nutrition Products Analysis, Insights and Forecast, 2020-2032
- 10.1. Market Analysis, Insights and Forecast - by Product Type
- 10.1.1. Ready-to-Use (RTU) PN Bags
- 10.1.2. Compounded Parenteral Nutrition (PN)
- 10.2. Market Analysis, Insights and Forecast - by Care Setting
- 10.2.1. Hospital/Clinical PN
- 10.2.2. Home Parenteral Nutrition
- 10.3. Market Analysis, Insights and Forecast - by Nutrient Type
- 10.3.1. Macronutrients
- 10.3.1.1. Amino Acids
- 10.3.1.2. Lipids
- 10.3.1.3. Carbohydrates
- 10.3.2. Micronutrients
- 10.3.2.1. Vitamins
- 10.3.2.2. Trace Elements
- 10.3.2.3. Electrolytes
- 10.3.1. Macronutrients
- 10.4. Market Analysis, Insights and Forecast - by Therapeutic Indication
- 10.4.1. Short Bowel Syndrome
- 10.4.2. Cancer-Related Malnutrition
- 10.4.3. Gastrointestinal Disorders
- 10.4.4. Crohn's Disease
- 10.4.5. Intestinal Failure
- 10.4.6. Others
- 10.5. Market Analysis, Insights and Forecast - by Age Group
- 10.5.1. Adult
- 10.5.2. Pediatric
- 10.5.3. Neonatal
- 10.1. Market Analysis, Insights and Forecast - by Product Type
- 11. Asia Pacific Parenteral Nutrition Products Analysis, Insights and Forecast, 2020-2032
- 11.1. Market Analysis, Insights and Forecast - by Product Type
- 11.1.1. Ready-to-Use (RTU) PN Bags
- 11.1.2. Compounded Parenteral Nutrition (PN)
- 11.2. Market Analysis, Insights and Forecast - by Care Setting
- 11.2.1. Hospital/Clinical PN
- 11.2.2. Home Parenteral Nutrition
- 11.3. Market Analysis, Insights and Forecast - by Nutrient Type
- 11.3.1. Macronutrients
- 11.3.1.1. Amino Acids
- 11.3.1.2. Lipids
- 11.3.1.3. Carbohydrates
- 11.3.2. Micronutrients
- 11.3.2.1. Vitamins
- 11.3.2.2. Trace Elements
- 11.3.2.3. Electrolytes
- 11.3.1. Macronutrients
- 11.4. Market Analysis, Insights and Forecast - by Therapeutic Indication
- 11.4.1. Short Bowel Syndrome
- 11.4.2. Cancer-Related Malnutrition
- 11.4.3. Gastrointestinal Disorders
- 11.4.4. Crohn's Disease
- 11.4.5. Intestinal Failure
- 11.4.6. Others
- 11.5. Market Analysis, Insights and Forecast - by Age Group
- 11.5.1. Adult
- 11.5.2. Pediatric
- 11.5.3. Neonatal
- 11.1. Market Analysis, Insights and Forecast - by Product Type
- 12. Competitive Analysis
- 12.1. Company Profiles
- 12.1.1 Baxter International
- 12.1.1.1. Company Overview
- 12.1.1.2. Products
- 12.1.1.3. Company Financials
- 12.1.1.4. SWOT Analysis
- 12.1.2 Pfizer
- 12.1.2.1. Company Overview
- 12.1.2.2. Products
- 12.1.2.3. Company Financials
- 12.1.2.4. SWOT Analysis
- 12.1.3 B. Braun Melsungen
- 12.1.3.1. Company Overview
- 12.1.3.2. Products
- 12.1.3.3. Company Financials
- 12.1.3.4. SWOT Analysis
- 12.1.4 Grifols International
- 12.1.4.1. Company Overview
- 12.1.4.2. Products
- 12.1.4.3. Company Financials
- 12.1.4.4. SWOT Analysis
- 12.1.5 Fresenius Kabi
- 12.1.5.1. Company Overview
- 12.1.5.2. Products
- 12.1.5.3. Company Financials
- 12.1.5.4. SWOT Analysis
- 12.1.6 Otsuka Pharmaceutical
- 12.1.6.1. Company Overview
- 12.1.6.2. Products
- 12.1.6.3. Company Financials
- 12.1.6.4. SWOT Analysis
- 12.1.7 Teva Pharmaceutical
- 12.1.7.1. Company Overview
- 12.1.7.2. Products
- 12.1.7.3. Company Financials
- 12.1.7.4. SWOT Analysis
- 12.1.8 Sichuan Kelun Pharmaceutical
- 12.1.8.1. Company Overview
- 12.1.8.2. Products
- 12.1.8.3. Company Financials
- 12.1.8.4. SWOT Analysis
- 12.1.1 Baxter International
- 12.2. Market Entropy
- 12.2.1 Company's Key Areas Served
- 12.2.2 Recent Developments
- 12.3. Company Market Share Analysis 2025
- 12.3.1 Top 5 Companies Market Share Analysis
- 12.3.2 Top 3 Companies Market Share Analysis
- 12.4. List of Potential Customers
- 13. Research Methodology
List of Figures
- Figure 1: Global Parenteral Nutrition Products Revenue Breakdown (billion, %) by Region 2025 & 2033
- Figure 2: Global Parenteral Nutrition Products Volume Breakdown (K, %) by Region 2025 & 2033
- Figure 3: North America Parenteral Nutrition Products Revenue (billion), by Product Type 2025 & 2033
- Figure 4: North America Parenteral Nutrition Products Volume (K), by Product Type 2025 & 2033
- Figure 5: North America Parenteral Nutrition Products Revenue Share (%), by Product Type 2025 & 2033
- Figure 6: North America Parenteral Nutrition Products Volume Share (%), by Product Type 2025 & 2033
- Figure 7: North America Parenteral Nutrition Products Revenue (billion), by Care Setting 2025 & 2033
- Figure 8: North America Parenteral Nutrition Products Volume (K), by Care Setting 2025 & 2033
- Figure 9: North America Parenteral Nutrition Products Revenue Share (%), by Care Setting 2025 & 2033
- Figure 10: North America Parenteral Nutrition Products Volume Share (%), by Care Setting 2025 & 2033
- Figure 11: North America Parenteral Nutrition Products Revenue (billion), by Nutrient Type 2025 & 2033
- Figure 12: North America Parenteral Nutrition Products Volume (K), by Nutrient Type 2025 & 2033
- Figure 13: North America Parenteral Nutrition Products Revenue Share (%), by Nutrient Type 2025 & 2033
- Figure 14: North America Parenteral Nutrition Products Volume Share (%), by Nutrient Type 2025 & 2033
- Figure 15: North America Parenteral Nutrition Products Revenue (billion), by Therapeutic Indication 2025 & 2033
- Figure 16: North America Parenteral Nutrition Products Volume (K), by Therapeutic Indication 2025 & 2033
- Figure 17: North America Parenteral Nutrition Products Revenue Share (%), by Therapeutic Indication 2025 & 2033
- Figure 18: North America Parenteral Nutrition Products Volume Share (%), by Therapeutic Indication 2025 & 2033
- Figure 19: North America Parenteral Nutrition Products Revenue (billion), by Age Group 2025 & 2033
- Figure 20: North America Parenteral Nutrition Products Volume (K), by Age Group 2025 & 2033
- Figure 21: North America Parenteral Nutrition Products Revenue Share (%), by Age Group 2025 & 2033
- Figure 22: North America Parenteral Nutrition Products Volume Share (%), by Age Group 2025 & 2033
- Figure 23: North America Parenteral Nutrition Products Revenue (billion), by Country 2025 & 2033
- Figure 24: North America Parenteral Nutrition Products Volume (K), by Country 2025 & 2033
- Figure 25: North America Parenteral Nutrition Products Revenue Share (%), by Country 2025 & 2033
- Figure 26: North America Parenteral Nutrition Products Volume Share (%), by Country 2025 & 2033
- Figure 27: South America Parenteral Nutrition Products Revenue (billion), by Product Type 2025 & 2033
- Figure 28: South America Parenteral Nutrition Products Volume (K), by Product Type 2025 & 2033
- Figure 29: South America Parenteral Nutrition Products Revenue Share (%), by Product Type 2025 & 2033
- Figure 30: South America Parenteral Nutrition Products Volume Share (%), by Product Type 2025 & 2033
- Figure 31: South America Parenteral Nutrition Products Revenue (billion), by Care Setting 2025 & 2033
- Figure 32: South America Parenteral Nutrition Products Volume (K), by Care Setting 2025 & 2033
- Figure 33: South America Parenteral Nutrition Products Revenue Share (%), by Care Setting 2025 & 2033
- Figure 34: South America Parenteral Nutrition Products Volume Share (%), by Care Setting 2025 & 2033
- Figure 35: South America Parenteral Nutrition Products Revenue (billion), by Nutrient Type 2025 & 2033
- Figure 36: South America Parenteral Nutrition Products Volume (K), by Nutrient Type 2025 & 2033
- Figure 37: South America Parenteral Nutrition Products Revenue Share (%), by Nutrient Type 2025 & 2033
- Figure 38: South America Parenteral Nutrition Products Volume Share (%), by Nutrient Type 2025 & 2033
- Figure 39: South America Parenteral Nutrition Products Revenue (billion), by Therapeutic Indication 2025 & 2033
- Figure 40: South America Parenteral Nutrition Products Volume (K), by Therapeutic Indication 2025 & 2033
- Figure 41: South America Parenteral Nutrition Products Revenue Share (%), by Therapeutic Indication 2025 & 2033
- Figure 42: South America Parenteral Nutrition Products Volume Share (%), by Therapeutic Indication 2025 & 2033
- Figure 43: South America Parenteral Nutrition Products Revenue (billion), by Age Group 2025 & 2033
- Figure 44: South America Parenteral Nutrition Products Volume (K), by Age Group 2025 & 2033
- Figure 45: South America Parenteral Nutrition Products Revenue Share (%), by Age Group 2025 & 2033
- Figure 46: South America Parenteral Nutrition Products Volume Share (%), by Age Group 2025 & 2033
- Figure 47: South America Parenteral Nutrition Products Revenue (billion), by Country 2025 & 2033
- Figure 48: South America Parenteral Nutrition Products Volume (K), by Country 2025 & 2033
- Figure 49: South America Parenteral Nutrition Products Revenue Share (%), by Country 2025 & 2033
- Figure 50: South America Parenteral Nutrition Products Volume Share (%), by Country 2025 & 2033
- Figure 51: Europe Parenteral Nutrition Products Revenue (billion), by Product Type 2025 & 2033
- Figure 52: Europe Parenteral Nutrition Products Volume (K), by Product Type 2025 & 2033
- Figure 53: Europe Parenteral Nutrition Products Revenue Share (%), by Product Type 2025 & 2033
- Figure 54: Europe Parenteral Nutrition Products Volume Share (%), by Product Type 2025 & 2033
- Figure 55: Europe Parenteral Nutrition Products Revenue (billion), by Care Setting 2025 & 2033
- Figure 56: Europe Parenteral Nutrition Products Volume (K), by Care Setting 2025 & 2033
- Figure 57: Europe Parenteral Nutrition Products Revenue Share (%), by Care Setting 2025 & 2033
- Figure 58: Europe Parenteral Nutrition Products Volume Share (%), by Care Setting 2025 & 2033
- Figure 59: Europe Parenteral Nutrition Products Revenue (billion), by Nutrient Type 2025 & 2033
- Figure 60: Europe Parenteral Nutrition Products Volume (K), by Nutrient Type 2025 & 2033
- Figure 61: Europe Parenteral Nutrition Products Revenue Share (%), by Nutrient Type 2025 & 2033
- Figure 62: Europe Parenteral Nutrition Products Volume Share (%), by Nutrient Type 2025 & 2033
- Figure 63: Europe Parenteral Nutrition Products Revenue (billion), by Therapeutic Indication 2025 & 2033
- Figure 64: Europe Parenteral Nutrition Products Volume (K), by Therapeutic Indication 2025 & 2033
- Figure 65: Europe Parenteral Nutrition Products Revenue Share (%), by Therapeutic Indication 2025 & 2033
- Figure 66: Europe Parenteral Nutrition Products Volume Share (%), by Therapeutic Indication 2025 & 2033
- Figure 67: Europe Parenteral Nutrition Products Revenue (billion), by Age Group 2025 & 2033
- Figure 68: Europe Parenteral Nutrition Products Volume (K), by Age Group 2025 & 2033
- Figure 69: Europe Parenteral Nutrition Products Revenue Share (%), by Age Group 2025 & 2033
- Figure 70: Europe Parenteral Nutrition Products Volume Share (%), by Age Group 2025 & 2033
- Figure 71: Europe Parenteral Nutrition Products Revenue (billion), by Country 2025 & 2033
- Figure 72: Europe Parenteral Nutrition Products Volume (K), by Country 2025 & 2033
- Figure 73: Europe Parenteral Nutrition Products Revenue Share (%), by Country 2025 & 2033
- Figure 74: Europe Parenteral Nutrition Products Volume Share (%), by Country 2025 & 2033
- Figure 75: Middle East & Africa Parenteral Nutrition Products Revenue (billion), by Product Type 2025 & 2033
- Figure 76: Middle East & Africa Parenteral Nutrition Products Volume (K), by Product Type 2025 & 2033
- Figure 77: Middle East & Africa Parenteral Nutrition Products Revenue Share (%), by Product Type 2025 & 2033
- Figure 78: Middle East & Africa Parenteral Nutrition Products Volume Share (%), by Product Type 2025 & 2033
- Figure 79: Middle East & Africa Parenteral Nutrition Products Revenue (billion), by Care Setting 2025 & 2033
- Figure 80: Middle East & Africa Parenteral Nutrition Products Volume (K), by Care Setting 2025 & 2033
- Figure 81: Middle East & Africa Parenteral Nutrition Products Revenue Share (%), by Care Setting 2025 & 2033
- Figure 82: Middle East & Africa Parenteral Nutrition Products Volume Share (%), by Care Setting 2025 & 2033
- Figure 83: Middle East & Africa Parenteral Nutrition Products Revenue (billion), by Nutrient Type 2025 & 2033
- Figure 84: Middle East & Africa Parenteral Nutrition Products Volume (K), by Nutrient Type 2025 & 2033
- Figure 85: Middle East & Africa Parenteral Nutrition Products Revenue Share (%), by Nutrient Type 2025 & 2033
- Figure 86: Middle East & Africa Parenteral Nutrition Products Volume Share (%), by Nutrient Type 2025 & 2033
- Figure 87: Middle East & Africa Parenteral Nutrition Products Revenue (billion), by Therapeutic Indication 2025 & 2033
- Figure 88: Middle East & Africa Parenteral Nutrition Products Volume (K), by Therapeutic Indication 2025 & 2033
- Figure 89: Middle East & Africa Parenteral Nutrition Products Revenue Share (%), by Therapeutic Indication 2025 & 2033
- Figure 90: Middle East & Africa Parenteral Nutrition Products Volume Share (%), by Therapeutic Indication 2025 & 2033
- Figure 91: Middle East & Africa Parenteral Nutrition Products Revenue (billion), by Age Group 2025 & 2033
- Figure 92: Middle East & Africa Parenteral Nutrition Products Volume (K), by Age Group 2025 & 2033
- Figure 93: Middle East & Africa Parenteral Nutrition Products Revenue Share (%), by Age Group 2025 & 2033
- Figure 94: Middle East & Africa Parenteral Nutrition Products Volume Share (%), by Age Group 2025 & 2033
- Figure 95: Middle East & Africa Parenteral Nutrition Products Revenue (billion), by Country 2025 & 2033
- Figure 96: Middle East & Africa Parenteral Nutrition Products Volume (K), by Country 2025 & 2033
- Figure 97: Middle East & Africa Parenteral Nutrition Products Revenue Share (%), by Country 2025 & 2033
- Figure 98: Middle East & Africa Parenteral Nutrition Products Volume Share (%), by Country 2025 & 2033
- Figure 99: Asia Pacific Parenteral Nutrition Products Revenue (billion), by Product Type 2025 & 2033
- Figure 100: Asia Pacific Parenteral Nutrition Products Volume (K), by Product Type 2025 & 2033
- Figure 101: Asia Pacific Parenteral Nutrition Products Revenue Share (%), by Product Type 2025 & 2033
- Figure 102: Asia Pacific Parenteral Nutrition Products Volume Share (%), by Product Type 2025 & 2033
- Figure 103: Asia Pacific Parenteral Nutrition Products Revenue (billion), by Care Setting 2025 & 2033
- Figure 104: Asia Pacific Parenteral Nutrition Products Volume (K), by Care Setting 2025 & 2033
- Figure 105: Asia Pacific Parenteral Nutrition Products Revenue Share (%), by Care Setting 2025 & 2033
- Figure 106: Asia Pacific Parenteral Nutrition Products Volume Share (%), by Care Setting 2025 & 2033
- Figure 107: Asia Pacific Parenteral Nutrition Products Revenue (billion), by Nutrient Type 2025 & 2033
- Figure 108: Asia Pacific Parenteral Nutrition Products Volume (K), by Nutrient Type 2025 & 2033
- Figure 109: Asia Pacific Parenteral Nutrition Products Revenue Share (%), by Nutrient Type 2025 & 2033
- Figure 110: Asia Pacific Parenteral Nutrition Products Volume Share (%), by Nutrient Type 2025 & 2033
- Figure 111: Asia Pacific Parenteral Nutrition Products Revenue (billion), by Therapeutic Indication 2025 & 2033
- Figure 112: Asia Pacific Parenteral Nutrition Products Volume (K), by Therapeutic Indication 2025 & 2033
- Figure 113: Asia Pacific Parenteral Nutrition Products Revenue Share (%), by Therapeutic Indication 2025 & 2033
- Figure 114: Asia Pacific Parenteral Nutrition Products Volume Share (%), by Therapeutic Indication 2025 & 2033
- Figure 115: Asia Pacific Parenteral Nutrition Products Revenue (billion), by Age Group 2025 & 2033
- Figure 116: Asia Pacific Parenteral Nutrition Products Volume (K), by Age Group 2025 & 2033
- Figure 117: Asia Pacific Parenteral Nutrition Products Revenue Share (%), by Age Group 2025 & 2033
- Figure 118: Asia Pacific Parenteral Nutrition Products Volume Share (%), by Age Group 2025 & 2033
- Figure 119: Asia Pacific Parenteral Nutrition Products Revenue (billion), by Country 2025 & 2033
- Figure 120: Asia Pacific Parenteral Nutrition Products Volume (K), by Country 2025 & 2033
- Figure 121: Asia Pacific Parenteral Nutrition Products Revenue Share (%), by Country 2025 & 2033
- Figure 122: Asia Pacific Parenteral Nutrition Products Volume Share (%), by Country 2025 & 2033
List of Tables
- Table 1: Global Parenteral Nutrition Products Revenue billion Forecast, by Product Type 2020 & 2033
- Table 2: Global Parenteral Nutrition Products Volume K Forecast, by Product Type 2020 & 2033
- Table 3: Global Parenteral Nutrition Products Revenue billion Forecast, by Care Setting 2020 & 2033
- Table 4: Global Parenteral Nutrition Products Volume K Forecast, by Care Setting 2020 & 2033
- Table 5: Global Parenteral Nutrition Products Revenue billion Forecast, by Nutrient Type 2020 & 2033
- Table 6: Global Parenteral Nutrition Products Volume K Forecast, by Nutrient Type 2020 & 2033
- Table 7: Global Parenteral Nutrition Products Revenue billion Forecast, by Therapeutic Indication 2020 & 2033
- Table 8: Global Parenteral Nutrition Products Volume K Forecast, by Therapeutic Indication 2020 & 2033
- Table 9: Global Parenteral Nutrition Products Revenue billion Forecast, by Age Group 2020 & 2033
- Table 10: Global Parenteral Nutrition Products Volume K Forecast, by Age Group 2020 & 2033
- Table 11: Global Parenteral Nutrition Products Revenue billion Forecast, by Region 2020 & 2033
- Table 12: Global Parenteral Nutrition Products Volume K Forecast, by Region 2020 & 2033
- Table 13: Global Parenteral Nutrition Products Revenue billion Forecast, by Product Type 2020 & 2033
- Table 14: Global Parenteral Nutrition Products Volume K Forecast, by Product Type 2020 & 2033
- Table 15: Global Parenteral Nutrition Products Revenue billion Forecast, by Care Setting 2020 & 2033
- Table 16: Global Parenteral Nutrition Products Volume K Forecast, by Care Setting 2020 & 2033
- Table 17: Global Parenteral Nutrition Products Revenue billion Forecast, by Nutrient Type 2020 & 2033
- Table 18: Global Parenteral Nutrition Products Volume K Forecast, by Nutrient Type 2020 & 2033
- Table 19: Global Parenteral Nutrition Products Revenue billion Forecast, by Therapeutic Indication 2020 & 2033
- Table 20: Global Parenteral Nutrition Products Volume K Forecast, by Therapeutic Indication 2020 & 2033
- Table 21: Global Parenteral Nutrition Products Revenue billion Forecast, by Age Group 2020 & 2033
- Table 22: Global Parenteral Nutrition Products Volume K Forecast, by Age Group 2020 & 2033
- Table 23: Global Parenteral Nutrition Products Revenue billion Forecast, by Country 2020 & 2033
- Table 24: Global Parenteral Nutrition Products Volume K Forecast, by Country 2020 & 2033
- Table 25: United States Parenteral Nutrition Products Revenue (billion) Forecast, by Application 2020 & 2033
- Table 26: United States Parenteral Nutrition Products Volume (K) Forecast, by Application 2020 & 2033
- Table 27: Canada Parenteral Nutrition Products Revenue (billion) Forecast, by Application 2020 & 2033
- Table 28: Canada Parenteral Nutrition Products Volume (K) Forecast, by Application 2020 & 2033
- Table 29: Mexico Parenteral Nutrition Products Revenue (billion) Forecast, by Application 2020 & 2033
- Table 30: Mexico Parenteral Nutrition Products Volume (K) Forecast, by Application 2020 & 2033
- Table 31: Global Parenteral Nutrition Products Revenue billion Forecast, by Product Type 2020 & 2033
- Table 32: Global Parenteral Nutrition Products Volume K Forecast, by Product Type 2020 & 2033
- Table 33: Global Parenteral Nutrition Products Revenue billion Forecast, by Care Setting 2020 & 2033
- Table 34: Global Parenteral Nutrition Products Volume K Forecast, by Care Setting 2020 & 2033
- Table 35: Global Parenteral Nutrition Products Revenue billion Forecast, by Nutrient Type 2020 & 2033
- Table 36: Global Parenteral Nutrition Products Volume K Forecast, by Nutrient Type 2020 & 2033
- Table 37: Global Parenteral Nutrition Products Revenue billion Forecast, by Therapeutic Indication 2020 & 2033
- Table 38: Global Parenteral Nutrition Products Volume K Forecast, by Therapeutic Indication 2020 & 2033
- Table 39: Global Parenteral Nutrition Products Revenue billion Forecast, by Age Group 2020 & 2033
- Table 40: Global Parenteral Nutrition Products Volume K Forecast, by Age Group 2020 & 2033
- Table 41: Global Parenteral Nutrition Products Revenue billion Forecast, by Country 2020 & 2033
- Table 42: Global Parenteral Nutrition Products Volume K Forecast, by Country 2020 & 2033
- Table 43: Brazil Parenteral Nutrition Products Revenue (billion) Forecast, by Application 2020 & 2033
- Table 44: Brazil Parenteral Nutrition Products Volume (K) Forecast, by Application 2020 & 2033
- Table 45: Argentina Parenteral Nutrition Products Revenue (billion) Forecast, by Application 2020 & 2033
- Table 46: Argentina Parenteral Nutrition Products Volume (K) Forecast, by Application 2020 & 2033
- Table 47: Rest of South America Parenteral Nutrition Products Revenue (billion) Forecast, by Application 2020 & 2033
- Table 48: Rest of South America Parenteral Nutrition Products Volume (K) Forecast, by Application 2020 & 2033
- Table 49: Global Parenteral Nutrition Products Revenue billion Forecast, by Product Type 2020 & 2033
- Table 50: Global Parenteral Nutrition Products Volume K Forecast, by Product Type 2020 & 2033
- Table 51: Global Parenteral Nutrition Products Revenue billion Forecast, by Care Setting 2020 & 2033
- Table 52: Global Parenteral Nutrition Products Volume K Forecast, by Care Setting 2020 & 2033
- Table 53: Global Parenteral Nutrition Products Revenue billion Forecast, by Nutrient Type 2020 & 2033
- Table 54: Global Parenteral Nutrition Products Volume K Forecast, by Nutrient Type 2020 & 2033
- Table 55: Global Parenteral Nutrition Products Revenue billion Forecast, by Therapeutic Indication 2020 & 2033
- Table 56: Global Parenteral Nutrition Products Volume K Forecast, by Therapeutic Indication 2020 & 2033
- Table 57: Global Parenteral Nutrition Products Revenue billion Forecast, by Age Group 2020 & 2033
- Table 58: Global Parenteral Nutrition Products Volume K Forecast, by Age Group 2020 & 2033
- Table 59: Global Parenteral Nutrition Products Revenue billion Forecast, by Country 2020 & 2033
- Table 60: Global Parenteral Nutrition Products Volume K Forecast, by Country 2020 & 2033
- Table 61: United Kingdom Parenteral Nutrition Products Revenue (billion) Forecast, by Application 2020 & 2033
- Table 62: United Kingdom Parenteral Nutrition Products Volume (K) Forecast, by Application 2020 & 2033
- Table 63: Germany Parenteral Nutrition Products Revenue (billion) Forecast, by Application 2020 & 2033
- Table 64: Germany Parenteral Nutrition Products Volume (K) Forecast, by Application 2020 & 2033
- Table 65: France Parenteral Nutrition Products Revenue (billion) Forecast, by Application 2020 & 2033
- Table 66: France Parenteral Nutrition Products Volume (K) Forecast, by Application 2020 & 2033
- Table 67: Italy Parenteral Nutrition Products Revenue (billion) Forecast, by Application 2020 & 2033
- Table 68: Italy Parenteral Nutrition Products Volume (K) Forecast, by Application 2020 & 2033
- Table 69: Spain Parenteral Nutrition Products Revenue (billion) Forecast, by Application 2020 & 2033
- Table 70: Spain Parenteral Nutrition Products Volume (K) Forecast, by Application 2020 & 2033
- Table 71: Russia Parenteral Nutrition Products Revenue (billion) Forecast, by Application 2020 & 2033
- Table 72: Russia Parenteral Nutrition Products Volume (K) Forecast, by Application 2020 & 2033
- Table 73: Benelux Parenteral Nutrition Products Revenue (billion) Forecast, by Application 2020 & 2033
- Table 74: Benelux Parenteral Nutrition Products Volume (K) Forecast, by Application 2020 & 2033
- Table 75: Nordics Parenteral Nutrition Products Revenue (billion) Forecast, by Application 2020 & 2033
- Table 76: Nordics Parenteral Nutrition Products Volume (K) Forecast, by Application 2020 & 2033
- Table 77: Rest of Europe Parenteral Nutrition Products Revenue (billion) Forecast, by Application 2020 & 2033
- Table 78: Rest of Europe Parenteral Nutrition Products Volume (K) Forecast, by Application 2020 & 2033
- Table 79: Global Parenteral Nutrition Products Revenue billion Forecast, by Product Type 2020 & 2033
- Table 80: Global Parenteral Nutrition Products Volume K Forecast, by Product Type 2020 & 2033
- Table 81: Global Parenteral Nutrition Products Revenue billion Forecast, by Care Setting 2020 & 2033
- Table 82: Global Parenteral Nutrition Products Volume K Forecast, by Care Setting 2020 & 2033
- Table 83: Global Parenteral Nutrition Products Revenue billion Forecast, by Nutrient Type 2020 & 2033
- Table 84: Global Parenteral Nutrition Products Volume K Forecast, by Nutrient Type 2020 & 2033
- Table 85: Global Parenteral Nutrition Products Revenue billion Forecast, by Therapeutic Indication 2020 & 2033
- Table 86: Global Parenteral Nutrition Products Volume K Forecast, by Therapeutic Indication 2020 & 2033
- Table 87: Global Parenteral Nutrition Products Revenue billion Forecast, by Age Group 2020 & 2033
- Table 88: Global Parenteral Nutrition Products Volume K Forecast, by Age Group 2020 & 2033
- Table 89: Global Parenteral Nutrition Products Revenue billion Forecast, by Country 2020 & 2033
- Table 90: Global Parenteral Nutrition Products Volume K Forecast, by Country 2020 & 2033
- Table 91: Turkey Parenteral Nutrition Products Revenue (billion) Forecast, by Application 2020 & 2033
- Table 92: Turkey Parenteral Nutrition Products Volume (K) Forecast, by Application 2020 & 2033
- Table 93: Israel Parenteral Nutrition Products Revenue (billion) Forecast, by Application 2020 & 2033
- Table 94: Israel Parenteral Nutrition Products Volume (K) Forecast, by Application 2020 & 2033
- Table 95: GCC Parenteral Nutrition Products Revenue (billion) Forecast, by Application 2020 & 2033
- Table 96: GCC Parenteral Nutrition Products Volume (K) Forecast, by Application 2020 & 2033
- Table 97: North Africa Parenteral Nutrition Products Revenue (billion) Forecast, by Application 2020 & 2033
- Table 98: North Africa Parenteral Nutrition Products Volume (K) Forecast, by Application 2020 & 2033
- Table 99: South Africa Parenteral Nutrition Products Revenue (billion) Forecast, by Application 2020 & 2033
- Table 100: South Africa Parenteral Nutrition Products Volume (K) Forecast, by Application 2020 & 2033
- Table 101: Rest of Middle East & Africa Parenteral Nutrition Products Revenue (billion) Forecast, by Application 2020 & 2033
- Table 102: Rest of Middle East & Africa Parenteral Nutrition Products Volume (K) Forecast, by Application 2020 & 2033
- Table 103: Global Parenteral Nutrition Products Revenue billion Forecast, by Product Type 2020 & 2033
- Table 104: Global Parenteral Nutrition Products Volume K Forecast, by Product Type 2020 & 2033
- Table 105: Global Parenteral Nutrition Products Revenue billion Forecast, by Care Setting 2020 & 2033
- Table 106: Global Parenteral Nutrition Products Volume K Forecast, by Care Setting 2020 & 2033
- Table 107: Global Parenteral Nutrition Products Revenue billion Forecast, by Nutrient Type 2020 & 2033
- Table 108: Global Parenteral Nutrition Products Volume K Forecast, by Nutrient Type 2020 & 2033
- Table 109: Global Parenteral Nutrition Products Revenue billion Forecast, by Therapeutic Indication 2020 & 2033
- Table 110: Global Parenteral Nutrition Products Volume K Forecast, by Therapeutic Indication 2020 & 2033
- Table 111: Global Parenteral Nutrition Products Revenue billion Forecast, by Age Group 2020 & 2033
- Table 112: Global Parenteral Nutrition Products Volume K Forecast, by Age Group 2020 & 2033
- Table 113: Global Parenteral Nutrition Products Revenue billion Forecast, by Country 2020 & 2033
- Table 114: Global Parenteral Nutrition Products Volume K Forecast, by Country 2020 & 2033
- Table 115: China Parenteral Nutrition Products Revenue (billion) Forecast, by Application 2020 & 2033
- Table 116: China Parenteral Nutrition Products Volume (K) Forecast, by Application 2020 & 2033
- Table 117: India Parenteral Nutrition Products Revenue (billion) Forecast, by Application 2020 & 2033
- Table 118: India Parenteral Nutrition Products Volume (K) Forecast, by Application 2020 & 2033
- Table 119: Japan Parenteral Nutrition Products Revenue (billion) Forecast, by Application 2020 & 2033
- Table 120: Japan Parenteral Nutrition Products Volume (K) Forecast, by Application 2020 & 2033
- Table 121: South Korea Parenteral Nutrition Products Revenue (billion) Forecast, by Application 2020 & 2033
- Table 122: South Korea Parenteral Nutrition Products Volume (K) Forecast, by Application 2020 & 2033
- Table 123: ASEAN Parenteral Nutrition Products Revenue (billion) Forecast, by Application 2020 & 2033
- Table 124: ASEAN Parenteral Nutrition Products Volume (K) Forecast, by Application 2020 & 2033
- Table 125: Oceania Parenteral Nutrition Products Revenue (billion) Forecast, by Application 2020 & 2033
- Table 126: Oceania Parenteral Nutrition Products Volume (K) Forecast, by Application 2020 & 2033
- Table 127: Rest of Asia Pacific Parenteral Nutrition Products Revenue (billion) Forecast, by Application 2020 & 2033
- Table 128: Rest of Asia Pacific Parenteral Nutrition Products Volume (K) Forecast, by Application 2020 & 2033
Frequently Asked Questions
1. What is the projected Compound Annual Growth Rate (CAGR) of the Parenteral Nutrition Products?
The projected CAGR is approximately 5.9%.
2. Which companies are prominent players in the Parenteral Nutrition Products?
Key companies in the market include Baxter International, Pfizer, B. Braun Melsungen, Grifols International, Fresenius Kabi, Otsuka Pharmaceutical, Teva Pharmaceutical, Sichuan Kelun Pharmaceutical.
3. What are the main segments of the Parenteral Nutrition Products?
The market segments include Product Type, Care Setting, Nutrient Type, Therapeutic Indication, Age Group.
4. Can you provide details about the market size?
The market size is estimated to be USD 7.94 billion as of 2022.
5. What are some drivers contributing to market growth?
N/A
6. What are the notable trends driving market growth?
N/A
7. Are there any restraints impacting market growth?
N/A
8. Can you provide examples of recent developments in the market?
N/A
9. What pricing options are available for accessing the report?
Pricing options include single-user, multi-user, and enterprise licenses priced at USD 3350.00, USD 5025.00, and USD 6700.00 respectively.
10. Is the market size provided in terms of value or volume?
The market size is provided in terms of value, measured in billion and volume, measured in K.
11. Are there any specific market keywords associated with the report?
Yes, the market keyword associated with the report is "Parenteral Nutrition Products," which aids in identifying and referencing the specific market segment covered.
12. How do I determine which pricing option suits my needs best?
The pricing options vary based on user requirements and access needs. Individual users may opt for single-user licenses, while businesses requiring broader access may choose multi-user or enterprise licenses for cost-effective access to the report.
13. Are there any additional resources or data provided in the Parenteral Nutrition Products report?
While the report offers comprehensive insights, it's advisable to review the specific contents or supplementary materials provided to ascertain if additional resources or data are available.
14. How can I stay updated on further developments or reports in the Parenteral Nutrition Products?
To stay informed about further developments, trends, and reports in the Parenteral Nutrition Products, consider subscribing to industry newsletters, following relevant companies and organizations, or regularly checking reputable industry news sources and publications.
Methodology
Step 1 - Identification of Relevant Samples Size from Population Database


Step 2 - Approaches for Defining Global Market Size (Value, Volume* & Price*)

Note*: In applicable scenarios
Step 3 - Data Sources
Primary Research
- Web Analytics
- Survey Reports
- Research Institute
- Latest Research Reports
- Opinion Leaders
Secondary Research
- Annual Reports
- White Paper
- Latest Press Release
- Industry Association
- Paid Database
- Investor Presentations

Step 4 - Data Triangulation
Involves using different sources of information in order to increase the validity of a study
These sources are likely to be stakeholders in a program - participants, other researchers, program staff, other community members, and so on.
Then we put all data in single framework & apply various statistical tools to find out the dynamic on the market.
During the analysis stage, feedback from the stakeholder groups would be compared to determine areas of agreement as well as areas of divergence