

Key Insights
The Outdoor Adventure Tourism market is experiencing robust expansion, projected to reach USD 13,830 million by 2025, driven by a compelling CAGR of 18.6%. This significant growth is fueled by a growing global desire for unique, experiential travel that connects individuals with nature and offers a break from routine. Key drivers include increasing disposable incomes, a heightened awareness of health and wellness benefits associated with outdoor activities, and a generational shift towards prioritizing experiences over material possessions. The market's dynamism is further shaped by evolving consumer preferences, with a growing demand for sustainable and eco-friendly adventure options. This trend is prompting tour operators to focus on responsible tourism practices, minimizing environmental impact while maximizing local community benefits. The proliferation of online travel agencies and social media platforms also plays a crucial role, providing easy access to information, booking capabilities, and inspiration for potential adventurers.
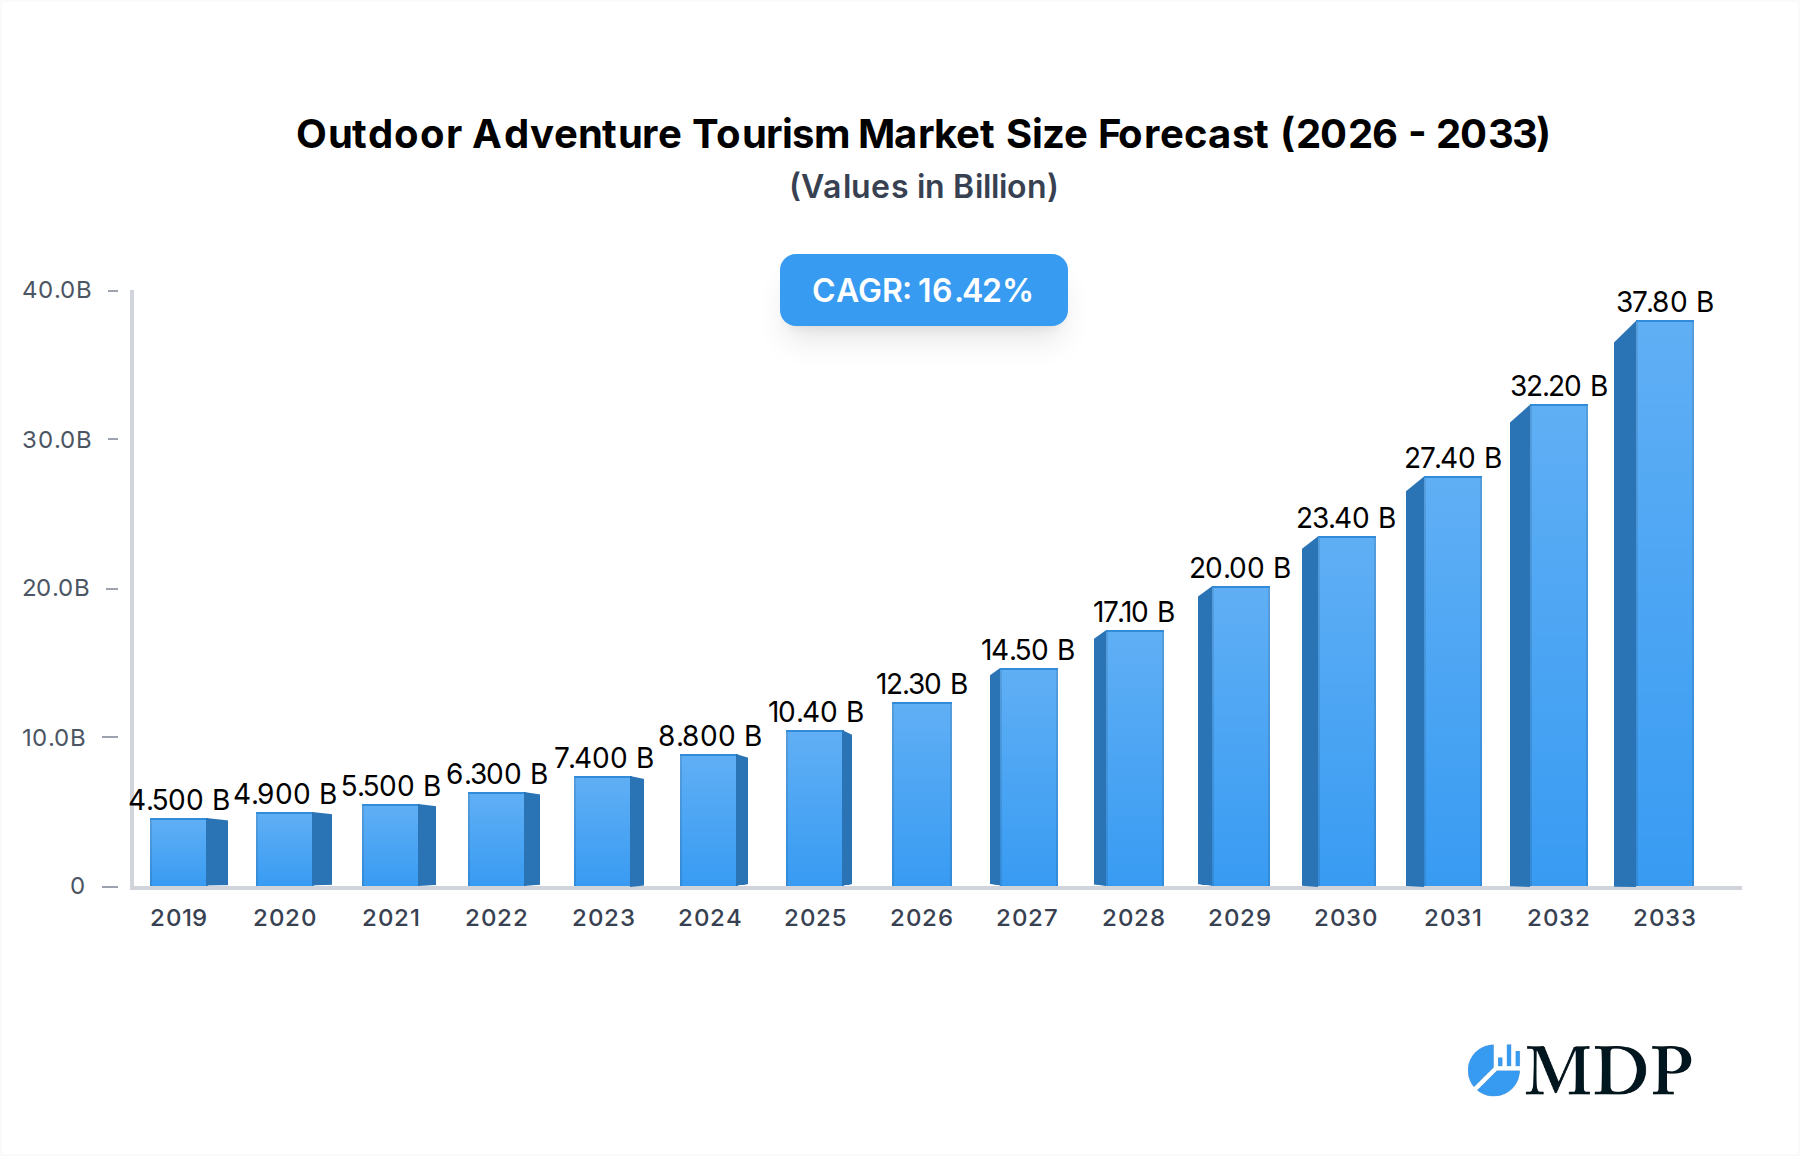
Outdoor Adventure Tourism Market Size (In Billion)
The market is segmented into diverse applications, encompassing both Personal and Commercial use, catering to a broad spectrum of travelers. By type, the adventure unfolds across Aerial, Land, and Water activities, offering a rich tapestry of experiences from paragliding and trekking to kayaking and diving. Leading players like Travelopia, REI Adventures, and Abercrombie & Kent Group are at the forefront, innovating and expanding their offerings to capture this burgeoning market. The forecast period (2025-2033) indicates sustained high growth, suggesting that the allure of outdoor adventure is not a fleeting trend but a fundamental shift in travel paradigms. Emerging markets in Asia Pacific and South America are anticipated to witness particularly rapid expansion, driven by a growing middle class and increasing accessibility to adventure destinations.

Outdoor Adventure Tourism Company Market Share
Unlock the Thrills: Global Outdoor Adventure Tourism Market Report (2019-2033)
**Discover the booming global Outdoor Adventure Tourism market with this comprehensive report. Spanning from 2019 to 2033, this in-depth analysis provides critical insights for industry stakeholders, investors, and enthusiasts. With a base year of 2025 and a forecast period extending to 2033, this report offers a definitive look at market dynamics, emerging trends, leading players, and future growth opportunities in personal and commercial adventure travel across aerial, land, and water segments. Dive into actionable intelligence for strategic decision-making in this dynamic and expanding sector, projected to reach *xx* million in market value by 2025, with a compound annual growth rate (CAGR) of xx% during the forecast period. This report meticulously analyzes the market landscape, covering the historical period from 2019 to 2024 to paint a complete picture of this multi-million dollar industry.**
Outdoor Adventure Tourism Market Dynamics & Concentration
The global Outdoor Adventure Tourism market, valued at approximately xx million in the historical year of 2019, is characterized by a moderate to high level of concentration, with a few prominent players like Travelopia, REI Adventures, Abercrombie & Kent Group, G Adventures, Intrepid Travel, Butterfield & Robinson, O.A.T, Austin Adventures, Natural Habitat Adventures, Mountain Travel Sobek, and Wilderness Travel holding significant market share. Innovation drivers are primarily fueled by the increasing consumer demand for unique, experiential, and sustainable travel. Regulatory frameworks, while varying by region, often focus on environmental protection and safety standards, influencing operational practices. Product substitutes, such as staycations and other forms of leisure tourism, exist, but the unique appeal of adventure tourism continues to drive its growth. End-user trends show a strong preference for authentic experiences, personalization, and digital integration. Mergers and Acquisitions (M&A) activities, with an estimated xx major deals in the historical period, are a key factor in market consolidation, allowing larger companies to expand their portfolios and reach. The market share distribution indicates a competitive yet consolidating landscape, with leading companies strategically acquiring smaller operators or forming alliances to enhance their offerings and operational efficiencies.
Outdoor Adventure Tourism Industry Trends & Analysis
The Outdoor Adventure Tourism industry is experiencing a robust growth trajectory, projected to reach an estimated xx million by 2025, driven by a confluence of powerful market growth drivers. A significant trend is the increasing demand for experiential travel, where consumers seek authentic and immersive experiences that go beyond traditional sightseeing. This preference is amplified by a growing awareness and concern for environmental sustainability, leading to a rise in eco-adventure tours and responsible tourism practices. Technological disruptions are profoundly reshaping the industry; from AI-powered personalized itinerary planning and virtual reality (VR) pre-trip experiences to advanced GPS tracking and drone photography for capturing adventures, technology is enhancing both the planning and execution phases. The market penetration of digital booking platforms and social media influence is exceptionally high, impacting consumer decision-making and promotional strategies. Competitive dynamics are intensifying, with established tour operators facing challenges from nimble new entrants and niche providers specializing in specific adventure types. Consumer preferences are shifting towards more active, healthy, and wellness-focused vacations, integrating adventure with personal well-being. The CAGR for the outdoor adventure tourism market is projected at xx% during the forecast period of 2025–2033, underscoring its significant expansion potential. The historical period of 2019–2024 has laid the groundwork for this accelerated growth, with consistent demand even through global disruptions, highlighting the resilience of this sector. The value of the global outdoor adventure tourism market is predicted to climb to xx million by 2033, a testament to its enduring appeal.
Leading Markets & Segments in Outdoor Adventure Tourism
The dominance of the Personal application segment in Outdoor Adventure Tourism is undeniable, accounting for a substantial market share, estimated at over xx% in 2025. This segment is propelled by increasing disposable incomes, a growing desire for self-discovery, and the influence of social media showcasing aspirational adventure lifestyles. Key drivers for this dominance include robust economic policies fostering tourism and leisure spending, coupled with significant investments in infrastructure development that improve accessibility to remote and natural destinations. The Land type segment also commands a leading position, driven by the vast array of activities it encompasses, from trekking and mountaineering to safaris and cycling tours. Regions like North America and Europe have historically led in land-based adventure tourism due to well-established national parks, trail networks, and a culture that embraces outdoor pursuits.
The Water segment is also experiencing remarkable growth, with activities like kayaking, whitewater rafting, and scuba diving attracting a significant audience. The increasing accessibility of coastal and inland waterways, coupled with advancements in watercraft and safety equipment, contributes to its rising popularity. Emerging economies, particularly in Southeast Asia and Latin America, are becoming significant hubs for water-based adventure tourism, leveraging their extensive coastlines and river systems. While the Commercial application segment, encompassing corporate retreats and team-building activities, represents a smaller but growing portion of the market, its impact on infrastructure development and niche market creation is noteworthy. The Aerial segment, including paragliding and hot air ballooning, remains a niche but high-value segment, attracting adventure seekers looking for unique perspectives and exhilarating experiences. The continued expansion of these diverse segments highlights the multifaceted appeal and ongoing evolution of the Outdoor Adventure Tourism market.
Outdoor Adventure Tourism Product Developments
Product innovations in Outdoor Adventure Tourism are primarily focused on enhancing safety, sustainability, and user experience. This includes the development of more durable and lightweight adventure gear, advanced navigation and communication devices for remote areas, and eco-friendly accommodation options like glamping pods and sustainable lodges. Applications range from guided multi-day treks and challenging expeditions to personalized wellness retreats integrated with adventure activities. Competitive advantages are being gained through unique itinerary design, the use of cutting-edge technology for immersive pre-trip planning and real-time guidance, and a strong commitment to local community engagement and environmental conservation, appealing to a growing segment of conscious travelers.
Key Drivers of Outdoor Adventure Tourism Growth
Several key drivers are propelling the growth of the Outdoor Adventure Tourism market. Technological advancements such as GPS tracking, advanced safety equipment, and digital booking platforms are enhancing accessibility and safety. Economic factors, including rising disposable incomes and a growing middle class in emerging economies, are increasing the capacity for leisure spending. Increased awareness of health and wellness is leading more individuals to seek active vacations. Furthermore, government initiatives promoting tourism and conservation efforts are creating a more favorable environment for adventure tourism development. For instance, the expansion of national park systems and investments in trail infrastructure directly support this sector.
Challenges in the Outdoor Adventure Tourism Market
Despite its robust growth, the Outdoor Adventure Tourism market faces several challenges. Regulatory hurdles and permitting complexities in different countries can hinder the establishment of new adventure activities and limit access to natural areas. Supply chain issues, particularly concerning specialized equipment and experienced guides, can impact operational efficiency and scalability. Intense competitive pressures from both established players and new entrants necessitate continuous innovation and competitive pricing strategies. Environmental vulnerabilities and climate change impacts pose a significant risk to many adventure tourism destinations, potentially disrupting operations and reducing their appeal. Quantifiable impacts include increased insurance premiums due to higher risk perceptions and potential revenue losses from extreme weather events.
Emerging Opportunities in Outdoor Adventure Tourism
Emerging opportunities in Outdoor Adventure Tourism are abundant, driven by several key catalysts. Technological breakthroughs in areas like augmented reality (AR) for enhanced trail navigation and virtual reality (VR) for immersive destination previews are creating new ways to engage consumers. Strategic partnerships between tour operators, technology providers, and conservation organizations can lead to the development of innovative, sustainable, and ethically responsible adventure experiences. Market expansion strategies targeting underserved demographics, such as adventure travel for seniors or families with young children, present significant untapped potential. The growing demand for "transformative travel" experiences that offer personal growth and deeper connections with nature and culture also presents a lucrative avenue for new product development and market penetration.
Leading Players in the Outdoor Adventure Tourism Sector
- Travelopia
- REI Adventures
- Abercrombie & Kent Group
- G Adventures
- Intrepid Travel
- Butterfield & Robinson
- O.A.T
- Austin Adventures
- Natural Habitat Adventures
- Mountain Travel Sobek
- Wilderness Travel
Key Milestones in Outdoor Adventure Tourism Industry
- 2019: Increased adoption of sustainable tourism practices and certifications by major tour operators.
- 2020: Surge in domestic adventure travel due to global travel restrictions, highlighting resilience.
- 2021: Significant investment in digital transformation, including enhanced online booking and virtual experience platforms.
- 2022: Growth in wellness-focused adventure travel, integrating activities with health and mindfulness.
- 2023: Expansion of eco-tourism initiatives and community-based tourism projects in developing regions.
- 2024: Innovations in personal safety technology, such as advanced tracking devices, gain prominence.
Strategic Outlook for Outdoor Adventure Tourism Market
The strategic outlook for the Outdoor Adventure Tourism market is exceptionally positive, fueled by a growing global appetite for authentic, experiential, and sustainable travel. Future growth will be accelerated by the continued integration of cutting-edge technologies, such as AI for personalized trip planning and AR for enhanced on-site experiences. Strategic opportunities lie in developing niche adventure products catering to evolving consumer demands, including wellness retreats, digital detox adventures, and carbon-neutral expeditions. Partnerships with conservation organizations and a strong emphasis on community engagement will be crucial for long-term success and market differentiation, solidifying the market's trajectory towards a multi-million dollar future.
Outdoor Adventure Tourism Segmentation
-
1. Application
- 1.1. Personal
- 1.2. Commercial
-
2. Types
- 2.1. Aerial
- 2.2. Land
- 2.3. Water
Outdoor Adventure Tourism Segmentation By Geography
-
1. North America
- 1.1. United States
- 1.2. Canada
- 1.3. Mexico
-
2. South America
- 2.1. Brazil
- 2.2. Argentina
- 2.3. Rest of South America
-
3. Europe
- 3.1. United Kingdom
- 3.2. Germany
- 3.3. France
- 3.4. Italy
- 3.5. Spain
- 3.6. Russia
- 3.7. Benelux
- 3.8. Nordics
- 3.9. Rest of Europe
-
4. Middle East & Africa
- 4.1. Turkey
- 4.2. Israel
- 4.3. GCC
- 4.4. North Africa
- 4.5. South Africa
- 4.6. Rest of Middle East & Africa
-
5. Asia Pacific
- 5.1. China
- 5.2. India
- 5.3. Japan
- 5.4. South Korea
- 5.5. ASEAN
- 5.6. Oceania
- 5.7. Rest of Asia Pacific
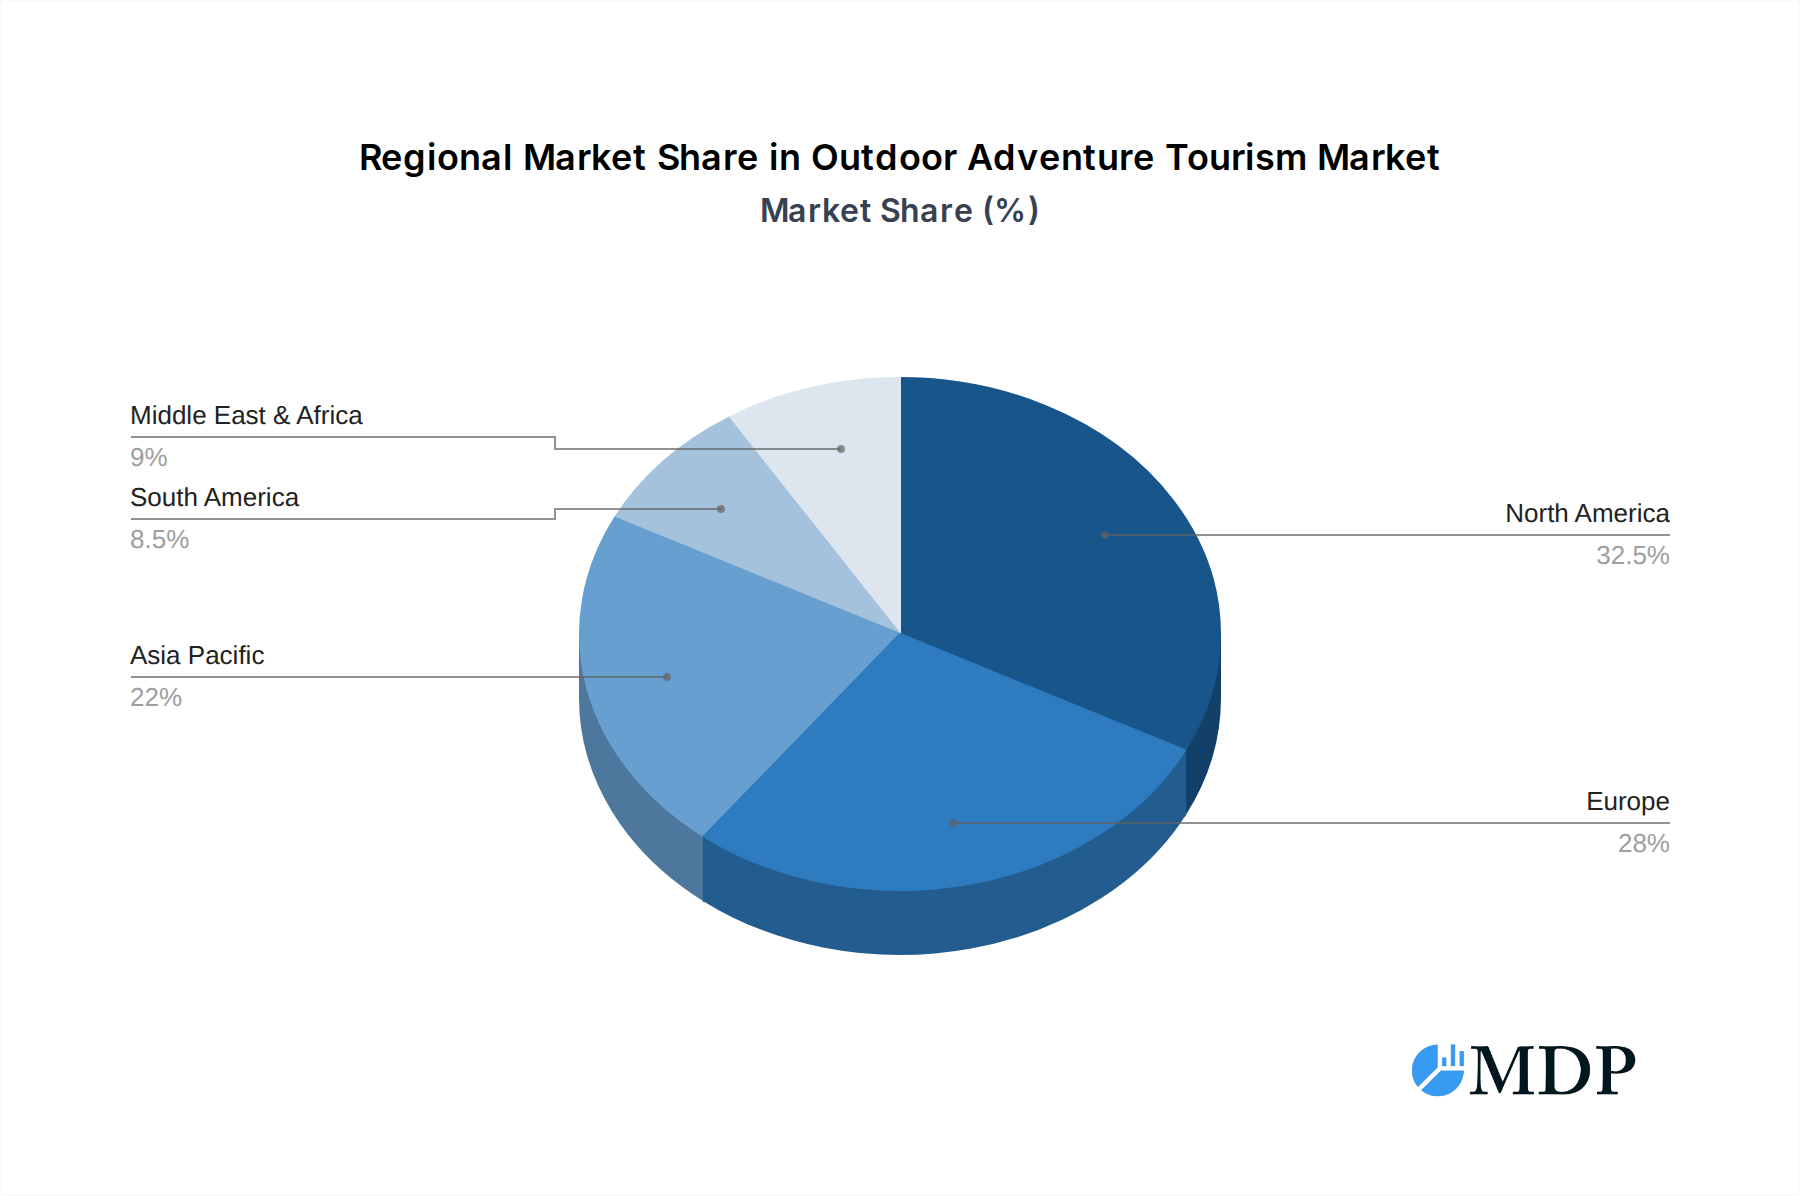
Outdoor Adventure Tourism Regional Market Share
Geographic Coverage of Outdoor Adventure Tourism
Outdoor Adventure Tourism REPORT HIGHLIGHTS
| Aspects | Details |
|---|---|
| Study Period | 2020-2034 |
| Base Year | 2025 |
| Estimated Year | 2026 |
| Forecast Period | 2026-2034 |
| Historical Period | 2020-2025 |
| Growth Rate | CAGR of 18.6% from 2020-2034 |
| Segmentation |
|
Table of Contents
- 1. Introduction
- 1.1. Research Scope
- 1.2. Market Segmentation
- 1.3. Research Methodology
- 1.4. Definitions and Assumptions
- 2. Executive Summary
- 2.1. Introduction
- 3. Market Dynamics
- 3.1. Introduction
- 3.2. Market Drivers
- 3.3. Market Restrains
- 3.4. Market Trends
- 4. Market Factor Analysis
- 4.1. Porters Five Forces
- 4.2. Supply/Value Chain
- 4.3. PESTEL analysis
- 4.4. Market Entropy
- 4.5. Patent/Trademark Analysis
- 5. Global Outdoor Adventure Tourism Analysis, Insights and Forecast, 2020-2032
- 5.1. Market Analysis, Insights and Forecast - by Application
- 5.1.1. Personal
- 5.1.2. Commercial
- 5.2. Market Analysis, Insights and Forecast - by Types
- 5.2.1. Aerial
- 5.2.2. Land
- 5.2.3. Water
- 5.3. Market Analysis, Insights and Forecast - by Region
- 5.3.1. North America
- 5.3.2. South America
- 5.3.3. Europe
- 5.3.4. Middle East & Africa
- 5.3.5. Asia Pacific
- 5.1. Market Analysis, Insights and Forecast - by Application
- 6. North America Outdoor Adventure Tourism Analysis, Insights and Forecast, 2020-2032
- 6.1. Market Analysis, Insights and Forecast - by Application
- 6.1.1. Personal
- 6.1.2. Commercial
- 6.2. Market Analysis, Insights and Forecast - by Types
- 6.2.1. Aerial
- 6.2.2. Land
- 6.2.3. Water
- 6.1. Market Analysis, Insights and Forecast - by Application
- 7. South America Outdoor Adventure Tourism Analysis, Insights and Forecast, 2020-2032
- 7.1. Market Analysis, Insights and Forecast - by Application
- 7.1.1. Personal
- 7.1.2. Commercial
- 7.2. Market Analysis, Insights and Forecast - by Types
- 7.2.1. Aerial
- 7.2.2. Land
- 7.2.3. Water
- 7.1. Market Analysis, Insights and Forecast - by Application
- 8. Europe Outdoor Adventure Tourism Analysis, Insights and Forecast, 2020-2032
- 8.1. Market Analysis, Insights and Forecast - by Application
- 8.1.1. Personal
- 8.1.2. Commercial
- 8.2. Market Analysis, Insights and Forecast - by Types
- 8.2.1. Aerial
- 8.2.2. Land
- 8.2.3. Water
- 8.1. Market Analysis, Insights and Forecast - by Application
- 9. Middle East & Africa Outdoor Adventure Tourism Analysis, Insights and Forecast, 2020-2032
- 9.1. Market Analysis, Insights and Forecast - by Application
- 9.1.1. Personal
- 9.1.2. Commercial
- 9.2. Market Analysis, Insights and Forecast - by Types
- 9.2.1. Aerial
- 9.2.2. Land
- 9.2.3. Water
- 9.1. Market Analysis, Insights and Forecast - by Application
- 10. Asia Pacific Outdoor Adventure Tourism Analysis, Insights and Forecast, 2020-2032
- 10.1. Market Analysis, Insights and Forecast - by Application
- 10.1.1. Personal
- 10.1.2. Commercial
- 10.2. Market Analysis, Insights and Forecast - by Types
- 10.2.1. Aerial
- 10.2.2. Land
- 10.2.3. Water
- 10.1. Market Analysis, Insights and Forecast - by Application
- 11. Competitive Analysis
- 11.1. Global Market Share Analysis 2025
- 11.2. Company Profiles
- 11.2.1 Travelopia
- 11.2.1.1. Overview
- 11.2.1.2. Products
- 11.2.1.3. SWOT Analysis
- 11.2.1.4. Recent Developments
- 11.2.1.5. Financials (Based on Availability)
- 11.2.2 REI Adventures
- 11.2.2.1. Overview
- 11.2.2.2. Products
- 11.2.2.3. SWOT Analysis
- 11.2.2.4. Recent Developments
- 11.2.2.5. Financials (Based on Availability)
- 11.2.3 Abercrombie & Kent Group
- 11.2.3.1. Overview
- 11.2.3.2. Products
- 11.2.3.3. SWOT Analysis
- 11.2.3.4. Recent Developments
- 11.2.3.5. Financials (Based on Availability)
- 11.2.4 G Adventures
- 11.2.4.1. Overview
- 11.2.4.2. Products
- 11.2.4.3. SWOT Analysis
- 11.2.4.4. Recent Developments
- 11.2.4.5. Financials (Based on Availability)
- 11.2.5 Intrepid Travel
- 11.2.5.1. Overview
- 11.2.5.2. Products
- 11.2.5.3. SWOT Analysis
- 11.2.5.4. Recent Developments
- 11.2.5.5. Financials (Based on Availability)
- 11.2.6 Butterfield & Robinson
- 11.2.6.1. Overview
- 11.2.6.2. Products
- 11.2.6.3. SWOT Analysis
- 11.2.6.4. Recent Developments
- 11.2.6.5. Financials (Based on Availability)
- 11.2.7 O.A.T
- 11.2.7.1. Overview
- 11.2.7.2. Products
- 11.2.7.3. SWOT Analysis
- 11.2.7.4. Recent Developments
- 11.2.7.5. Financials (Based on Availability)
- 11.2.8 Austin Adventures
- 11.2.8.1. Overview
- 11.2.8.2. Products
- 11.2.8.3. SWOT Analysis
- 11.2.8.4. Recent Developments
- 11.2.8.5. Financials (Based on Availability)
- 11.2.9 Natural Habitat Adventures
- 11.2.9.1. Overview
- 11.2.9.2. Products
- 11.2.9.3. SWOT Analysis
- 11.2.9.4. Recent Developments
- 11.2.9.5. Financials (Based on Availability)
- 11.2.10 Mountain Travel Sobek
- 11.2.10.1. Overview
- 11.2.10.2. Products
- 11.2.10.3. SWOT Analysis
- 11.2.10.4. Recent Developments
- 11.2.10.5. Financials (Based on Availability)
- 11.2.11 Wilderness Travel
- 11.2.11.1. Overview
- 11.2.11.2. Products
- 11.2.11.3. SWOT Analysis
- 11.2.11.4. Recent Developments
- 11.2.11.5. Financials (Based on Availability)
- 11.2.1 Travelopia
List of Figures
- Figure 1: Global Outdoor Adventure Tourism Revenue Breakdown (million, %) by Region 2025 & 2033
- Figure 2: North America Outdoor Adventure Tourism Revenue (million), by Application 2025 & 2033
- Figure 3: North America Outdoor Adventure Tourism Revenue Share (%), by Application 2025 & 2033
- Figure 4: North America Outdoor Adventure Tourism Revenue (million), by Types 2025 & 2033
- Figure 5: North America Outdoor Adventure Tourism Revenue Share (%), by Types 2025 & 2033
- Figure 6: North America Outdoor Adventure Tourism Revenue (million), by Country 2025 & 2033
- Figure 7: North America Outdoor Adventure Tourism Revenue Share (%), by Country 2025 & 2033
- Figure 8: South America Outdoor Adventure Tourism Revenue (million), by Application 2025 & 2033
- Figure 9: South America Outdoor Adventure Tourism Revenue Share (%), by Application 2025 & 2033
- Figure 10: South America Outdoor Adventure Tourism Revenue (million), by Types 2025 & 2033
- Figure 11: South America Outdoor Adventure Tourism Revenue Share (%), by Types 2025 & 2033
- Figure 12: South America Outdoor Adventure Tourism Revenue (million), by Country 2025 & 2033
- Figure 13: South America Outdoor Adventure Tourism Revenue Share (%), by Country 2025 & 2033
- Figure 14: Europe Outdoor Adventure Tourism Revenue (million), by Application 2025 & 2033
- Figure 15: Europe Outdoor Adventure Tourism Revenue Share (%), by Application 2025 & 2033
- Figure 16: Europe Outdoor Adventure Tourism Revenue (million), by Types 2025 & 2033
- Figure 17: Europe Outdoor Adventure Tourism Revenue Share (%), by Types 2025 & 2033
- Figure 18: Europe Outdoor Adventure Tourism Revenue (million), by Country 2025 & 2033
- Figure 19: Europe Outdoor Adventure Tourism Revenue Share (%), by Country 2025 & 2033
- Figure 20: Middle East & Africa Outdoor Adventure Tourism Revenue (million), by Application 2025 & 2033
- Figure 21: Middle East & Africa Outdoor Adventure Tourism Revenue Share (%), by Application 2025 & 2033
- Figure 22: Middle East & Africa Outdoor Adventure Tourism Revenue (million), by Types 2025 & 2033
- Figure 23: Middle East & Africa Outdoor Adventure Tourism Revenue Share (%), by Types 2025 & 2033
- Figure 24: Middle East & Africa Outdoor Adventure Tourism Revenue (million), by Country 2025 & 2033
- Figure 25: Middle East & Africa Outdoor Adventure Tourism Revenue Share (%), by Country 2025 & 2033
- Figure 26: Asia Pacific Outdoor Adventure Tourism Revenue (million), by Application 2025 & 2033
- Figure 27: Asia Pacific Outdoor Adventure Tourism Revenue Share (%), by Application 2025 & 2033
- Figure 28: Asia Pacific Outdoor Adventure Tourism Revenue (million), by Types 2025 & 2033
- Figure 29: Asia Pacific Outdoor Adventure Tourism Revenue Share (%), by Types 2025 & 2033
- Figure 30: Asia Pacific Outdoor Adventure Tourism Revenue (million), by Country 2025 & 2033
- Figure 31: Asia Pacific Outdoor Adventure Tourism Revenue Share (%), by Country 2025 & 2033
List of Tables
- Table 1: Global Outdoor Adventure Tourism Revenue million Forecast, by Application 2020 & 2033
- Table 2: Global Outdoor Adventure Tourism Revenue million Forecast, by Types 2020 & 2033
- Table 3: Global Outdoor Adventure Tourism Revenue million Forecast, by Region 2020 & 2033
- Table 4: Global Outdoor Adventure Tourism Revenue million Forecast, by Application 2020 & 2033
- Table 5: Global Outdoor Adventure Tourism Revenue million Forecast, by Types 2020 & 2033
- Table 6: Global Outdoor Adventure Tourism Revenue million Forecast, by Country 2020 & 2033
- Table 7: United States Outdoor Adventure Tourism Revenue (million) Forecast, by Application 2020 & 2033
- Table 8: Canada Outdoor Adventure Tourism Revenue (million) Forecast, by Application 2020 & 2033
- Table 9: Mexico Outdoor Adventure Tourism Revenue (million) Forecast, by Application 2020 & 2033
- Table 10: Global Outdoor Adventure Tourism Revenue million Forecast, by Application 2020 & 2033
- Table 11: Global Outdoor Adventure Tourism Revenue million Forecast, by Types 2020 & 2033
- Table 12: Global Outdoor Adventure Tourism Revenue million Forecast, by Country 2020 & 2033
- Table 13: Brazil Outdoor Adventure Tourism Revenue (million) Forecast, by Application 2020 & 2033
- Table 14: Argentina Outdoor Adventure Tourism Revenue (million) Forecast, by Application 2020 & 2033
- Table 15: Rest of South America Outdoor Adventure Tourism Revenue (million) Forecast, by Application 2020 & 2033
- Table 16: Global Outdoor Adventure Tourism Revenue million Forecast, by Application 2020 & 2033
- Table 17: Global Outdoor Adventure Tourism Revenue million Forecast, by Types 2020 & 2033
- Table 18: Global Outdoor Adventure Tourism Revenue million Forecast, by Country 2020 & 2033
- Table 19: United Kingdom Outdoor Adventure Tourism Revenue (million) Forecast, by Application 2020 & 2033
- Table 20: Germany Outdoor Adventure Tourism Revenue (million) Forecast, by Application 2020 & 2033
- Table 21: France Outdoor Adventure Tourism Revenue (million) Forecast, by Application 2020 & 2033
- Table 22: Italy Outdoor Adventure Tourism Revenue (million) Forecast, by Application 2020 & 2033
- Table 23: Spain Outdoor Adventure Tourism Revenue (million) Forecast, by Application 2020 & 2033
- Table 24: Russia Outdoor Adventure Tourism Revenue (million) Forecast, by Application 2020 & 2033
- Table 25: Benelux Outdoor Adventure Tourism Revenue (million) Forecast, by Application 2020 & 2033
- Table 26: Nordics Outdoor Adventure Tourism Revenue (million) Forecast, by Application 2020 & 2033
- Table 27: Rest of Europe Outdoor Adventure Tourism Revenue (million) Forecast, by Application 2020 & 2033
- Table 28: Global Outdoor Adventure Tourism Revenue million Forecast, by Application 2020 & 2033
- Table 29: Global Outdoor Adventure Tourism Revenue million Forecast, by Types 2020 & 2033
- Table 30: Global Outdoor Adventure Tourism Revenue million Forecast, by Country 2020 & 2033
- Table 31: Turkey Outdoor Adventure Tourism Revenue (million) Forecast, by Application 2020 & 2033
- Table 32: Israel Outdoor Adventure Tourism Revenue (million) Forecast, by Application 2020 & 2033
- Table 33: GCC Outdoor Adventure Tourism Revenue (million) Forecast, by Application 2020 & 2033
- Table 34: North Africa Outdoor Adventure Tourism Revenue (million) Forecast, by Application 2020 & 2033
- Table 35: South Africa Outdoor Adventure Tourism Revenue (million) Forecast, by Application 2020 & 2033
- Table 36: Rest of Middle East & Africa Outdoor Adventure Tourism Revenue (million) Forecast, by Application 2020 & 2033
- Table 37: Global Outdoor Adventure Tourism Revenue million Forecast, by Application 2020 & 2033
- Table 38: Global Outdoor Adventure Tourism Revenue million Forecast, by Types 2020 & 2033
- Table 39: Global Outdoor Adventure Tourism Revenue million Forecast, by Country 2020 & 2033
- Table 40: China Outdoor Adventure Tourism Revenue (million) Forecast, by Application 2020 & 2033
- Table 41: India Outdoor Adventure Tourism Revenue (million) Forecast, by Application 2020 & 2033
- Table 42: Japan Outdoor Adventure Tourism Revenue (million) Forecast, by Application 2020 & 2033
- Table 43: South Korea Outdoor Adventure Tourism Revenue (million) Forecast, by Application 2020 & 2033
- Table 44: ASEAN Outdoor Adventure Tourism Revenue (million) Forecast, by Application 2020 & 2033
- Table 45: Oceania Outdoor Adventure Tourism Revenue (million) Forecast, by Application 2020 & 2033
- Table 46: Rest of Asia Pacific Outdoor Adventure Tourism Revenue (million) Forecast, by Application 2020 & 2033
Frequently Asked Questions
1. What is the projected Compound Annual Growth Rate (CAGR) of the Outdoor Adventure Tourism?
The projected CAGR is approximately 18.6%.
2. Which companies are prominent players in the Outdoor Adventure Tourism?
Key companies in the market include Travelopia, REI Adventures, Abercrombie & Kent Group, G Adventures, Intrepid Travel, Butterfield & Robinson, O.A.T, Austin Adventures, Natural Habitat Adventures, Mountain Travel Sobek, Wilderness Travel.
3. What are the main segments of the Outdoor Adventure Tourism?
The market segments include Application, Types.
4. Can you provide details about the market size?
The market size is estimated to be USD 13830 million as of 2022.
5. What are some drivers contributing to market growth?
N/A
6. What are the notable trends driving market growth?
N/A
7. Are there any restraints impacting market growth?
N/A
8. Can you provide examples of recent developments in the market?
N/A
9. What pricing options are available for accessing the report?
Pricing options include single-user, multi-user, and enterprise licenses priced at USD 4900.00, USD 7350.00, and USD 9800.00 respectively.
10. Is the market size provided in terms of value or volume?
The market size is provided in terms of value, measured in million.
11. Are there any specific market keywords associated with the report?
Yes, the market keyword associated with the report is "Outdoor Adventure Tourism," which aids in identifying and referencing the specific market segment covered.
12. How do I determine which pricing option suits my needs best?
The pricing options vary based on user requirements and access needs. Individual users may opt for single-user licenses, while businesses requiring broader access may choose multi-user or enterprise licenses for cost-effective access to the report.
13. Are there any additional resources or data provided in the Outdoor Adventure Tourism report?
While the report offers comprehensive insights, it's advisable to review the specific contents or supplementary materials provided to ascertain if additional resources or data are available.
14. How can I stay updated on further developments or reports in the Outdoor Adventure Tourism?
To stay informed about further developments, trends, and reports in the Outdoor Adventure Tourism, consider subscribing to industry newsletters, following relevant companies and organizations, or regularly checking reputable industry news sources and publications.
Methodology
Step 1 - Identification of Relevant Samples Size from Population Database


Step 2 - Approaches for Defining Global Market Size (Value, Volume* & Price*)

Note*: In applicable scenarios
Step 3 - Data Sources
Primary Research
- Web Analytics
- Survey Reports
- Research Institute
- Latest Research Reports
- Opinion Leaders
Secondary Research
- Annual Reports
- White Paper
- Latest Press Release
- Industry Association
- Paid Database
- Investor Presentations

Step 4 - Data Triangulation
Involves using different sources of information in order to increase the validity of a study
These sources are likely to be stakeholders in a program - participants, other researchers, program staff, other community members, and so on.
Then we put all data in single framework & apply various statistical tools to find out the dynamic on the market.
During the analysis stage, feedback from the stakeholder groups would be compared to determine areas of agreement as well as areas of divergence