

Key Insights
The global orthopedic planning systems market is experiencing robust growth, driven by the increasing prevalence of orthopedic conditions, advancements in imaging technologies, and a rising demand for minimally invasive surgical procedures. The market's expansion is further fueled by the integration of artificial intelligence (AI) and machine learning (ML) into surgical planning software, leading to improved accuracy and efficiency. Technological advancements such as 3D printing and computer-assisted surgery (CAS) are also playing a significant role in driving market growth. While the market is currently dominated by established players like Stryker and Zimmer Biomet, smaller companies focusing on innovative solutions and niche applications are making inroads. The market is segmented by product type (software, hardware, services), application (hip replacement, knee replacement, spine surgery, etc.), and end-user (hospitals, ambulatory surgical centers, etc.). We estimate the 2025 market size to be approximately $1.5 billion, based on observable market trends and growth in related medical technology sectors, with a projected Compound Annual Growth Rate (CAGR) of around 8% over the forecast period (2025-2033). This growth, however, might face certain restraints such as high initial investment costs associated with the technology and the need for skilled professionals to operate the systems. The regulatory landscape and reimbursement policies also play a significant role in shaping market dynamics.
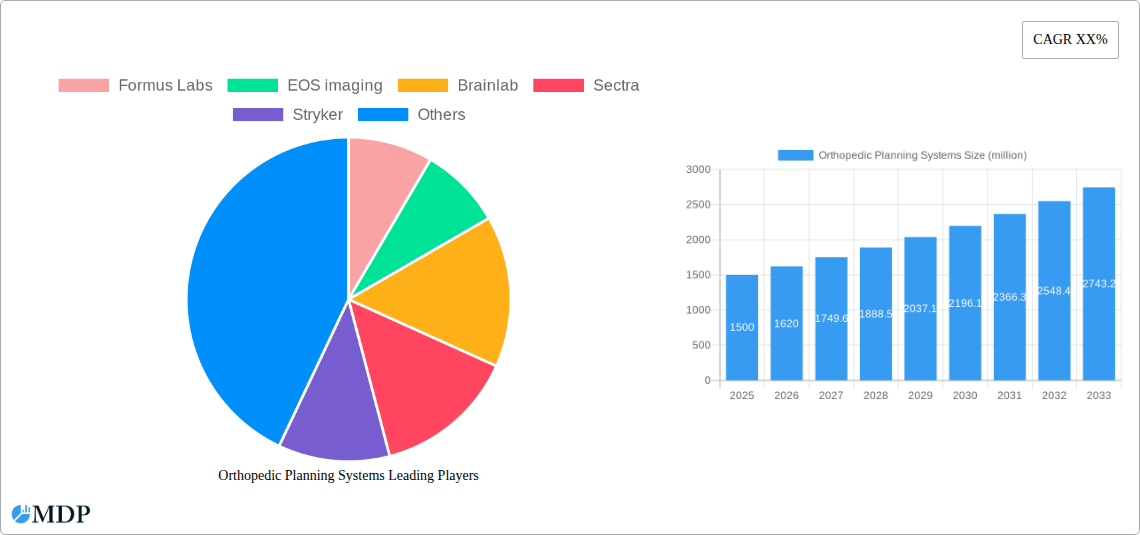
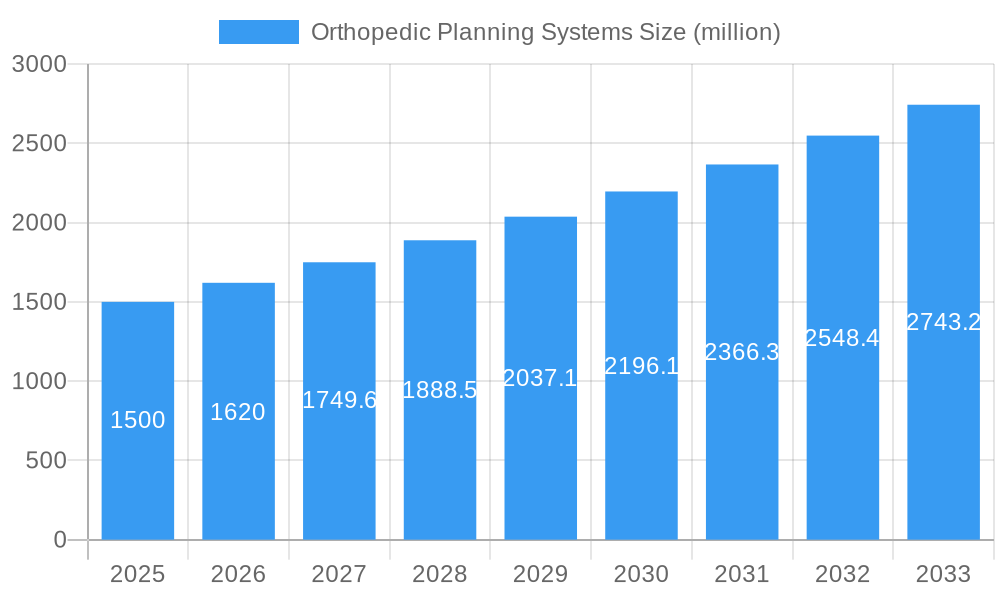
Orthopedic Planning Systems Market Size (In Billion)
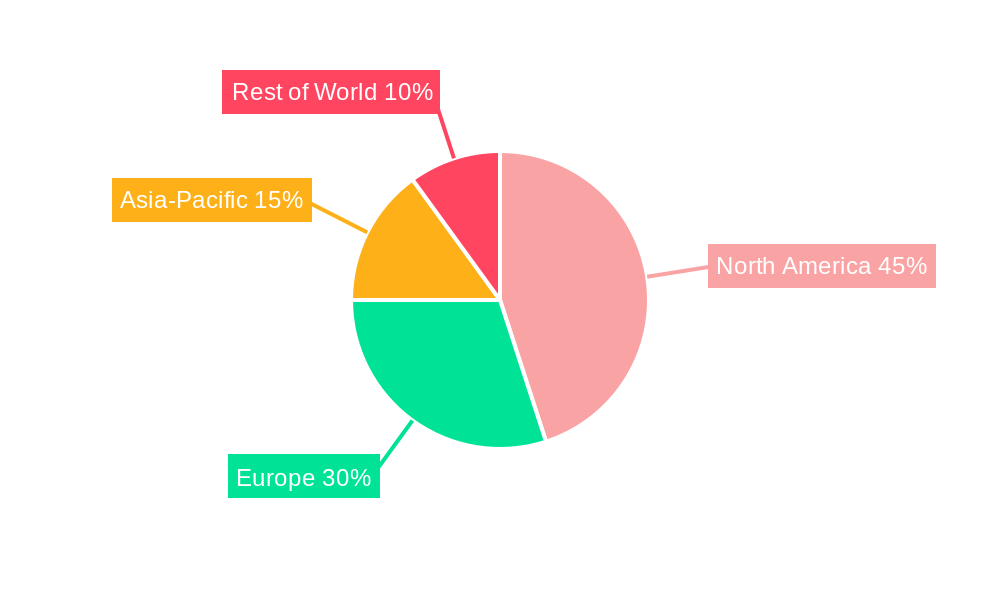
The geographic landscape shows a significant concentration of market share in North America and Europe, owing to well-established healthcare infrastructure and high adoption rates of advanced surgical technologies. However, emerging economies in Asia-Pacific and Latin America are expected to witness significant growth in the coming years driven by increasing healthcare spending and rising prevalence of orthopedic diseases. The competitive landscape is characterized by a mix of large multinational corporations and smaller specialized companies. The market will likely see increased strategic partnerships, mergers, and acquisitions as companies seek to expand their product portfolios and market reach. This will be crucial for sustaining growth in the face of increasing competition and technological disruption. Future growth will likely depend on the successful integration of advanced technologies, such as AI-powered predictive analytics and augmented reality (AR) capabilities, into surgical planning workflows.
Orthopedic Planning Systems Company Market Share
Orthopedic Planning Systems Market Report: 2019-2033
Unlocking the Trillion-Dollar Potential: A Comprehensive Analysis of the Orthopedic Planning Systems Market
This in-depth report provides a comprehensive analysis of the Orthopedic Planning Systems market, projecting a market valuation exceeding $1 trillion by 2033. The study period spans from 2019 to 2033, with 2025 serving as both the base and estimated year. The forecast period covers 2025-2033, while the historical period encompasses 2019-2024. Key players like Stryker, Zimmer Biomet, and Brainlab are analyzed alongside emerging companies, providing a 360-degree view of this rapidly evolving sector. This report is essential for investors, industry professionals, and strategic decision-makers seeking to understand and capitalize on the immense growth opportunities within the orthopedic planning systems market.
Orthopedic Planning Systems Market Dynamics & Concentration
The orthopedic planning systems market exhibits a moderately concentrated landscape, with a handful of major players commanding significant market share. In 2025, the top five companies—Stryker, Zimmer Biomet, Brainlab, Materialise, and Sectra—are estimated to collectively hold approximately xx% of the market. However, the market is witnessing increased competition from smaller, innovative companies focusing on niche applications and advanced technologies.
- Market Concentration: The Herfindahl-Hirschman Index (HHI) is estimated to be around xx in 2025, indicating a moderately concentrated market.
- Innovation Drivers: The adoption of AI, machine learning, and 3D printing technologies are driving significant innovation in the sector, leading to more precise and personalized planning solutions.
- Regulatory Frameworks: Stringent regulatory approvals (e.g., FDA 510(k) clearance) impact market entry and influence the adoption of new technologies.
- Product Substitutes: Traditional manual planning methods remain prevalent, but their market share is declining due to the advantages offered by sophisticated planning systems.
- End-User Trends: Growing demand for minimally invasive surgeries and improved patient outcomes fuels the adoption of advanced planning systems.
- M&A Activities: The past five years have seen xx major mergers and acquisitions in the orthopedic planning systems market, driven by the desire for market expansion and technological integration. This trend is expected to continue, particularly within the sub-segments focusing on AI-driven planning and 3D printing solutions.
Orthopedic Planning Systems Industry Trends & Analysis
The orthopedic planning systems market is experiencing robust growth, driven by several key factors. The market is projected to achieve a Compound Annual Growth Rate (CAGR) of xx% during the forecast period (2025-2033). This growth is primarily attributable to the increasing prevalence of orthopedic conditions, technological advancements, and a rising preference for minimally invasive surgical techniques. Market penetration is expected to reach xx% by 2033, indicating significant growth potential, particularly in emerging markets. Technological disruptions, such as the integration of AI and machine learning, are revolutionizing surgical planning. This leads to improved accuracy, reduced surgical time, and better patient outcomes. The demand for personalized surgical plans, driven by consumer preferences for tailored care, also boosts market growth. Intense competition among established players and emerging companies drives innovation and ensures continuous improvement in the quality and affordability of orthopedic planning systems.
Leading Markets & Segments in Orthopedic Planning Systems
The North American region is projected to dominate the orthopedic planning systems market throughout the forecast period, accounting for an estimated xx% market share in 2025. This dominance is attributed to several key factors:
Key Drivers in North America:
- High prevalence of orthopedic conditions.
- Well-established healthcare infrastructure.
- High adoption of advanced medical technologies.
- Favorable reimbursement policies.
- Extensive research and development activities.
Dominance Analysis: The strong presence of major industry players, coupled with favorable regulatory environment and high healthcare expenditure, contribute to North America's leading position. European markets are also projected to experience significant growth, driven by increasing investments in healthcare infrastructure and rising demand for advanced surgical planning technologies. Asia-Pacific is poised for substantial expansion, particularly in rapidly developing economies like China and India. This is largely driven by growing awareness of sophisticated surgical techniques and an expanding middle class with greater access to healthcare.
Orthopedic Planning Systems Product Developments
Recent product developments focus on enhancing accuracy, efficiency, and personalization in surgical planning. Innovations include AI-powered image analysis, advanced 3D modeling capabilities, and integration with robotic surgery platforms. These advancements enable surgeons to create highly personalized surgical plans, minimizing invasiveness, improving accuracy, and leading to better patient outcomes. The incorporation of augmented reality (AR) and virtual reality (VR) technologies also enhances the precision and efficacy of surgical planning. These product innovations are directly responding to market demands for improved surgical outcomes and patient satisfaction.
Key Drivers of Orthopedic Planning Systems Growth
Several factors contribute to the sustained growth of the orthopedic planning systems market. These include:
- Technological Advancements: The integration of AI, machine learning, and 3D printing technologies enhances planning accuracy and efficiency, leading to increased adoption.
- Economic Factors: Rising healthcare expenditure and increasing disposable incomes in several regions fuel the market’s growth.
- Regulatory Support: Government initiatives promoting the adoption of advanced medical technologies further stimulate market expansion. For example, initiatives focusing on minimally invasive surgeries in several regions create increased demand for sophisticated planning systems.
Challenges in the Orthopedic Planning Systems Market
Despite strong growth prospects, the market faces several challenges:
- Regulatory Hurdles: The stringent regulatory requirements for medical devices can delay product launches and increase development costs, impacting market entry.
- Supply Chain Issues: Disruptions in global supply chains can affect the availability and cost of critical components, impacting production and pricing.
- Competitive Pressures: Intense competition among established players and new entrants can create pricing pressure and impact profit margins. The market share of approximately xx% held by the top 5 players indicates the significant level of competition.
Emerging Opportunities in Orthopedic Planning Systems
The orthopedic planning systems market presents several long-term growth opportunities. These include:
- Technological Breakthroughs: Continued advancements in AI, machine learning, and 3D printing will unlock further improvements in planning accuracy and efficiency, driving demand.
- Strategic Partnerships: Collaborations between medical device companies, hospitals, and research institutions will foster innovation and accelerate product development.
- Market Expansion: Expanding into emerging markets with growing healthcare infrastructure and increasing demand for advanced surgical procedures will create new revenue streams.
Leading Players in the Orthopedic Planning Systems Sector
- Formus Labs
- EOS imaging
- Brainlab
- Sectra
- Stryker
- Materialise
- Medstrat
- MediCAD Hectec GmbH
- 3D Systems
- PEEK HEALTH
- Radlink
- SurgiNovi
- RSA Biomedical
- HIPOP-PLAN
- Zimmer Biomet
- Optinav
- Enhatch
- Numex GmbH
- Corin Group
Key Milestones in Orthopedic Planning Systems Industry
- 2020: FDA approval of AI-powered planning software by Company X.
- 2021: Launch of a new 3D-printed implant system by Company Y.
- 2022: Strategic partnership between Company Z and a major hospital system for joint research and development.
- 2023: Acquisition of a smaller competitor by a leading orthopedic planning systems company.
- 2024: Introduction of a novel surgical planning platform integrating AR/VR technologies. (xx further milestones to be added based on available data).
Strategic Outlook for Orthopedic Planning Systems Market
The orthopedic planning systems market is poised for continued growth, driven by technological advancements, increasing demand for minimally invasive surgeries, and expanding healthcare infrastructure in emerging markets. Strategic opportunities exist for companies to leverage AI, machine learning, and 3D printing technologies to create innovative and personalized surgical planning solutions. Focusing on strategic partnerships and expanding into new geographical markets will be crucial for maximizing growth potential. The market's long-term outlook remains exceptionally positive, driven by the ever-increasing need for efficient, precise, and personalized orthopedic care.
Orthopedic Planning Systems Segmentation
-
1. Application
- 1.1. Hospitals
- 1.2. Ambulatory Surgical Centers
- 1.3. Orthopaedic Office-Based Clinics
-
2. Types
- 2.1. Pre-Surgical Planning Software
- 2.2. Post-Surgical Planning Software
Orthopedic Planning Systems Segmentation By Geography
-
1. North America
- 1.1. United States
- 1.2. Canada
- 1.3. Mexico
-
2. South America
- 2.1. Brazil
- 2.2. Argentina
- 2.3. Rest of South America
-
3. Europe
- 3.1. United Kingdom
- 3.2. Germany
- 3.3. France
- 3.4. Italy
- 3.5. Spain
- 3.6. Russia
- 3.7. Benelux
- 3.8. Nordics
- 3.9. Rest of Europe
-
4. Middle East & Africa
- 4.1. Turkey
- 4.2. Israel
- 4.3. GCC
- 4.4. North Africa
- 4.5. South Africa
- 4.6. Rest of Middle East & Africa
-
5. Asia Pacific
- 5.1. China
- 5.2. India
- 5.3. Japan
- 5.4. South Korea
- 5.5. ASEAN
- 5.6. Oceania
- 5.7. Rest of Asia Pacific
Orthopedic Planning Systems Regional Market Share
Geographic Coverage of Orthopedic Planning Systems
Orthopedic Planning Systems REPORT HIGHLIGHTS
| Aspects | Details |
|---|---|
| Study Period | 2020-2034 |
| Base Year | 2025 |
| Estimated Year | 2026 |
| Forecast Period | 2026-2034 |
| Historical Period | 2020-2025 |
| Growth Rate | CAGR of 5% from 2020-2034 |
| Segmentation |
|
Table of Contents
- 1. Introduction
- 1.1. Research Scope
- 1.2. Market Segmentation
- 1.3. Research Objective
- 1.4. Definitions and Assumptions
- 2. Executive Summary
- 2.1. Market Snapshot
- 3. Market Dynamics
- 3.1. Market Drivers
- 3.2. Market Restrains
- 3.3. Market Trends
- 3.4. Market Opportunities
- 4. Market Factor Analysis
- 4.1. Porters Five Forces
- 4.1.1. Bargaining Power of Suppliers
- 4.1.2. Bargaining Power of Buyers
- 4.1.3. Threat of New Entrants
- 4.1.4. Threat of Substitutes
- 4.1.5. Competitive Rivalry
- 4.2. PESTEL analysis
- 4.3. BCG Analysis
- 4.3.1. Stars (High Growth, High Market Share)
- 4.3.2. Cash Cows (Low Growth, High Market Share)
- 4.3.3. Question Mark (High Growth, Low Market Share)
- 4.3.4. Dogs (Low Growth, Low Market Share)
- 4.4. Ansoff Matrix Analysis
- 4.5. Supply Chain Analysis
- 4.6. Regulatory Landscape
- 4.7. Current Market Potential and Opportunity Assessment (TAM–SAM–SOM Framework)
- 4.8. MDP Analyst Note
- 4.1. Porters Five Forces
- 5. Market Analysis, Insights and Forecast 2021-2033
- 5.1. Market Analysis, Insights and Forecast - by Application
- 5.1.1. Hospitals
- 5.1.2. Ambulatory Surgical Centers
- 5.1.3. Orthopaedic Office-Based Clinics
- 5.2. Market Analysis, Insights and Forecast - by Types
- 5.2.1. Pre-Surgical Planning Software
- 5.2.2. Post-Surgical Planning Software
- 5.3. Market Analysis, Insights and Forecast - by Region
- 5.3.1. North America
- 5.3.2. South America
- 5.3.3. Europe
- 5.3.4. Middle East & Africa
- 5.3.5. Asia Pacific
- 5.1. Market Analysis, Insights and Forecast - by Application
- 6. Global Orthopedic Planning Systems Analysis, Insights and Forecast, 2021-2033
- 6.1. Market Analysis, Insights and Forecast - by Application
- 6.1.1. Hospitals
- 6.1.2. Ambulatory Surgical Centers
- 6.1.3. Orthopaedic Office-Based Clinics
- 6.2. Market Analysis, Insights and Forecast - by Types
- 6.2.1. Pre-Surgical Planning Software
- 6.2.2. Post-Surgical Planning Software
- 6.1. Market Analysis, Insights and Forecast - by Application
- 7. North America Orthopedic Planning Systems Analysis, Insights and Forecast, 2020-2032
- 7.1. Market Analysis, Insights and Forecast - by Application
- 7.1.1. Hospitals
- 7.1.2. Ambulatory Surgical Centers
- 7.1.3. Orthopaedic Office-Based Clinics
- 7.2. Market Analysis, Insights and Forecast - by Types
- 7.2.1. Pre-Surgical Planning Software
- 7.2.2. Post-Surgical Planning Software
- 7.1. Market Analysis, Insights and Forecast - by Application
- 8. South America Orthopedic Planning Systems Analysis, Insights and Forecast, 2020-2032
- 8.1. Market Analysis, Insights and Forecast - by Application
- 8.1.1. Hospitals
- 8.1.2. Ambulatory Surgical Centers
- 8.1.3. Orthopaedic Office-Based Clinics
- 8.2. Market Analysis, Insights and Forecast - by Types
- 8.2.1. Pre-Surgical Planning Software
- 8.2.2. Post-Surgical Planning Software
- 8.1. Market Analysis, Insights and Forecast - by Application
- 9. Europe Orthopedic Planning Systems Analysis, Insights and Forecast, 2020-2032
- 9.1. Market Analysis, Insights and Forecast - by Application
- 9.1.1. Hospitals
- 9.1.2. Ambulatory Surgical Centers
- 9.1.3. Orthopaedic Office-Based Clinics
- 9.2. Market Analysis, Insights and Forecast - by Types
- 9.2.1. Pre-Surgical Planning Software
- 9.2.2. Post-Surgical Planning Software
- 9.1. Market Analysis, Insights and Forecast - by Application
- 10. Middle East & Africa Orthopedic Planning Systems Analysis, Insights and Forecast, 2020-2032
- 10.1. Market Analysis, Insights and Forecast - by Application
- 10.1.1. Hospitals
- 10.1.2. Ambulatory Surgical Centers
- 10.1.3. Orthopaedic Office-Based Clinics
- 10.2. Market Analysis, Insights and Forecast - by Types
- 10.2.1. Pre-Surgical Planning Software
- 10.2.2. Post-Surgical Planning Software
- 10.1. Market Analysis, Insights and Forecast - by Application
- 11. Asia Pacific Orthopedic Planning Systems Analysis, Insights and Forecast, 2020-2032
- 11.1. Market Analysis, Insights and Forecast - by Application
- 11.1.1. Hospitals
- 11.1.2. Ambulatory Surgical Centers
- 11.1.3. Orthopaedic Office-Based Clinics
- 11.2. Market Analysis, Insights and Forecast - by Types
- 11.2.1. Pre-Surgical Planning Software
- 11.2.2. Post-Surgical Planning Software
- 11.1. Market Analysis, Insights and Forecast - by Application
- 12. Competitive Analysis
- 12.1. Company Profiles
- 12.1.1 Formus Labs
- 12.1.1.1. Company Overview
- 12.1.1.2. Products
- 12.1.1.3. Company Financials
- 12.1.1.4. SWOT Analysis
- 12.1.2 EOS imaging
- 12.1.2.1. Company Overview
- 12.1.2.2. Products
- 12.1.2.3. Company Financials
- 12.1.2.4. SWOT Analysis
- 12.1.3 Brainlab
- 12.1.3.1. Company Overview
- 12.1.3.2. Products
- 12.1.3.3. Company Financials
- 12.1.3.4. SWOT Analysis
- 12.1.4 Sectra
- 12.1.4.1. Company Overview
- 12.1.4.2. Products
- 12.1.4.3. Company Financials
- 12.1.4.4. SWOT Analysis
- 12.1.5 Stryker
- 12.1.5.1. Company Overview
- 12.1.5.2. Products
- 12.1.5.3. Company Financials
- 12.1.5.4. SWOT Analysis
- 12.1.6 Materialise
- 12.1.6.1. Company Overview
- 12.1.6.2. Products
- 12.1.6.3. Company Financials
- 12.1.6.4. SWOT Analysis
- 12.1.7 Medstrat
- 12.1.7.1. Company Overview
- 12.1.7.2. Products
- 12.1.7.3. Company Financials
- 12.1.7.4. SWOT Analysis
- 12.1.8 MediCAD Hectec GmbH
- 12.1.8.1. Company Overview
- 12.1.8.2. Products
- 12.1.8.3. Company Financials
- 12.1.8.4. SWOT Analysis
- 12.1.9 3D Systems
- 12.1.9.1. Company Overview
- 12.1.9.2. Products
- 12.1.9.3. Company Financials
- 12.1.9.4. SWOT Analysis
- 12.1.10 PEEK HEALTH
- 12.1.10.1. Company Overview
- 12.1.10.2. Products
- 12.1.10.3. Company Financials
- 12.1.10.4. SWOT Analysis
- 12.1.11 Radlink
- 12.1.11.1. Company Overview
- 12.1.11.2. Products
- 12.1.11.3. Company Financials
- 12.1.11.4. SWOT Analysis
- 12.1.12 SurgiNovi
- 12.1.12.1. Company Overview
- 12.1.12.2. Products
- 12.1.12.3. Company Financials
- 12.1.12.4. SWOT Analysis
- 12.1.13 RSA Biomedical
- 12.1.13.1. Company Overview
- 12.1.13.2. Products
- 12.1.13.3. Company Financials
- 12.1.13.4. SWOT Analysis
- 12.1.14 HIPOP-PLAN
- 12.1.14.1. Company Overview
- 12.1.14.2. Products
- 12.1.14.3. Company Financials
- 12.1.14.4. SWOT Analysis
- 12.1.15 Zimmer Biomet
- 12.1.15.1. Company Overview
- 12.1.15.2. Products
- 12.1.15.3. Company Financials
- 12.1.15.4. SWOT Analysis
- 12.1.16 Optinav
- 12.1.16.1. Company Overview
- 12.1.16.2. Products
- 12.1.16.3. Company Financials
- 12.1.16.4. SWOT Analysis
- 12.1.17 Enhatch
- 12.1.17.1. Company Overview
- 12.1.17.2. Products
- 12.1.17.3. Company Financials
- 12.1.17.4. SWOT Analysis
- 12.1.18 Numex GmbH
- 12.1.18.1. Company Overview
- 12.1.18.2. Products
- 12.1.18.3. Company Financials
- 12.1.18.4. SWOT Analysis
- 12.1.19 Corin Group
- 12.1.19.1. Company Overview
- 12.1.19.2. Products
- 12.1.19.3. Company Financials
- 12.1.19.4. SWOT Analysis
- 12.1.1 Formus Labs
- 12.2. Market Entropy
- 12.2.1 Company's Key Areas Served
- 12.2.2 Recent Developments
- 12.3. Company Market Share Analysis 2025
- 12.3.1 Top 5 Companies Market Share Analysis
- 12.3.2 Top 3 Companies Market Share Analysis
- 12.4. List of Potential Customers
- 13. Research Methodology
List of Figures
- Figure 1: Global Orthopedic Planning Systems Revenue Breakdown (undefined, %) by Region 2025 & 2033
- Figure 2: North America Orthopedic Planning Systems Revenue (undefined), by Application 2025 & 2033
- Figure 3: North America Orthopedic Planning Systems Revenue Share (%), by Application 2025 & 2033
- Figure 4: North America Orthopedic Planning Systems Revenue (undefined), by Types 2025 & 2033
- Figure 5: North America Orthopedic Planning Systems Revenue Share (%), by Types 2025 & 2033
- Figure 6: North America Orthopedic Planning Systems Revenue (undefined), by Country 2025 & 2033
- Figure 7: North America Orthopedic Planning Systems Revenue Share (%), by Country 2025 & 2033
- Figure 8: South America Orthopedic Planning Systems Revenue (undefined), by Application 2025 & 2033
- Figure 9: South America Orthopedic Planning Systems Revenue Share (%), by Application 2025 & 2033
- Figure 10: South America Orthopedic Planning Systems Revenue (undefined), by Types 2025 & 2033
- Figure 11: South America Orthopedic Planning Systems Revenue Share (%), by Types 2025 & 2033
- Figure 12: South America Orthopedic Planning Systems Revenue (undefined), by Country 2025 & 2033
- Figure 13: South America Orthopedic Planning Systems Revenue Share (%), by Country 2025 & 2033
- Figure 14: Europe Orthopedic Planning Systems Revenue (undefined), by Application 2025 & 2033
- Figure 15: Europe Orthopedic Planning Systems Revenue Share (%), by Application 2025 & 2033
- Figure 16: Europe Orthopedic Planning Systems Revenue (undefined), by Types 2025 & 2033
- Figure 17: Europe Orthopedic Planning Systems Revenue Share (%), by Types 2025 & 2033
- Figure 18: Europe Orthopedic Planning Systems Revenue (undefined), by Country 2025 & 2033
- Figure 19: Europe Orthopedic Planning Systems Revenue Share (%), by Country 2025 & 2033
- Figure 20: Middle East & Africa Orthopedic Planning Systems Revenue (undefined), by Application 2025 & 2033
- Figure 21: Middle East & Africa Orthopedic Planning Systems Revenue Share (%), by Application 2025 & 2033
- Figure 22: Middle East & Africa Orthopedic Planning Systems Revenue (undefined), by Types 2025 & 2033
- Figure 23: Middle East & Africa Orthopedic Planning Systems Revenue Share (%), by Types 2025 & 2033
- Figure 24: Middle East & Africa Orthopedic Planning Systems Revenue (undefined), by Country 2025 & 2033
- Figure 25: Middle East & Africa Orthopedic Planning Systems Revenue Share (%), by Country 2025 & 2033
- Figure 26: Asia Pacific Orthopedic Planning Systems Revenue (undefined), by Application 2025 & 2033
- Figure 27: Asia Pacific Orthopedic Planning Systems Revenue Share (%), by Application 2025 & 2033
- Figure 28: Asia Pacific Orthopedic Planning Systems Revenue (undefined), by Types 2025 & 2033
- Figure 29: Asia Pacific Orthopedic Planning Systems Revenue Share (%), by Types 2025 & 2033
- Figure 30: Asia Pacific Orthopedic Planning Systems Revenue (undefined), by Country 2025 & 2033
- Figure 31: Asia Pacific Orthopedic Planning Systems Revenue Share (%), by Country 2025 & 2033
List of Tables
- Table 1: Global Orthopedic Planning Systems Revenue undefined Forecast, by Application 2020 & 2033
- Table 2: Global Orthopedic Planning Systems Revenue undefined Forecast, by Types 2020 & 2033
- Table 3: Global Orthopedic Planning Systems Revenue undefined Forecast, by Region 2020 & 2033
- Table 4: Global Orthopedic Planning Systems Revenue undefined Forecast, by Application 2020 & 2033
- Table 5: Global Orthopedic Planning Systems Revenue undefined Forecast, by Types 2020 & 2033
- Table 6: Global Orthopedic Planning Systems Revenue undefined Forecast, by Country 2020 & 2033
- Table 7: United States Orthopedic Planning Systems Revenue (undefined) Forecast, by Application 2020 & 2033
- Table 8: Canada Orthopedic Planning Systems Revenue (undefined) Forecast, by Application 2020 & 2033
- Table 9: Mexico Orthopedic Planning Systems Revenue (undefined) Forecast, by Application 2020 & 2033
- Table 10: Global Orthopedic Planning Systems Revenue undefined Forecast, by Application 2020 & 2033
- Table 11: Global Orthopedic Planning Systems Revenue undefined Forecast, by Types 2020 & 2033
- Table 12: Global Orthopedic Planning Systems Revenue undefined Forecast, by Country 2020 & 2033
- Table 13: Brazil Orthopedic Planning Systems Revenue (undefined) Forecast, by Application 2020 & 2033
- Table 14: Argentina Orthopedic Planning Systems Revenue (undefined) Forecast, by Application 2020 & 2033
- Table 15: Rest of South America Orthopedic Planning Systems Revenue (undefined) Forecast, by Application 2020 & 2033
- Table 16: Global Orthopedic Planning Systems Revenue undefined Forecast, by Application 2020 & 2033
- Table 17: Global Orthopedic Planning Systems Revenue undefined Forecast, by Types 2020 & 2033
- Table 18: Global Orthopedic Planning Systems Revenue undefined Forecast, by Country 2020 & 2033
- Table 19: United Kingdom Orthopedic Planning Systems Revenue (undefined) Forecast, by Application 2020 & 2033
- Table 20: Germany Orthopedic Planning Systems Revenue (undefined) Forecast, by Application 2020 & 2033
- Table 21: France Orthopedic Planning Systems Revenue (undefined) Forecast, by Application 2020 & 2033
- Table 22: Italy Orthopedic Planning Systems Revenue (undefined) Forecast, by Application 2020 & 2033
- Table 23: Spain Orthopedic Planning Systems Revenue (undefined) Forecast, by Application 2020 & 2033
- Table 24: Russia Orthopedic Planning Systems Revenue (undefined) Forecast, by Application 2020 & 2033
- Table 25: Benelux Orthopedic Planning Systems Revenue (undefined) Forecast, by Application 2020 & 2033
- Table 26: Nordics Orthopedic Planning Systems Revenue (undefined) Forecast, by Application 2020 & 2033
- Table 27: Rest of Europe Orthopedic Planning Systems Revenue (undefined) Forecast, by Application 2020 & 2033
- Table 28: Global Orthopedic Planning Systems Revenue undefined Forecast, by Application 2020 & 2033
- Table 29: Global Orthopedic Planning Systems Revenue undefined Forecast, by Types 2020 & 2033
- Table 30: Global Orthopedic Planning Systems Revenue undefined Forecast, by Country 2020 & 2033
- Table 31: Turkey Orthopedic Planning Systems Revenue (undefined) Forecast, by Application 2020 & 2033
- Table 32: Israel Orthopedic Planning Systems Revenue (undefined) Forecast, by Application 2020 & 2033
- Table 33: GCC Orthopedic Planning Systems Revenue (undefined) Forecast, by Application 2020 & 2033
- Table 34: North Africa Orthopedic Planning Systems Revenue (undefined) Forecast, by Application 2020 & 2033
- Table 35: South Africa Orthopedic Planning Systems Revenue (undefined) Forecast, by Application 2020 & 2033
- Table 36: Rest of Middle East & Africa Orthopedic Planning Systems Revenue (undefined) Forecast, by Application 2020 & 2033
- Table 37: Global Orthopedic Planning Systems Revenue undefined Forecast, by Application 2020 & 2033
- Table 38: Global Orthopedic Planning Systems Revenue undefined Forecast, by Types 2020 & 2033
- Table 39: Global Orthopedic Planning Systems Revenue undefined Forecast, by Country 2020 & 2033
- Table 40: China Orthopedic Planning Systems Revenue (undefined) Forecast, by Application 2020 & 2033
- Table 41: India Orthopedic Planning Systems Revenue (undefined) Forecast, by Application 2020 & 2033
- Table 42: Japan Orthopedic Planning Systems Revenue (undefined) Forecast, by Application 2020 & 2033
- Table 43: South Korea Orthopedic Planning Systems Revenue (undefined) Forecast, by Application 2020 & 2033
- Table 44: ASEAN Orthopedic Planning Systems Revenue (undefined) Forecast, by Application 2020 & 2033
- Table 45: Oceania Orthopedic Planning Systems Revenue (undefined) Forecast, by Application 2020 & 2033
- Table 46: Rest of Asia Pacific Orthopedic Planning Systems Revenue (undefined) Forecast, by Application 2020 & 2033
Frequently Asked Questions
1. What is the projected Compound Annual Growth Rate (CAGR) of the Orthopedic Planning Systems?
The projected CAGR is approximately 5%.
2. Which companies are prominent players in the Orthopedic Planning Systems?
Key companies in the market include Formus Labs, EOS imaging, Brainlab, Sectra, Stryker, Materialise, Medstrat, MediCAD Hectec GmbH, 3D Systems, PEEK HEALTH, Radlink, SurgiNovi, RSA Biomedical, HIPOP-PLAN, Zimmer Biomet, Optinav, Enhatch, Numex GmbH, Corin Group.
3. What are the main segments of the Orthopedic Planning Systems?
The market segments include Application, Types.
4. Can you provide details about the market size?
The market size is estimated to be USD XXX N/A as of 2022.
5. What are some drivers contributing to market growth?
N/A
6. What are the notable trends driving market growth?
N/A
7. Are there any restraints impacting market growth?
N/A
8. Can you provide examples of recent developments in the market?
N/A
9. What pricing options are available for accessing the report?
Pricing options include single-user, multi-user, and enterprise licenses priced at USD 3950.00, USD 5925.00, and USD 7900.00 respectively.
10. Is the market size provided in terms of value or volume?
The market size is provided in terms of value, measured in N/A.
11. Are there any specific market keywords associated with the report?
Yes, the market keyword associated with the report is "Orthopedic Planning Systems," which aids in identifying and referencing the specific market segment covered.
12. How do I determine which pricing option suits my needs best?
The pricing options vary based on user requirements and access needs. Individual users may opt for single-user licenses, while businesses requiring broader access may choose multi-user or enterprise licenses for cost-effective access to the report.
13. Are there any additional resources or data provided in the Orthopedic Planning Systems report?
While the report offers comprehensive insights, it's advisable to review the specific contents or supplementary materials provided to ascertain if additional resources or data are available.
14. How can I stay updated on further developments or reports in the Orthopedic Planning Systems?
To stay informed about further developments, trends, and reports in the Orthopedic Planning Systems, consider subscribing to industry newsletters, following relevant companies and organizations, or regularly checking reputable industry news sources and publications.
Methodology
Step 1 - Identification of Relevant Samples Size from Population Database


Step 2 - Approaches for Defining Global Market Size (Value, Volume* & Price*)

Note*: In applicable scenarios
Step 3 - Data Sources
Primary Research
- Web Analytics
- Survey Reports
- Research Institute
- Latest Research Reports
- Opinion Leaders
Secondary Research
- Annual Reports
- White Paper
- Latest Press Release
- Industry Association
- Paid Database
- Investor Presentations

Step 4 - Data Triangulation
Involves using different sources of information in order to increase the validity of a study
These sources are likely to be stakeholders in a program - participants, other researchers, program staff, other community members, and so on.
Then we put all data in single framework & apply various statistical tools to find out the dynamic on the market.
During the analysis stage, feedback from the stakeholder groups would be compared to determine areas of agreement as well as areas of divergence