

Key Insights
The Online Virtual Tour market is experiencing robust growth, projected to reach $1,219.1 million by 2023, driven by an impressive CAGR of 29.3%. This significant expansion is fueled by the increasing adoption of immersive technologies across various sectors, most notably real estate and tourism. As businesses increasingly recognize the power of virtual tours to enhance customer engagement, provide remote access, and streamline decision-making processes, the demand for innovative and accessible solutions continues to surge. The market is characterized by a strong preference for cloud-based platforms, offering scalability, flexibility, and ease of integration, which aligns perfectly with the evolving digital landscape. Furthermore, the growing need for compelling marketing materials and the ability to showcase products and services in a dynamic, interactive format are key catalysts propelling market expansion.
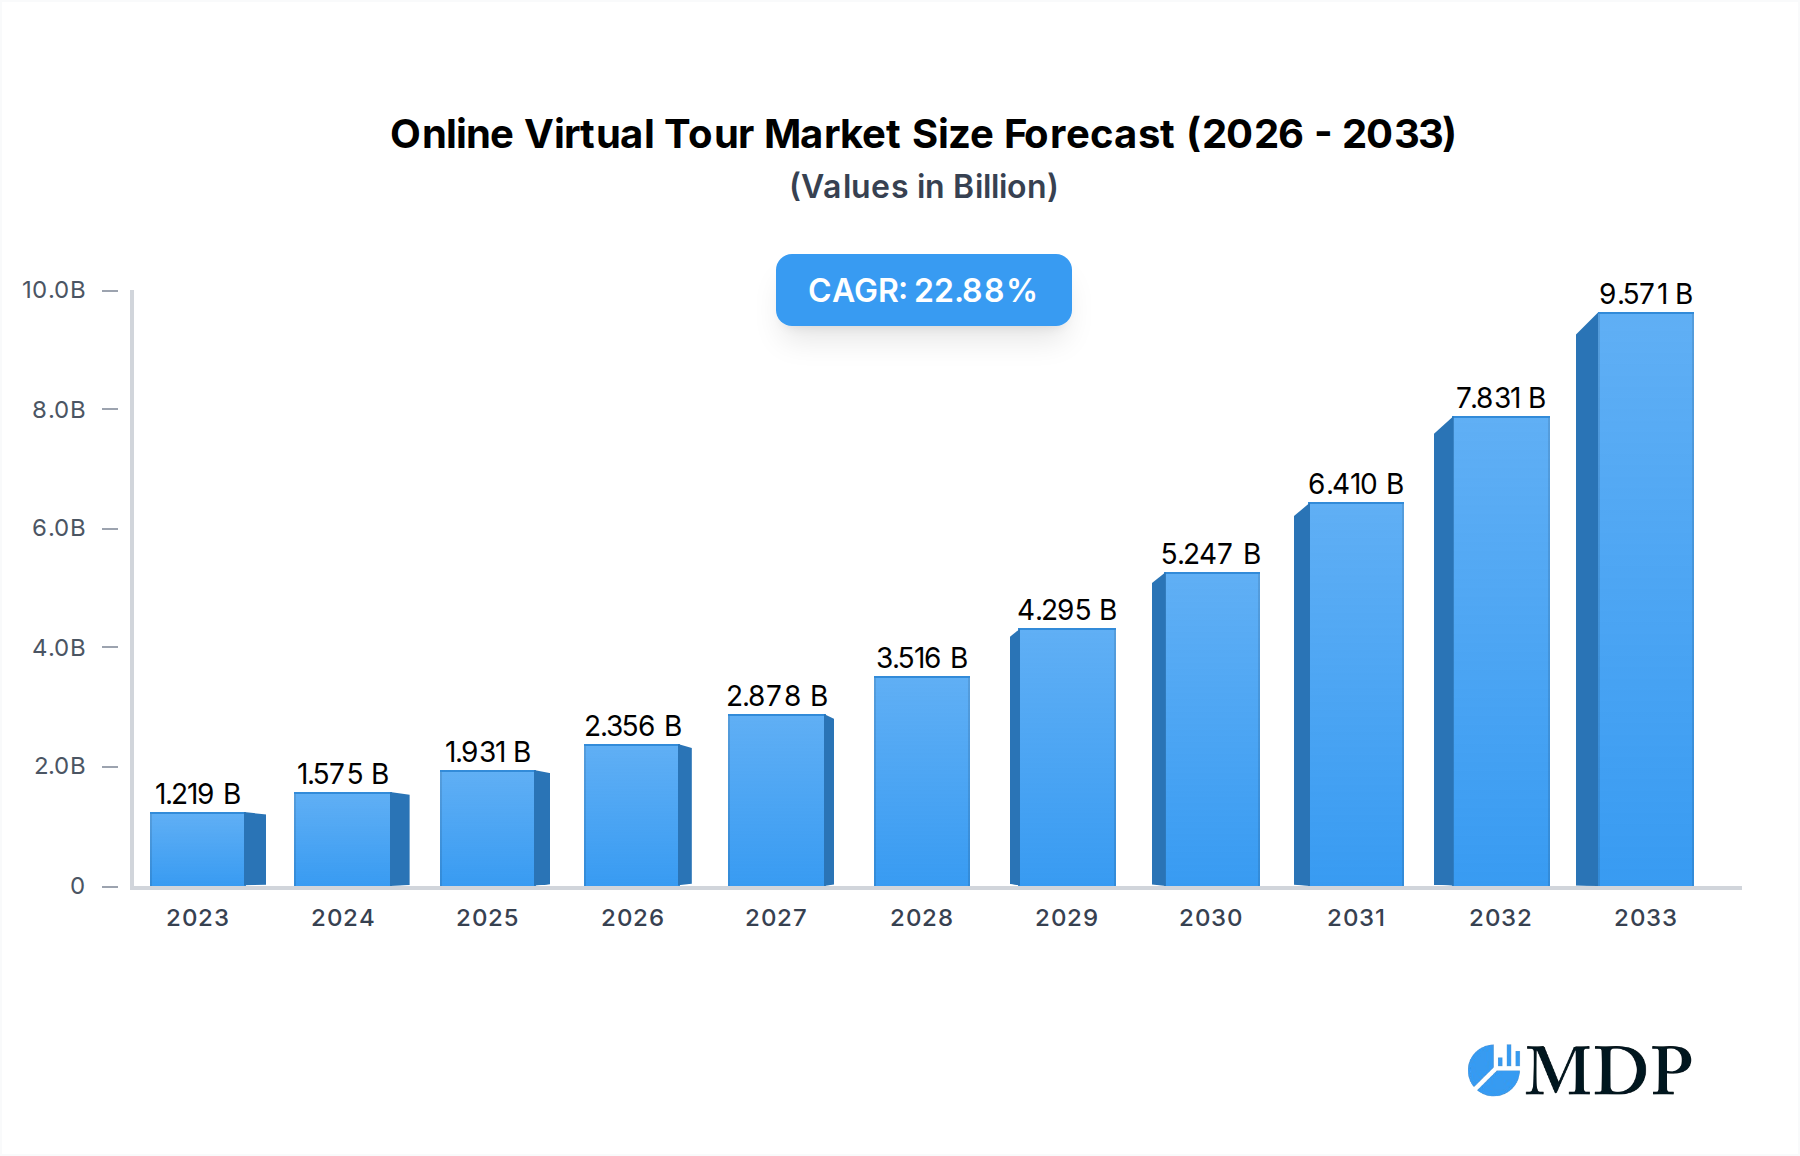
Online Virtual Tour Market Size (In Billion)
The competitive landscape is dynamic, with established players and emerging innovators vying for market share. Companies like Matterport, 3DVista, and iStaging are at the forefront, offering advanced features and catering to diverse industry needs, from sophisticated real estate walkthroughs to interactive tourism experiences. The "Others" segment, encompassing a broad range of niche applications and emerging use cases, also signifies the versatility of virtual tour technology. While the market is largely optimistic, potential restraints could include the initial investment cost for high-fidelity capture equipment and the need for skilled professionals to create and manage complex virtual environments. However, ongoing technological advancements, including improvements in AI and AR integration, are expected to mitigate these challenges, further solidifying the upward trajectory of the Online Virtual Tour market.

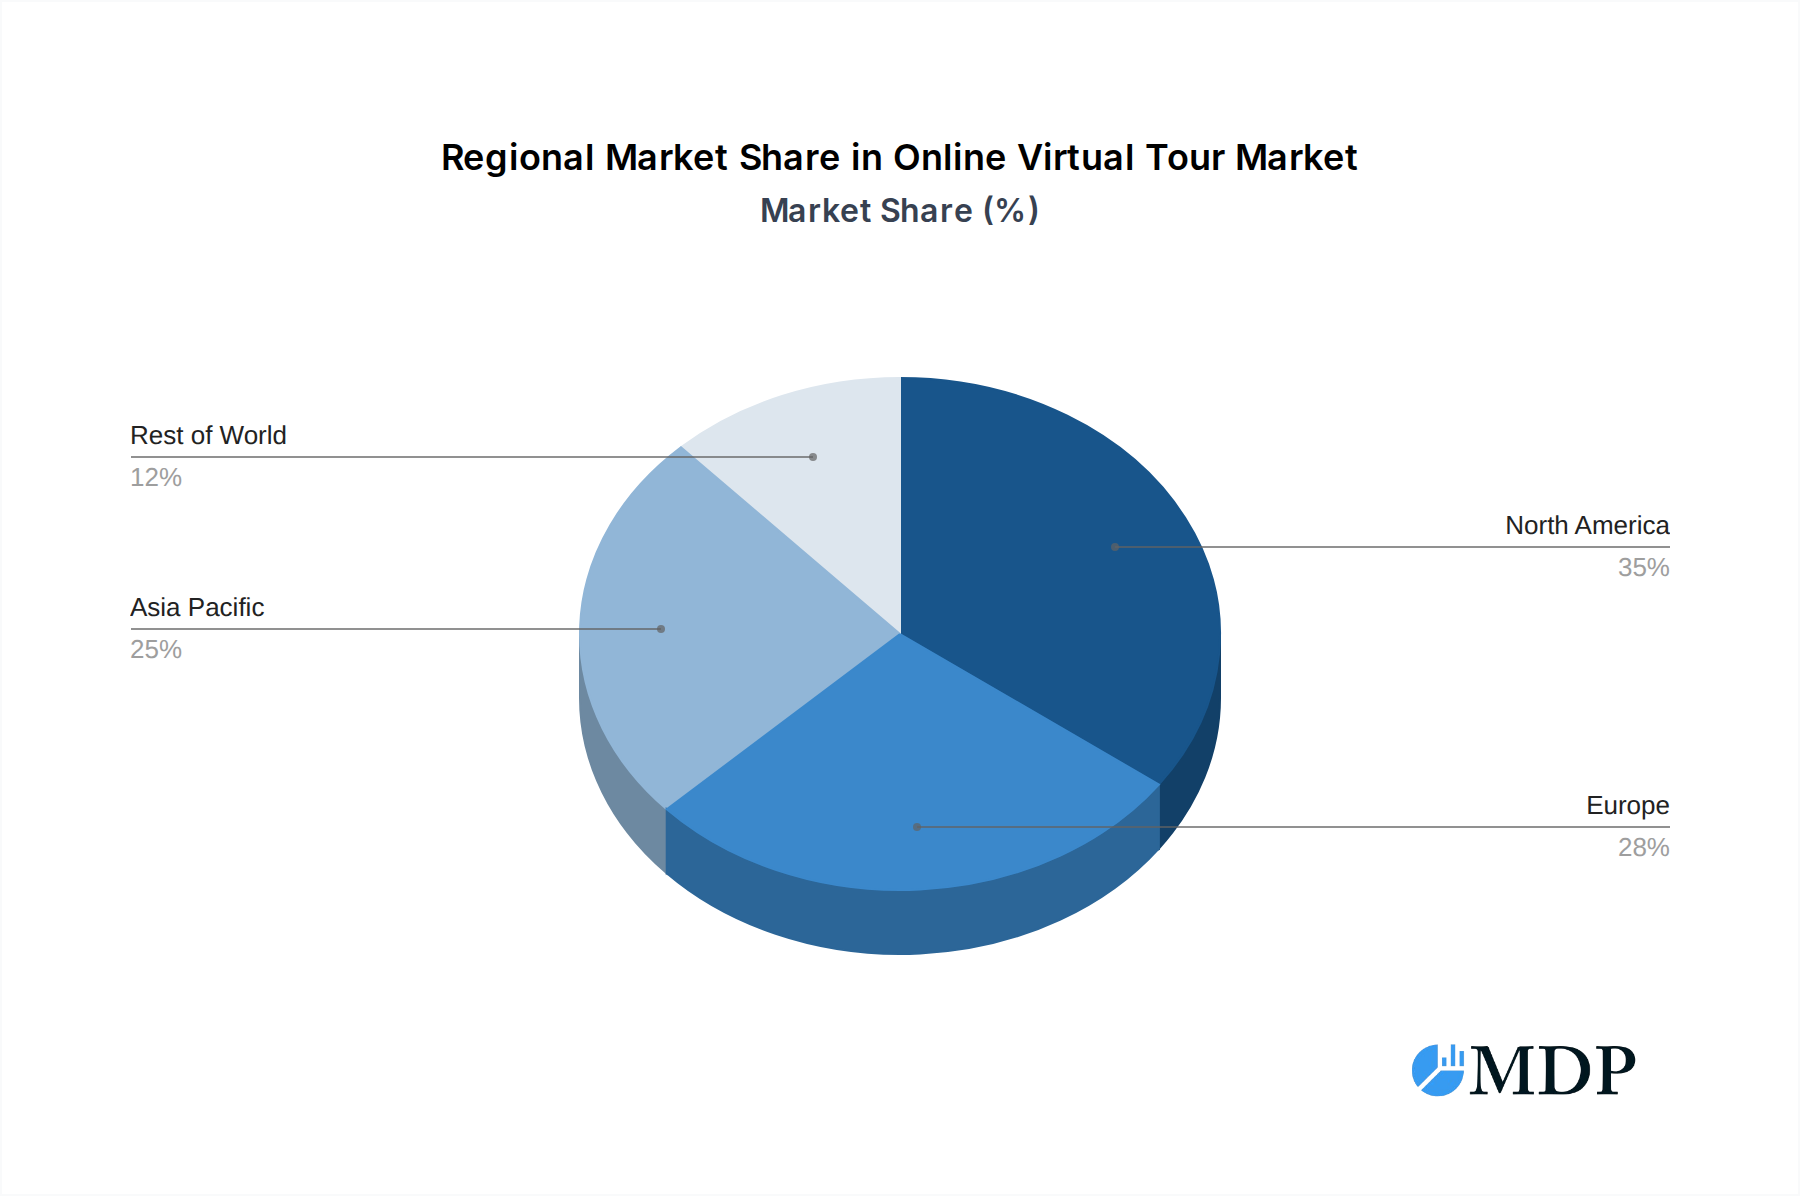
Online Virtual Tour Company Market Share
Unlock the potential of immersive experiences. This definitive report provides an in-depth analysis of the global Online Virtual Tour market, projecting significant growth and offering actionable insights for industry stakeholders. Covering market dynamics, emerging trends, leading players, and future opportunities, this report is your essential guide to navigating the rapidly evolving virtual tour landscape.
Online Virtual Tour Market Dynamics & Concentration
The global Online Virtual Tour market is characterized by a moderate to high level of concentration, with key players investing heavily in innovation and market expansion. The market’s growth is propelled by increasing demand for immersive digital experiences across various sectors. Innovation drivers include advancements in 360-degree camera technology, AI-powered virtual staging, and photogrammetry, enabling more realistic and interactive tours. Regulatory frameworks, while generally supportive of digital transformation, can present localized challenges related to data privacy and accessibility standards. Product substitutes, such as high-quality video walkthroughs and augmented reality experiences, offer alternative solutions but often lack the interactive depth of virtual tours. End-user trends indicate a growing preference for self-guided exploration and personalized content. Mergers and acquisitions (M&A) activity is on the rise as companies seek to consolidate market share, acquire complementary technologies, and expand their geographical reach. For instance, a recent M&A deal in the last quarter of 2023 involved a leading virtual tour platform acquiring a specialized 3D scanning company for an estimated value of $50 million, signifying strategic consolidation within the industry. Anticipated market share shifts will be closely watched as major players continue to innovate and expand their offerings.
- Market Concentration: Moderate to High, driven by strategic acquisitions and technological leadership.
- Innovation Drivers: AI Integration, High-Resolution Imaging, Cloud Computing, VR/AR Compatibility.
- Regulatory Frameworks: Evolving data privacy laws, accessibility standards, and content moderation policies.
- Product Substitutes: High-Definition Video Tours, 360-Degree Photos, Augmented Reality Previews.
- End-User Trends: Demand for interactive, self-guided, and customizable virtual experiences.
- M&A Activities: Increasing, with an estimated XX M&A deals in the past year, valued at over $200 million in total, focused on technology acquisition and market consolidation.
Online Virtual Tour Industry Trends & Analysis
The Online Virtual Tour industry is experiencing robust growth, driven by its transformative impact on how businesses engage with their customers. The market penetration of virtual tour solutions is rapidly increasing across sectors like real estate, tourism, and retail, as businesses recognize their efficacy in enhancing customer engagement, reducing physical site visits, and expanding global reach. The Compound Annual Growth Rate (CAGR) for the online virtual tour market is projected to be a significant XX% during the forecast period of 2025–2033. Key growth drivers include the escalating adoption of digital technologies post-pandemic, the need for cost-effective marketing and sales tools, and the increasing consumer comfort with online interactions. Technological disruptions are at the forefront, with advancements in AI enabling intelligent navigation, personalized tour paths, and automated content generation. The integration of Virtual Reality (VR) and Augmented Reality (AR) is further enhancing the immersiveness and interactivity of virtual tours, blurring the lines between physical and digital spaces. Consumer preferences are shifting towards experiences that offer rich, detailed, and engaging content, which virtual tours excel at providing. Competitive dynamics are intensifying, with established players and emerging startups vying for market dominance through feature innovation, pricing strategies, and strategic partnerships. The estimated market size is expected to reach over $20 billion by 2025 and is projected to surpass $40 billion by 2033, reflecting a sustained upward trajectory. The growing adoption by Small and Medium-sized Businesses (SMBs) further fuels this expansion, as they leverage virtual tours for competitive advantage.
Leading Markets & Segments in Online Virtual Tour
The North America region currently dominates the global Online Virtual Tour market, driven by strong economic policies, advanced technological infrastructure, and early adoption rates across key segments. The United States, in particular, leads due to its significant investments in real estate technology and digital marketing.
Application Segments:
- Real Estate Professionals: This segment holds the largest market share, with an estimated XX% of the total market value. The ability of virtual tours to showcase properties globally, reduce physical showings, and provide an immersive viewing experience for potential buyers makes them indispensable. Economic policies encouraging remote work and investment in digital property platforms further bolster this segment's dominance.
- Tourism Industries: The tourism sector is a significant growth area, with an anticipated market share of XX%. Virtual tours allow destinations, hotels, and attractions to provide interactive previews, enticing travelers and facilitating booking decisions, especially in a post-pandemic world prioritizing safe and informative travel planning. Infrastructure development supporting high-speed internet is crucial for this segment's expansion.
- Marketing Professionals: With an estimated XX% market share, marketing professionals leverage virtual tours for product demonstrations, brand storytelling, and creating engaging online campaigns. The visual appeal and interactive nature of virtual tours are highly effective for capturing consumer attention and driving engagement across various industries.
- Others: This segment, encompassing education, healthcare, and event management, is experiencing rapid growth, driven by the need for remote access and immersive digital experiences.
Types of Virtual Tours:
- Cloud Based: This type commands the largest market share, estimated at XX%. Cloud-based solutions offer scalability, accessibility, and ease of deployment, making them ideal for businesses of all sizes. Continuous investment in cloud infrastructure and robust data security measures support its dominance.
- Web Based: Web-based virtual tours are also a significant segment, with an estimated XX% market share. They are easily accessible via standard web browsers, offering a broad reach without the need for specialized software. The focus on user-friendly interfaces and seamless integration with existing websites drives their popularity.
Online Virtual Tour Product Developments
Product development in the Online Virtual Tour sector is intensely focused on enhancing realism, interactivity, and user experience. Innovations include AI-driven object recognition for providing detailed information within tours, real-time collaboration features for remote property viewings, and seamless integration with VR headsets for truly immersive exploration. Companies are developing advanced photogrammetry techniques to create highly accurate 3D models of spaces and objects, alongside sophisticated analytics dashboards that provide insights into user engagement within tours. The competitive advantage lies in offering unique functionalities such as virtual staging, interactive floor plans, and personalized tour paths.
Key Drivers of Online Virtual Tour Growth
The accelerated growth of the Online Virtual Tour market is underpinned by several key drivers. Technologically, the increasing accessibility and declining cost of high-resolution 360-degree cameras, coupled with advancements in cloud computing and AI, are making virtual tour creation and delivery more efficient and sophisticated. Economically, the demand for cost-effective marketing and sales solutions, particularly in sectors like real estate and tourism, where physical site visits can be expensive and time-consuming, is a significant catalyst. Furthermore, the growing global adoption of digitalization and the increasing comfort of consumers with online interactions, amplified by recent global events, have cemented the importance of immersive digital experiences.
Challenges in the Online Virtual Tour Market
Despite its strong growth trajectory, the Online Virtual Tour market faces several challenges. Regulatory hurdles, particularly concerning data privacy and the secure handling of client information, can impact adoption rates in certain regions. High initial investment costs for high-quality 360-degree cameras and specialized software can be a barrier for smaller businesses, although this is decreasing. Furthermore, ensuring seamless and high-quality viewing experiences across a diverse range of devices and internet speeds remains a technical challenge. Intense competitive pressures from both established players and new entrants can also impact market dynamics and profitability. Supply chain issues for specialized hardware could temporarily affect production.
Emerging Opportunities in Online Virtual Tour
Emerging opportunities in the Online Virtual Tour market are largely driven by technological breakthroughs and strategic market expansion. The integration of AI for hyper-personalization of tour experiences, offering tailored content and navigation based on individual user preferences, presents a significant growth avenue. Strategic partnerships between virtual tour providers and e-commerce platforms, or within the metaverse, offer new avenues for product visualization and immersive shopping experiences. Furthermore, expanding the application of virtual tours beyond traditional sectors into areas like industrial training, remote diagnostics, and educational simulations will unlock new market segments and revenue streams. The development of more sophisticated VR/AR integrations will further enhance user engagement.
Leading Players in the Online Virtual Tour Sector
- Matterport
- 3DVista
- IStaging
- Kolor
- Garden Gnome (Pano2VR)
- Roundme
- SeekBeak
- Easypano
- Real Tour Vision
- Concept3D
- EyeSpy360
- Panono
- Carnival
Key Milestones in Online Virtual Tour Industry
- 2019: Introduction of advanced AI algorithms for improved virtual staging and object recognition.
- 2020: Significant surge in demand driven by the global pandemic, accelerating adoption in real estate and tourism.
- 2021: Increased integration of VR headset compatibility for enhanced immersive experiences.
- 2022: Launch of cloud-based platforms with advanced analytics for user behavior tracking and ROI measurement.
- 2023: Advancements in photogrammetry leading to higher fidelity 3D model creation for virtual tours.
- Q1 2024: Strategic partnerships formed between virtual tour providers and metaverse platforms.
- Q2 2024: Introduction of collaborative virtual tour features enabling real-time interaction between users and agents.
Strategic Outlook for Online Virtual Tour Market
The strategic outlook for the Online Virtual Tour market is overwhelmingly positive, with continued innovation and market expansion poised to drive substantial growth. Key growth accelerators include the deepening integration of AI for personalized and intelligent user experiences, the expansion into emerging markets and industries such as remote education and healthcare, and the increasing adoption of VR/AR technologies that promise to revolutionize immersive engagement. Strategic partnerships and collaborations will be crucial for expanding reach and developing synergistic offerings. The market is expected to witness a sustained trend towards higher fidelity, more interactive, and data-rich virtual tour solutions, solidifying their position as an indispensable tool for businesses aiming to connect with a global audience.
Online Virtual Tour Segmentation
-
1. Application
- 1.1. Real Estate Professionals
- 1.2. Tourism Industries
- 1.3. Marketing Professionals
- 1.4. Others
-
2. Types
- 2.1. Cloud Based
- 2.2. Web Based
Online Virtual Tour Segmentation By Geography
-
1. North America
- 1.1. United States
- 1.2. Canada
- 1.3. Mexico
-
2. South America
- 2.1. Brazil
- 2.2. Argentina
- 2.3. Rest of South America
-
3. Europe
- 3.1. United Kingdom
- 3.2. Germany
- 3.3. France
- 3.4. Italy
- 3.5. Spain
- 3.6. Russia
- 3.7. Benelux
- 3.8. Nordics
- 3.9. Rest of Europe
-
4. Middle East & Africa
- 4.1. Turkey
- 4.2. Israel
- 4.3. GCC
- 4.4. North Africa
- 4.5. South Africa
- 4.6. Rest of Middle East & Africa
-
5. Asia Pacific
- 5.1. China
- 5.2. India
- 5.3. Japan
- 5.4. South Korea
- 5.5. ASEAN
- 5.6. Oceania
- 5.7. Rest of Asia Pacific
Online Virtual Tour Regional Market Share
Geographic Coverage of Online Virtual Tour
Online Virtual Tour REPORT HIGHLIGHTS
| Aspects | Details |
|---|---|
| Study Period | 2020-2034 |
| Base Year | 2025 |
| Estimated Year | 2026 |
| Forecast Period | 2026-2034 |
| Historical Period | 2020-2025 |
| Growth Rate | CAGR of 29.3% from 2020-2034 |
| Segmentation |
|
Table of Contents
- 1. Introduction
- 1.1. Research Scope
- 1.2. Market Segmentation
- 1.3. Research Methodology
- 1.4. Definitions and Assumptions
- 2. Executive Summary
- 2.1. Introduction
- 3. Market Dynamics
- 3.1. Introduction
- 3.2. Market Drivers
- 3.3. Market Restrains
- 3.4. Market Trends
- 4. Market Factor Analysis
- 4.1. Porters Five Forces
- 4.2. Supply/Value Chain
- 4.3. PESTEL analysis
- 4.4. Market Entropy
- 4.5. Patent/Trademark Analysis
- 5. Global Online Virtual Tour Analysis, Insights and Forecast, 2020-2032
- 5.1. Market Analysis, Insights and Forecast - by Application
- 5.1.1. Real Estate Professionals
- 5.1.2. Tourism Industries
- 5.1.3. Marketing Professionals
- 5.1.4. Others
- 5.2. Market Analysis, Insights and Forecast - by Types
- 5.2.1. Cloud Based
- 5.2.2. Web Based
- 5.3. Market Analysis, Insights and Forecast - by Region
- 5.3.1. North America
- 5.3.2. South America
- 5.3.3. Europe
- 5.3.4. Middle East & Africa
- 5.3.5. Asia Pacific
- 5.1. Market Analysis, Insights and Forecast - by Application
- 6. North America Online Virtual Tour Analysis, Insights and Forecast, 2020-2032
- 6.1. Market Analysis, Insights and Forecast - by Application
- 6.1.1. Real Estate Professionals
- 6.1.2. Tourism Industries
- 6.1.3. Marketing Professionals
- 6.1.4. Others
- 6.2. Market Analysis, Insights and Forecast - by Types
- 6.2.1. Cloud Based
- 6.2.2. Web Based
- 6.1. Market Analysis, Insights and Forecast - by Application
- 7. South America Online Virtual Tour Analysis, Insights and Forecast, 2020-2032
- 7.1. Market Analysis, Insights and Forecast - by Application
- 7.1.1. Real Estate Professionals
- 7.1.2. Tourism Industries
- 7.1.3. Marketing Professionals
- 7.1.4. Others
- 7.2. Market Analysis, Insights and Forecast - by Types
- 7.2.1. Cloud Based
- 7.2.2. Web Based
- 7.1. Market Analysis, Insights and Forecast - by Application
- 8. Europe Online Virtual Tour Analysis, Insights and Forecast, 2020-2032
- 8.1. Market Analysis, Insights and Forecast - by Application
- 8.1.1. Real Estate Professionals
- 8.1.2. Tourism Industries
- 8.1.3. Marketing Professionals
- 8.1.4. Others
- 8.2. Market Analysis, Insights and Forecast - by Types
- 8.2.1. Cloud Based
- 8.2.2. Web Based
- 8.1. Market Analysis, Insights and Forecast - by Application
- 9. Middle East & Africa Online Virtual Tour Analysis, Insights and Forecast, 2020-2032
- 9.1. Market Analysis, Insights and Forecast - by Application
- 9.1.1. Real Estate Professionals
- 9.1.2. Tourism Industries
- 9.1.3. Marketing Professionals
- 9.1.4. Others
- 9.2. Market Analysis, Insights and Forecast - by Types
- 9.2.1. Cloud Based
- 9.2.2. Web Based
- 9.1. Market Analysis, Insights and Forecast - by Application
- 10. Asia Pacific Online Virtual Tour Analysis, Insights and Forecast, 2020-2032
- 10.1. Market Analysis, Insights and Forecast - by Application
- 10.1.1. Real Estate Professionals
- 10.1.2. Tourism Industries
- 10.1.3. Marketing Professionals
- 10.1.4. Others
- 10.2. Market Analysis, Insights and Forecast - by Types
- 10.2.1. Cloud Based
- 10.2.2. Web Based
- 10.1. Market Analysis, Insights and Forecast - by Application
- 11. Competitive Analysis
- 11.1. Global Market Share Analysis 2025
- 11.2. Company Profiles
- 11.2.1 Matterport
- 11.2.1.1. Overview
- 11.2.1.2. Products
- 11.2.1.3. SWOT Analysis
- 11.2.1.4. Recent Developments
- 11.2.1.5. Financials (Based on Availability)
- 11.2.2 3DVista
- 11.2.2.1. Overview
- 11.2.2.2. Products
- 11.2.2.3. SWOT Analysis
- 11.2.2.4. Recent Developments
- 11.2.2.5. Financials (Based on Availability)
- 11.2.3 IStaging
- 11.2.3.1. Overview
- 11.2.3.2. Products
- 11.2.3.3. SWOT Analysis
- 11.2.3.4. Recent Developments
- 11.2.3.5. Financials (Based on Availability)
- 11.2.4 Kolor
- 11.2.4.1. Overview
- 11.2.4.2. Products
- 11.2.4.3. SWOT Analysis
- 11.2.4.4. Recent Developments
- 11.2.4.5. Financials (Based on Availability)
- 11.2.5 Garden Gnome (Pano2VR)
- 11.2.5.1. Overview
- 11.2.5.2. Products
- 11.2.5.3. SWOT Analysis
- 11.2.5.4. Recent Developments
- 11.2.5.5. Financials (Based on Availability)
- 11.2.6 Roundme
- 11.2.6.1. Overview
- 11.2.6.2. Products
- 11.2.6.3. SWOT Analysis
- 11.2.6.4. Recent Developments
- 11.2.6.5. Financials (Based on Availability)
- 11.2.7 SeekBeak
- 11.2.7.1. Overview
- 11.2.7.2. Products
- 11.2.7.3. SWOT Analysis
- 11.2.7.4. Recent Developments
- 11.2.7.5. Financials (Based on Availability)
- 11.2.8 Easypano
- 11.2.8.1. Overview
- 11.2.8.2. Products
- 11.2.8.3. SWOT Analysis
- 11.2.8.4. Recent Developments
- 11.2.8.5. Financials (Based on Availability)
- 11.2.9 Real Tour Vision
- 11.2.9.1. Overview
- 11.2.9.2. Products
- 11.2.9.3. SWOT Analysis
- 11.2.9.4. Recent Developments
- 11.2.9.5. Financials (Based on Availability)
- 11.2.10 Concept3D
- 11.2.10.1. Overview
- 11.2.10.2. Products
- 11.2.10.3. SWOT Analysis
- 11.2.10.4. Recent Developments
- 11.2.10.5. Financials (Based on Availability)
- 11.2.11 EyeSpy360
- 11.2.11.1. Overview
- 11.2.11.2. Products
- 11.2.11.3. SWOT Analysis
- 11.2.11.4. Recent Developments
- 11.2.11.5. Financials (Based on Availability)
- 11.2.12 Panono
- 11.2.12.1. Overview
- 11.2.12.2. Products
- 11.2.12.3. SWOT Analysis
- 11.2.12.4. Recent Developments
- 11.2.12.5. Financials (Based on Availability)
- 11.2.13 Carnival
- 11.2.13.1. Overview
- 11.2.13.2. Products
- 11.2.13.3. SWOT Analysis
- 11.2.13.4. Recent Developments
- 11.2.13.5. Financials (Based on Availability)
- 11.2.1 Matterport
List of Figures
- Figure 1: Global Online Virtual Tour Revenue Breakdown (undefined, %) by Region 2025 & 2033
- Figure 2: North America Online Virtual Tour Revenue (undefined), by Application 2025 & 2033
- Figure 3: North America Online Virtual Tour Revenue Share (%), by Application 2025 & 2033
- Figure 4: North America Online Virtual Tour Revenue (undefined), by Types 2025 & 2033
- Figure 5: North America Online Virtual Tour Revenue Share (%), by Types 2025 & 2033
- Figure 6: North America Online Virtual Tour Revenue (undefined), by Country 2025 & 2033
- Figure 7: North America Online Virtual Tour Revenue Share (%), by Country 2025 & 2033
- Figure 8: South America Online Virtual Tour Revenue (undefined), by Application 2025 & 2033
- Figure 9: South America Online Virtual Tour Revenue Share (%), by Application 2025 & 2033
- Figure 10: South America Online Virtual Tour Revenue (undefined), by Types 2025 & 2033
- Figure 11: South America Online Virtual Tour Revenue Share (%), by Types 2025 & 2033
- Figure 12: South America Online Virtual Tour Revenue (undefined), by Country 2025 & 2033
- Figure 13: South America Online Virtual Tour Revenue Share (%), by Country 2025 & 2033
- Figure 14: Europe Online Virtual Tour Revenue (undefined), by Application 2025 & 2033
- Figure 15: Europe Online Virtual Tour Revenue Share (%), by Application 2025 & 2033
- Figure 16: Europe Online Virtual Tour Revenue (undefined), by Types 2025 & 2033
- Figure 17: Europe Online Virtual Tour Revenue Share (%), by Types 2025 & 2033
- Figure 18: Europe Online Virtual Tour Revenue (undefined), by Country 2025 & 2033
- Figure 19: Europe Online Virtual Tour Revenue Share (%), by Country 2025 & 2033
- Figure 20: Middle East & Africa Online Virtual Tour Revenue (undefined), by Application 2025 & 2033
- Figure 21: Middle East & Africa Online Virtual Tour Revenue Share (%), by Application 2025 & 2033
- Figure 22: Middle East & Africa Online Virtual Tour Revenue (undefined), by Types 2025 & 2033
- Figure 23: Middle East & Africa Online Virtual Tour Revenue Share (%), by Types 2025 & 2033
- Figure 24: Middle East & Africa Online Virtual Tour Revenue (undefined), by Country 2025 & 2033
- Figure 25: Middle East & Africa Online Virtual Tour Revenue Share (%), by Country 2025 & 2033
- Figure 26: Asia Pacific Online Virtual Tour Revenue (undefined), by Application 2025 & 2033
- Figure 27: Asia Pacific Online Virtual Tour Revenue Share (%), by Application 2025 & 2033
- Figure 28: Asia Pacific Online Virtual Tour Revenue (undefined), by Types 2025 & 2033
- Figure 29: Asia Pacific Online Virtual Tour Revenue Share (%), by Types 2025 & 2033
- Figure 30: Asia Pacific Online Virtual Tour Revenue (undefined), by Country 2025 & 2033
- Figure 31: Asia Pacific Online Virtual Tour Revenue Share (%), by Country 2025 & 2033
List of Tables
- Table 1: Global Online Virtual Tour Revenue undefined Forecast, by Application 2020 & 2033
- Table 2: Global Online Virtual Tour Revenue undefined Forecast, by Types 2020 & 2033
- Table 3: Global Online Virtual Tour Revenue undefined Forecast, by Region 2020 & 2033
- Table 4: Global Online Virtual Tour Revenue undefined Forecast, by Application 2020 & 2033
- Table 5: Global Online Virtual Tour Revenue undefined Forecast, by Types 2020 & 2033
- Table 6: Global Online Virtual Tour Revenue undefined Forecast, by Country 2020 & 2033
- Table 7: United States Online Virtual Tour Revenue (undefined) Forecast, by Application 2020 & 2033
- Table 8: Canada Online Virtual Tour Revenue (undefined) Forecast, by Application 2020 & 2033
- Table 9: Mexico Online Virtual Tour Revenue (undefined) Forecast, by Application 2020 & 2033
- Table 10: Global Online Virtual Tour Revenue undefined Forecast, by Application 2020 & 2033
- Table 11: Global Online Virtual Tour Revenue undefined Forecast, by Types 2020 & 2033
- Table 12: Global Online Virtual Tour Revenue undefined Forecast, by Country 2020 & 2033
- Table 13: Brazil Online Virtual Tour Revenue (undefined) Forecast, by Application 2020 & 2033
- Table 14: Argentina Online Virtual Tour Revenue (undefined) Forecast, by Application 2020 & 2033
- Table 15: Rest of South America Online Virtual Tour Revenue (undefined) Forecast, by Application 2020 & 2033
- Table 16: Global Online Virtual Tour Revenue undefined Forecast, by Application 2020 & 2033
- Table 17: Global Online Virtual Tour Revenue undefined Forecast, by Types 2020 & 2033
- Table 18: Global Online Virtual Tour Revenue undefined Forecast, by Country 2020 & 2033
- Table 19: United Kingdom Online Virtual Tour Revenue (undefined) Forecast, by Application 2020 & 2033
- Table 20: Germany Online Virtual Tour Revenue (undefined) Forecast, by Application 2020 & 2033
- Table 21: France Online Virtual Tour Revenue (undefined) Forecast, by Application 2020 & 2033
- Table 22: Italy Online Virtual Tour Revenue (undefined) Forecast, by Application 2020 & 2033
- Table 23: Spain Online Virtual Tour Revenue (undefined) Forecast, by Application 2020 & 2033
- Table 24: Russia Online Virtual Tour Revenue (undefined) Forecast, by Application 2020 & 2033
- Table 25: Benelux Online Virtual Tour Revenue (undefined) Forecast, by Application 2020 & 2033
- Table 26: Nordics Online Virtual Tour Revenue (undefined) Forecast, by Application 2020 & 2033
- Table 27: Rest of Europe Online Virtual Tour Revenue (undefined) Forecast, by Application 2020 & 2033
- Table 28: Global Online Virtual Tour Revenue undefined Forecast, by Application 2020 & 2033
- Table 29: Global Online Virtual Tour Revenue undefined Forecast, by Types 2020 & 2033
- Table 30: Global Online Virtual Tour Revenue undefined Forecast, by Country 2020 & 2033
- Table 31: Turkey Online Virtual Tour Revenue (undefined) Forecast, by Application 2020 & 2033
- Table 32: Israel Online Virtual Tour Revenue (undefined) Forecast, by Application 2020 & 2033
- Table 33: GCC Online Virtual Tour Revenue (undefined) Forecast, by Application 2020 & 2033
- Table 34: North Africa Online Virtual Tour Revenue (undefined) Forecast, by Application 2020 & 2033
- Table 35: South Africa Online Virtual Tour Revenue (undefined) Forecast, by Application 2020 & 2033
- Table 36: Rest of Middle East & Africa Online Virtual Tour Revenue (undefined) Forecast, by Application 2020 & 2033
- Table 37: Global Online Virtual Tour Revenue undefined Forecast, by Application 2020 & 2033
- Table 38: Global Online Virtual Tour Revenue undefined Forecast, by Types 2020 & 2033
- Table 39: Global Online Virtual Tour Revenue undefined Forecast, by Country 2020 & 2033
- Table 40: China Online Virtual Tour Revenue (undefined) Forecast, by Application 2020 & 2033
- Table 41: India Online Virtual Tour Revenue (undefined) Forecast, by Application 2020 & 2033
- Table 42: Japan Online Virtual Tour Revenue (undefined) Forecast, by Application 2020 & 2033
- Table 43: South Korea Online Virtual Tour Revenue (undefined) Forecast, by Application 2020 & 2033
- Table 44: ASEAN Online Virtual Tour Revenue (undefined) Forecast, by Application 2020 & 2033
- Table 45: Oceania Online Virtual Tour Revenue (undefined) Forecast, by Application 2020 & 2033
- Table 46: Rest of Asia Pacific Online Virtual Tour Revenue (undefined) Forecast, by Application 2020 & 2033
Frequently Asked Questions
1. What is the projected Compound Annual Growth Rate (CAGR) of the Online Virtual Tour?
The projected CAGR is approximately 29.3%.
2. Which companies are prominent players in the Online Virtual Tour?
Key companies in the market include Matterport, 3DVista, IStaging, Kolor, Garden Gnome (Pano2VR), Roundme, SeekBeak, Easypano, Real Tour Vision, Concept3D, EyeSpy360, Panono, Carnival.
3. What are the main segments of the Online Virtual Tour?
The market segments include Application, Types.
4. Can you provide details about the market size?
The market size is estimated to be USD XXX N/A as of 2022.
5. What are some drivers contributing to market growth?
N/A
6. What are the notable trends driving market growth?
N/A
7. Are there any restraints impacting market growth?
N/A
8. Can you provide examples of recent developments in the market?
N/A
9. What pricing options are available for accessing the report?
Pricing options include single-user, multi-user, and enterprise licenses priced at USD 4900.00, USD 7350.00, and USD 9800.00 respectively.
10. Is the market size provided in terms of value or volume?
The market size is provided in terms of value, measured in N/A.
11. Are there any specific market keywords associated with the report?
Yes, the market keyword associated with the report is "Online Virtual Tour," which aids in identifying and referencing the specific market segment covered.
12. How do I determine which pricing option suits my needs best?
The pricing options vary based on user requirements and access needs. Individual users may opt for single-user licenses, while businesses requiring broader access may choose multi-user or enterprise licenses for cost-effective access to the report.
13. Are there any additional resources or data provided in the Online Virtual Tour report?
While the report offers comprehensive insights, it's advisable to review the specific contents or supplementary materials provided to ascertain if additional resources or data are available.
14. How can I stay updated on further developments or reports in the Online Virtual Tour?
To stay informed about further developments, trends, and reports in the Online Virtual Tour, consider subscribing to industry newsletters, following relevant companies and organizations, or regularly checking reputable industry news sources and publications.
Methodology
Step 1 - Identification of Relevant Samples Size from Population Database


Step 2 - Approaches for Defining Global Market Size (Value, Volume* & Price*)

Note*: In applicable scenarios
Step 3 - Data Sources
Primary Research
- Web Analytics
- Survey Reports
- Research Institute
- Latest Research Reports
- Opinion Leaders
Secondary Research
- Annual Reports
- White Paper
- Latest Press Release
- Industry Association
- Paid Database
- Investor Presentations

Step 4 - Data Triangulation
Involves using different sources of information in order to increase the validity of a study
These sources are likely to be stakeholders in a program - participants, other researchers, program staff, other community members, and so on.
Then we put all data in single framework & apply various statistical tools to find out the dynamic on the market.
During the analysis stage, feedback from the stakeholder groups would be compared to determine areas of agreement as well as areas of divergence