

Key Insights
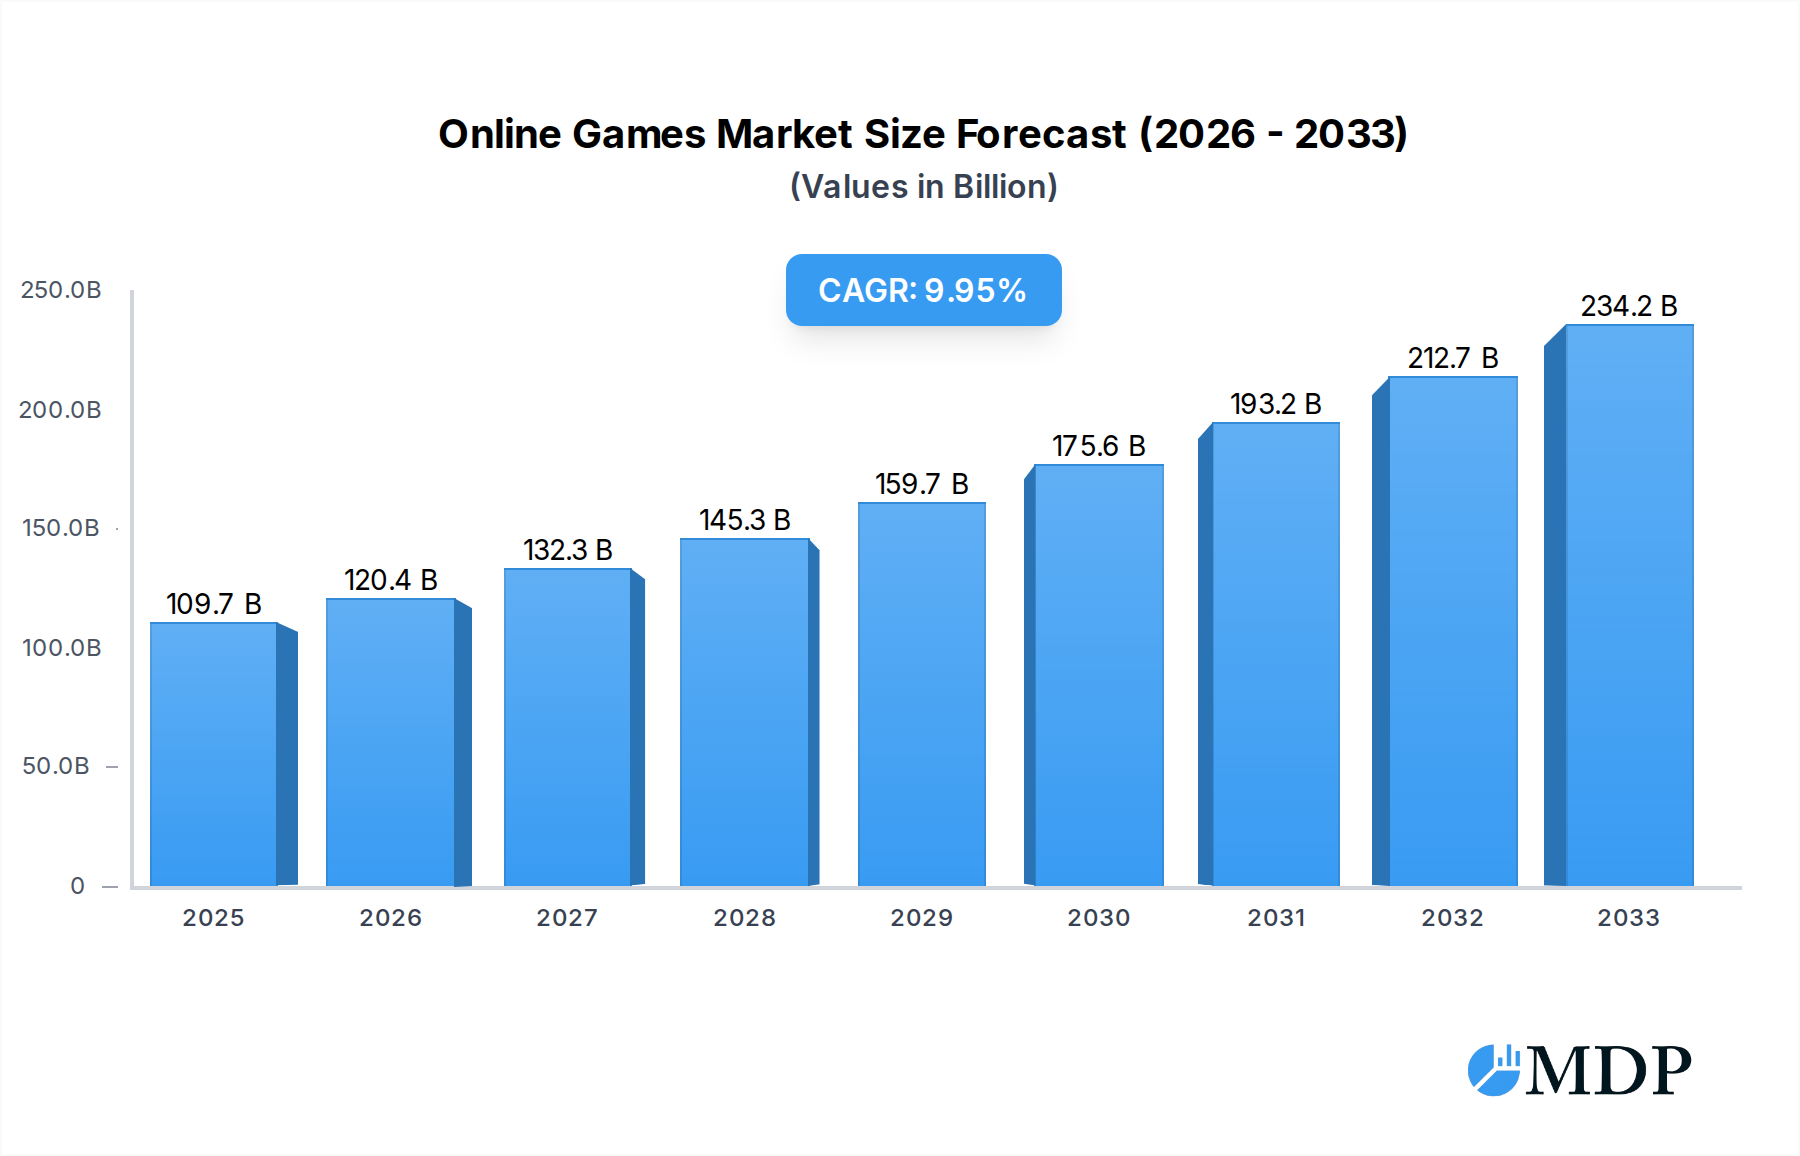
The global Online Games market is poised for substantial expansion, projected to reach an estimated $109.68 billion in 2025, with a robust Compound Annual Growth Rate (CAGR) of 9.8%. This impressive growth trajectory, spanning from 2019 to 2033, signifies a dynamic and evolving industry driven by increasing digital adoption, enhanced internet infrastructure, and a burgeoning mobile-first gaming culture. The market's expansion is fueled by a combination of factors, including the widespread accessibility of smartphones and tablets, which serve as primary gaming devices for a significant portion of the global population. Furthermore, advancements in cloud gaming technologies and the continuous innovation in game development, leading to more immersive and engaging experiences, are key drivers. The rising disposable incomes in emerging economies also contribute to increased consumer spending on online entertainment.

Online Games Market Size (In Billion)
The Online Games market is segmented across various applications, with Smartphone & Tablet gaming holding a dominant share due to its pervasive use. PCs and TVs also represent significant segments, offering different gaming experiences. Operating system-wise, iOS and Android platforms lead, reflecting the mobile-centric nature of the market. While the market benefits from these strong growth drivers, it also faces certain considerations. The competitive landscape is intense, featuring major global players like Tencent, Microsoft, Sony, and Electronic Arts, constantly vying for market share through new releases and strategic partnerships. Regulatory changes concerning in-game purchases and data privacy could also influence market dynamics. Despite these potential headwinds, the overall outlook for the online gaming industry remains exceptionally positive, driven by its ability to continuously innovate and cater to a global audience seeking interactive entertainment.
Online Games Company Market Share
Dive into the expansive universe of online gaming with this definitive report, meticulously analyzing the forces shaping one of the most dynamic and profitable sectors of the entertainment industry. From the explosive growth of mobile titles to the immersive experiences on PC and emerging platforms, this report provides unparalleled insights for stakeholders, investors, and industry professionals. With a study period spanning 2019 to 2033, a base and estimated year of 2025, and a forecast period of 2025-2033, this analysis leverages historical data from 2019-2024 to deliver a robust outlook. The global online games market is projected to reach an astounding $XXX billion by 2033, driven by innovation, expanding player bases, and evolving monetization strategies.
Online Games Market Dynamics & Concentration
The global online games market exhibits a dynamic concentration landscape, characterized by both dominant behemoths and emerging challengers. Innovation is the relentless engine driving this market, with constant advancements in graphics, gameplay mechanics, and immersive technologies like VR/AR pushing the boundaries of player engagement. Regulatory frameworks, while varied across regions, are increasingly focusing on player protection, data privacy, and fair monetization practices, impacting business models. Product substitutes, such as traditional entertainment media, face stiff competition from the accessibility and interactive nature of online games. End-user trends are overwhelmingly shifting towards social gaming, user-generated content, and cross-platform play. Mergers and acquisitions (M&A) are a significant force, with an estimated XXX billion in M&A deals recorded during the historical period and a projected XXX billion in the forecast period. Key players like Tencent and Microsoft consistently lead in market share, with Tencent holding an estimated XX% of the global market in 2025, followed closely by Netease at XX%. The number of M&A deals is estimated at XXX annually.
Online Games Industry Trends & Analysis
The online games industry is experiencing robust and sustained growth, fueled by a confluence of factors. The Compound Annual Growth Rate (CAGR) is projected to be an impressive XX% from 2025 to 2033, indicating a trajectory towards a market valuation of $XXX billion by the end of the forecast period. Technological disruptions are paramount, with the proliferation of cloud gaming services, advancements in AI for game development and player interaction, and the integration of blockchain for unique digital assets revolutionizing the gaming experience. Consumer preferences are evolving rapidly; players are demanding more engaging narratives, diverse genres, and seamless cross-platform compatibility. The rise of esports continues to be a significant market penetration driver, reaching an estimated XX% of the global population by 2025 and fostering a competitive and spectator-driven ecosystem. Monetization models are diversifying beyond traditional premium purchases to include in-game purchases, subscriptions, battle passes, and advertising, contributing to an average revenue per user (ARPU) of $XX in 2025. The competitive dynamics are characterized by intense innovation cycles, strategic partnerships, and a constant battle for player attention and retention. The increasing adoption of smartphones worldwide, coupled with widespread internet access, is a primary market growth driver.
Leading Markets & Segments in Online Games
The Smartphone & Tablet segment stands as the undisputed leader in the global online games market, driven by its unparalleled accessibility and the massive penetration of mobile devices worldwide. This segment is projected to account for an estimated XX% of the total market revenue by 2033, generating $XXX billion. The dominance is further propelled by the widespread availability of iOS and Android operating systems, catering to billions of users globally. Key drivers for this segment's supremacy include the ever-increasing power and affordability of smartphones, sophisticated mobile game development capabilities, and the inherent social connectivity offered by mobile platforms.
Application Dominance:
- Smartphone & Tablet: Expected to capture over XX% of the market by 2033, with a projected market size of $XXX billion.
- PC: Remains a significant segment, particularly for AAA titles and esports, with an estimated market size of $XXX billion by 2033.
- TV: Growing steadily with the advent of smart TVs and cloud gaming services, projected to reach $XXX billion by 2033.
- Other: Includes emerging platforms and VR/AR, with significant long-term potential, estimated at $XXX billion by 2033.
Type Dominance:
- Android: Holds a commanding lead due to its open-source nature and vast device ecosystem, expected to contribute XX% to the mobile gaming market.
- iOS: A strong contender, known for its premium user base and robust app store, contributing XX% to the mobile gaming market.
- Windows: Dominant in the PC gaming landscape, with an estimated XX% market share within the PC segment.
Economic policies favoring digital industries, robust internet infrastructure development, and a growing young demographic with a high propensity for digital entertainment are critical underlying factors contributing to the market's expansion across all segments.
Online Games Product Developments
Product innovations in the online games sector are consistently redefining player experiences. Advancements in real-time rendering, AI-driven NPCs, and procedural content generation are leading to more immersive and dynamic game worlds. The integration of cross-platform play, allowing seamless transitions between PC, console, and mobile devices, is a key competitive advantage for major titles. Furthermore, the emergence of cloud gaming platforms offers high-fidelity gaming experiences without the need for expensive hardware. Innovations in monetization models, such as the widespread adoption of battle passes and subscription services, are also reshaping how games are consumed and how developers generate revenue, fostering a constant stream of fresh content and engagement strategies.
Key Drivers of Online Games Growth
The explosive growth in the online games market is underpinned by several powerful drivers. Technologically, the widespread adoption of high-speed internet (5G and fiber optics) is enabling more complex and interactive online experiences. The continuous evolution of mobile hardware and powerful gaming consoles provides a robust platform for increasingly sophisticated games. Economically, rising disposable incomes in emerging markets are expanding the player base. Furthermore, government initiatives promoting the digital economy and favorable investment climates are accelerating market expansion. Regulatory frameworks that support innovation while ensuring player safety also contribute positively to growth. The increasing popularity of esports and the rise of influencer marketing are also significant growth accelerators.
Challenges in the Online Games Market
Despite its robust growth, the online games market faces several significant challenges. Regulatory hurdles, including evolving data privacy laws and content moderation policies in different jurisdictions, can create compliance complexities for global publishers. Supply chain issues, particularly for hardware components used in consoles and high-end PCs, can impact hardware availability and pricing. Intense competitive pressures demand continuous innovation and significant marketing investment, leading to high customer acquisition costs. Furthermore, concerns around loot boxes, microtransactions, and their potential for addiction remain a persistent challenge, requiring careful ethical considerations and potential regulatory oversight. The estimated impact of these challenges on market growth is approximately XX% in terms of lost revenue opportunities.
Emerging Opportunities in Online Games
The future of the online games market is ripe with emerging opportunities. Technological breakthroughs in virtual reality (VR) and augmented reality (AR) are poised to create entirely new immersive gaming dimensions, potentially unlocking a $XXX billion market segment by 2030. Strategic partnerships between game developers, hardware manufacturers, and content creators will foster innovative ecosystems and broaden audience reach. Market expansion into underdeveloped regions, leveraging the growing internet penetration and rising disposable incomes, presents significant untapped potential. The continued evolution of cloud gaming technology will democratize access to high-end gaming experiences, further expanding the global player base and generating an estimated $XXX billion in new revenue streams over the forecast period. The metaverse concept, while nascent, offers a long-term vision for interconnected virtual worlds with vast economic potential.
Leading Players in the Online Games Sector
- Tencent
- Netease
- Microsoft
- Sony
- Electronic Arts
- Sega
- Ubisoft
- Nintendo
- Square Enix
- Activision Blizzard Inc.
- Gameloft SA
- Glu Mobile
- Kabam
- Rovio Entertainment Ltd.
- Supercell Oy
- Zynga Inc.
- CyberAgent
- Walt Disney
- Gamevil
Key Milestones in Online Games Industry
- 2019: Release of highly anticipated titles like "Call of Duty: Modern Warfare" and "Sekiro: Shadows Die Twice," driving PC and console sales.
- 2020: Accelerated growth in mobile gaming due to global lockdowns, with titles like "Genshin Impact" achieving massive success. Cloud gaming services like Xbox Cloud Gaming and PlayStation Now expand their reach.
- 2021: Continued consolidation in the industry with major acquisitions, signaling increased market concentration. Rise of NFTs and blockchain integration explored for in-game assets.
- 2022: Continued dominance of live-service games and the growth of the esports ecosystem, with major tournaments attracting millions of viewers. Nintendo Switch continues its strong sales performance.
- 2023: Focus on cross-platform play and interoperability becoming a standard expectation for major releases. Advancements in AI and machine learning begin to influence game development and player engagement.
- 2024: Anticipation for next-generation hardware and the impact of emerging AR/VR technologies on gaming experiences. Increased scrutiny on monetization practices and player well-being.
Strategic Outlook for Online Games Market
The strategic outlook for the online games market remains exceptionally positive, driven by relentless innovation and an ever-expanding global player base. Growth accelerators include the continued democratization of gaming through cloud services, the immersive potential of VR/AR technologies, and the untapped markets in developing economies. Strategic opportunities lie in leveraging AI for personalized player experiences, fostering robust creator economies within game platforms, and developing compelling metaverse-like experiences that blend gaming with social interaction and digital commerce. The industry is poised for sustained double-digit growth, with companies that can adapt to evolving player preferences and embrace emerging technologies set to capture significant market share and redefine the future of entertainment.
Online Games Segmentation
-
1. Application
- 1.1. Smartphone & Tablet
- 1.2. PC
- 1.3. TV
- 1.4. Other
-
2. Types
- 2.1. IOS
- 2.2. Android
- 2.3. Windows
Online Games Segmentation By Geography
-
1. North America
- 1.1. United States
- 1.2. Canada
- 1.3. Mexico
-
2. South America
- 2.1. Brazil
- 2.2. Argentina
- 2.3. Rest of South America
-
3. Europe
- 3.1. United Kingdom
- 3.2. Germany
- 3.3. France
- 3.4. Italy
- 3.5. Spain
- 3.6. Russia
- 3.7. Benelux
- 3.8. Nordics
- 3.9. Rest of Europe
-
4. Middle East & Africa
- 4.1. Turkey
- 4.2. Israel
- 4.3. GCC
- 4.4. North Africa
- 4.5. South Africa
- 4.6. Rest of Middle East & Africa
-
5. Asia Pacific
- 5.1. China
- 5.2. India
- 5.3. Japan
- 5.4. South Korea
- 5.5. ASEAN
- 5.6. Oceania
- 5.7. Rest of Asia Pacific
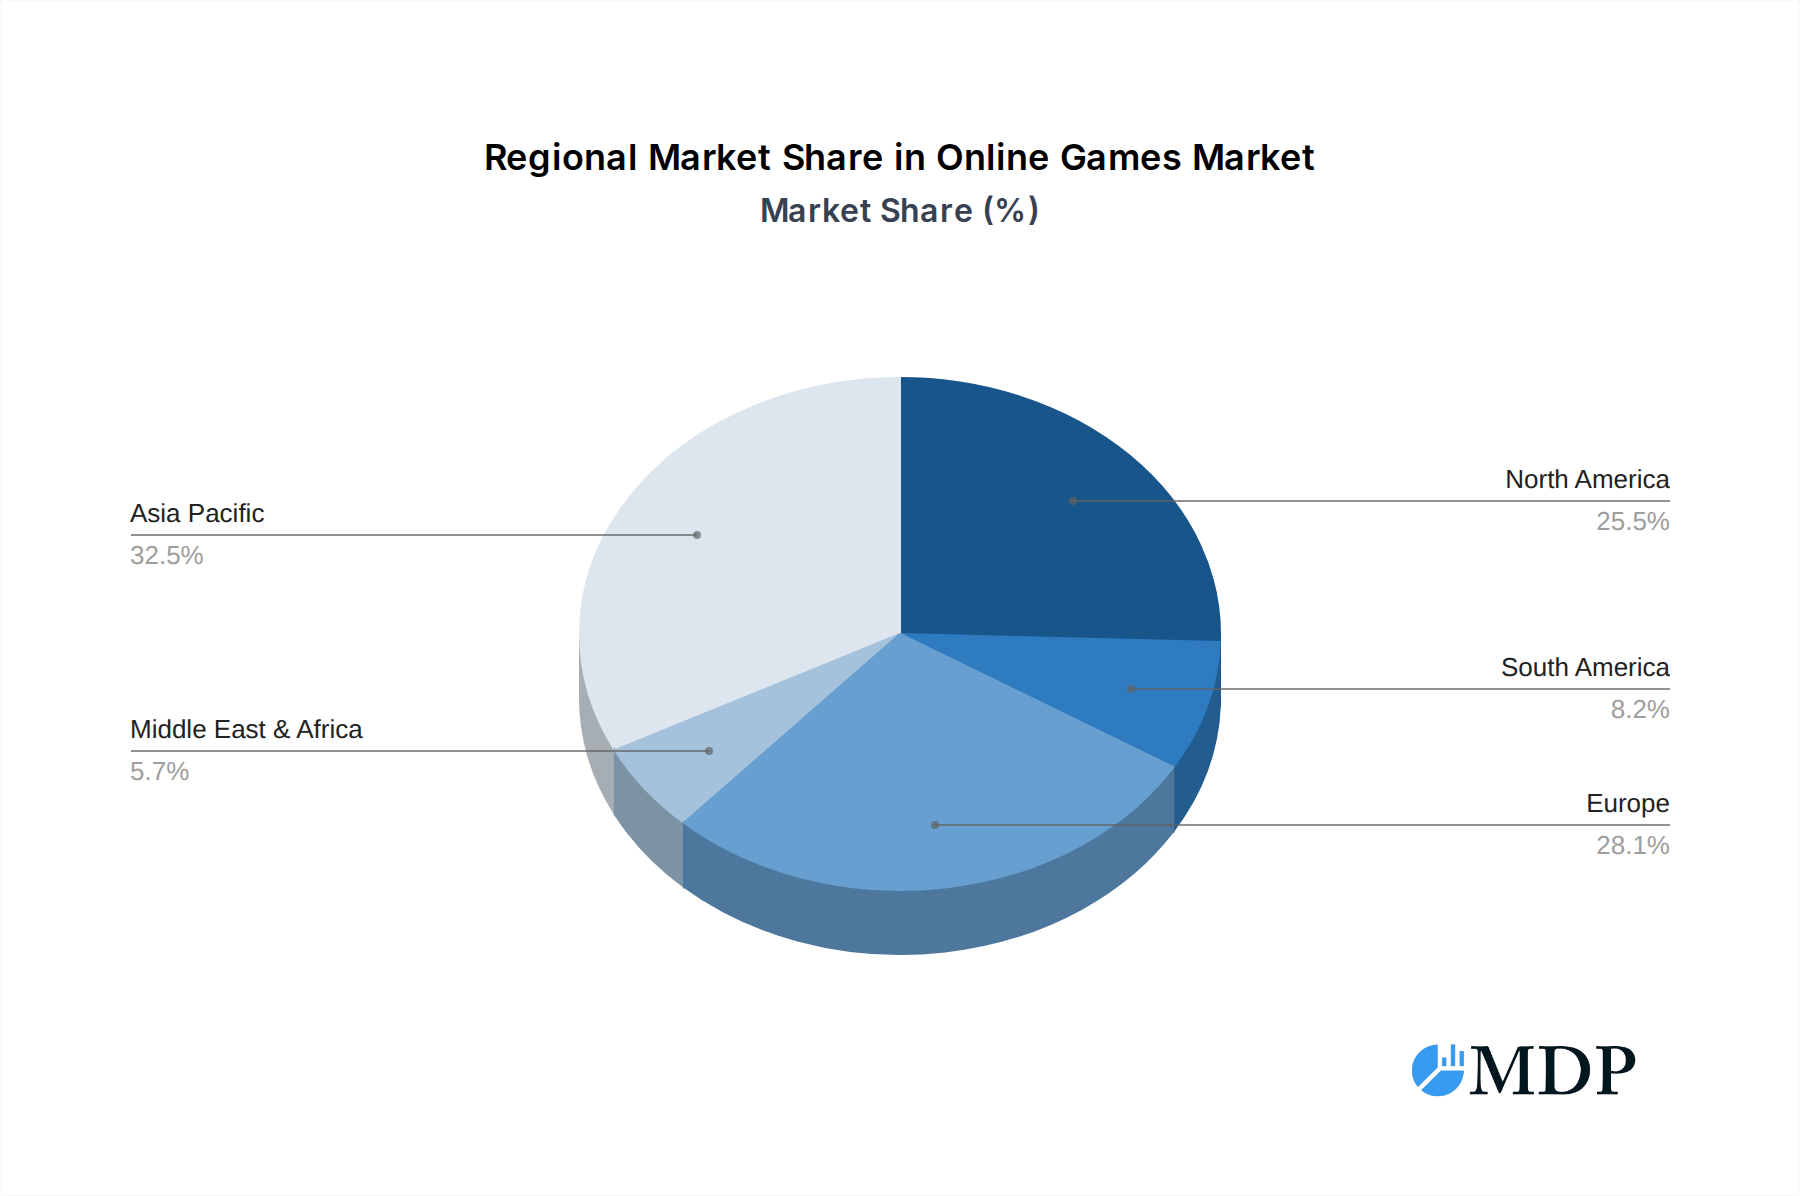
Online Games Regional Market Share
Geographic Coverage of Online Games
Online Games REPORT HIGHLIGHTS
| Aspects | Details |
|---|---|
| Study Period | 2020-2034 |
| Base Year | 2025 |
| Estimated Year | 2026 |
| Forecast Period | 2026-2034 |
| Historical Period | 2020-2025 |
| Growth Rate | CAGR of 9.8% from 2020-2034 |
| Segmentation |
|
Table of Contents
- 1. Introduction
- 1.1. Research Scope
- 1.2. Market Segmentation
- 1.3. Research Methodology
- 1.4. Definitions and Assumptions
- 2. Executive Summary
- 2.1. Introduction
- 3. Market Dynamics
- 3.1. Introduction
- 3.2. Market Drivers
- 3.3. Market Restrains
- 3.4. Market Trends
- 4. Market Factor Analysis
- 4.1. Porters Five Forces
- 4.2. Supply/Value Chain
- 4.3. PESTEL analysis
- 4.4. Market Entropy
- 4.5. Patent/Trademark Analysis
- 5. Global Online Games Analysis, Insights and Forecast, 2020-2032
- 5.1. Market Analysis, Insights and Forecast - by Application
- 5.1.1. Smartphone & Tablet
- 5.1.2. PC
- 5.1.3. TV
- 5.1.4. Other
- 5.2. Market Analysis, Insights and Forecast - by Types
- 5.2.1. IOS
- 5.2.2. Android
- 5.2.3. Windows
- 5.3. Market Analysis, Insights and Forecast - by Region
- 5.3.1. North America
- 5.3.2. South America
- 5.3.3. Europe
- 5.3.4. Middle East & Africa
- 5.3.5. Asia Pacific
- 5.1. Market Analysis, Insights and Forecast - by Application
- 6. North America Online Games Analysis, Insights and Forecast, 2020-2032
- 6.1. Market Analysis, Insights and Forecast - by Application
- 6.1.1. Smartphone & Tablet
- 6.1.2. PC
- 6.1.3. TV
- 6.1.4. Other
- 6.2. Market Analysis, Insights and Forecast - by Types
- 6.2.1. IOS
- 6.2.2. Android
- 6.2.3. Windows
- 6.1. Market Analysis, Insights and Forecast - by Application
- 7. South America Online Games Analysis, Insights and Forecast, 2020-2032
- 7.1. Market Analysis, Insights and Forecast - by Application
- 7.1.1. Smartphone & Tablet
- 7.1.2. PC
- 7.1.3. TV
- 7.1.4. Other
- 7.2. Market Analysis, Insights and Forecast - by Types
- 7.2.1. IOS
- 7.2.2. Android
- 7.2.3. Windows
- 7.1. Market Analysis, Insights and Forecast - by Application
- 8. Europe Online Games Analysis, Insights and Forecast, 2020-2032
- 8.1. Market Analysis, Insights and Forecast - by Application
- 8.1.1. Smartphone & Tablet
- 8.1.2. PC
- 8.1.3. TV
- 8.1.4. Other
- 8.2. Market Analysis, Insights and Forecast - by Types
- 8.2.1. IOS
- 8.2.2. Android
- 8.2.3. Windows
- 8.1. Market Analysis, Insights and Forecast - by Application
- 9. Middle East & Africa Online Games Analysis, Insights and Forecast, 2020-2032
- 9.1. Market Analysis, Insights and Forecast - by Application
- 9.1.1. Smartphone & Tablet
- 9.1.2. PC
- 9.1.3. TV
- 9.1.4. Other
- 9.2. Market Analysis, Insights and Forecast - by Types
- 9.2.1. IOS
- 9.2.2. Android
- 9.2.3. Windows
- 9.1. Market Analysis, Insights and Forecast - by Application
- 10. Asia Pacific Online Games Analysis, Insights and Forecast, 2020-2032
- 10.1. Market Analysis, Insights and Forecast - by Application
- 10.1.1. Smartphone & Tablet
- 10.1.2. PC
- 10.1.3. TV
- 10.1.4. Other
- 10.2. Market Analysis, Insights and Forecast - by Types
- 10.2.1. IOS
- 10.2.2. Android
- 10.2.3. Windows
- 10.1. Market Analysis, Insights and Forecast - by Application
- 11. Competitive Analysis
- 11.1. Global Market Share Analysis 2025
- 11.2. Company Profiles
- 11.2.1 Tencent
- 11.2.1.1. Overview
- 11.2.1.2. Products
- 11.2.1.3. SWOT Analysis
- 11.2.1.4. Recent Developments
- 11.2.1.5. Financials (Based on Availability)
- 11.2.2 Netease
- 11.2.2.1. Overview
- 11.2.2.2. Products
- 11.2.2.3. SWOT Analysis
- 11.2.2.4. Recent Developments
- 11.2.2.5. Financials (Based on Availability)
- 11.2.3 Microsoft
- 11.2.3.1. Overview
- 11.2.3.2. Products
- 11.2.3.3. SWOT Analysis
- 11.2.3.4. Recent Developments
- 11.2.3.5. Financials (Based on Availability)
- 11.2.4 Sony
- 11.2.4.1. Overview
- 11.2.4.2. Products
- 11.2.4.3. SWOT Analysis
- 11.2.4.4. Recent Developments
- 11.2.4.5. Financials (Based on Availability)
- 11.2.5 Electronic Arts
- 11.2.5.1. Overview
- 11.2.5.2. Products
- 11.2.5.3. SWOT Analysis
- 11.2.5.4. Recent Developments
- 11.2.5.5. Financials (Based on Availability)
- 11.2.6 Sega
- 11.2.6.1. Overview
- 11.2.6.2. Products
- 11.2.6.3. SWOT Analysis
- 11.2.6.4. Recent Developments
- 11.2.6.5. Financials (Based on Availability)
- 11.2.7 Ubisoft
- 11.2.7.1. Overview
- 11.2.7.2. Products
- 11.2.7.3. SWOT Analysis
- 11.2.7.4. Recent Developments
- 11.2.7.5. Financials (Based on Availability)
- 11.2.8 Nintendo
- 11.2.8.1. Overview
- 11.2.8.2. Products
- 11.2.8.3. SWOT Analysis
- 11.2.8.4. Recent Developments
- 11.2.8.5. Financials (Based on Availability)
- 11.2.9 Square Enix
- 11.2.9.1. Overview
- 11.2.9.2. Products
- 11.2.9.3. SWOT Analysis
- 11.2.9.4. Recent Developments
- 11.2.9.5. Financials (Based on Availability)
- 11.2.10 Activision Blizzard Inc.
- 11.2.10.1. Overview
- 11.2.10.2. Products
- 11.2.10.3. SWOT Analysis
- 11.2.10.4. Recent Developments
- 11.2.10.5. Financials (Based on Availability)
- 11.2.11 Gameloft SA
- 11.2.11.1. Overview
- 11.2.11.2. Products
- 11.2.11.3. SWOT Analysis
- 11.2.11.4. Recent Developments
- 11.2.11.5. Financials (Based on Availability)
- 11.2.12 Glu Mobile
- 11.2.12.1. Overview
- 11.2.12.2. Products
- 11.2.12.3. SWOT Analysis
- 11.2.12.4. Recent Developments
- 11.2.12.5. Financials (Based on Availability)
- 11.2.13 Kabam
- 11.2.13.1. Overview
- 11.2.13.2. Products
- 11.2.13.3. SWOT Analysis
- 11.2.13.4. Recent Developments
- 11.2.13.5. Financials (Based on Availability)
- 11.2.14 Rovio Entertainment Ltd.
- 11.2.14.1. Overview
- 11.2.14.2. Products
- 11.2.14.3. SWOT Analysis
- 11.2.14.4. Recent Developments
- 11.2.14.5. Financials (Based on Availability)
- 11.2.15 Supercell Oy
- 11.2.15.1. Overview
- 11.2.15.2. Products
- 11.2.15.3. SWOT Analysis
- 11.2.15.4. Recent Developments
- 11.2.15.5. Financials (Based on Availability)
- 11.2.16 Zynga Inc.
- 11.2.16.1. Overview
- 11.2.16.2. Products
- 11.2.16.3. SWOT Analysis
- 11.2.16.4. Recent Developments
- 11.2.16.5. Financials (Based on Availability)
- 11.2.17 CyberAgent
- 11.2.17.1. Overview
- 11.2.17.2. Products
- 11.2.17.3. SWOT Analysis
- 11.2.17.4. Recent Developments
- 11.2.17.5. Financials (Based on Availability)
- 11.2.18 Walt Disney
- 11.2.18.1. Overview
- 11.2.18.2. Products
- 11.2.18.3. SWOT Analysis
- 11.2.18.4. Recent Developments
- 11.2.18.5. Financials (Based on Availability)
- 11.2.19 Gamevil
- 11.2.19.1. Overview
- 11.2.19.2. Products
- 11.2.19.3. SWOT Analysis
- 11.2.19.4. Recent Developments
- 11.2.19.5. Financials (Based on Availability)
- 11.2.1 Tencent
List of Figures
- Figure 1: Global Online Games Revenue Breakdown (billion, %) by Region 2025 & 2033
- Figure 2: North America Online Games Revenue (billion), by Application 2025 & 2033
- Figure 3: North America Online Games Revenue Share (%), by Application 2025 & 2033
- Figure 4: North America Online Games Revenue (billion), by Types 2025 & 2033
- Figure 5: North America Online Games Revenue Share (%), by Types 2025 & 2033
- Figure 6: North America Online Games Revenue (billion), by Country 2025 & 2033
- Figure 7: North America Online Games Revenue Share (%), by Country 2025 & 2033
- Figure 8: South America Online Games Revenue (billion), by Application 2025 & 2033
- Figure 9: South America Online Games Revenue Share (%), by Application 2025 & 2033
- Figure 10: South America Online Games Revenue (billion), by Types 2025 & 2033
- Figure 11: South America Online Games Revenue Share (%), by Types 2025 & 2033
- Figure 12: South America Online Games Revenue (billion), by Country 2025 & 2033
- Figure 13: South America Online Games Revenue Share (%), by Country 2025 & 2033
- Figure 14: Europe Online Games Revenue (billion), by Application 2025 & 2033
- Figure 15: Europe Online Games Revenue Share (%), by Application 2025 & 2033
- Figure 16: Europe Online Games Revenue (billion), by Types 2025 & 2033
- Figure 17: Europe Online Games Revenue Share (%), by Types 2025 & 2033
- Figure 18: Europe Online Games Revenue (billion), by Country 2025 & 2033
- Figure 19: Europe Online Games Revenue Share (%), by Country 2025 & 2033
- Figure 20: Middle East & Africa Online Games Revenue (billion), by Application 2025 & 2033
- Figure 21: Middle East & Africa Online Games Revenue Share (%), by Application 2025 & 2033
- Figure 22: Middle East & Africa Online Games Revenue (billion), by Types 2025 & 2033
- Figure 23: Middle East & Africa Online Games Revenue Share (%), by Types 2025 & 2033
- Figure 24: Middle East & Africa Online Games Revenue (billion), by Country 2025 & 2033
- Figure 25: Middle East & Africa Online Games Revenue Share (%), by Country 2025 & 2033
- Figure 26: Asia Pacific Online Games Revenue (billion), by Application 2025 & 2033
- Figure 27: Asia Pacific Online Games Revenue Share (%), by Application 2025 & 2033
- Figure 28: Asia Pacific Online Games Revenue (billion), by Types 2025 & 2033
- Figure 29: Asia Pacific Online Games Revenue Share (%), by Types 2025 & 2033
- Figure 30: Asia Pacific Online Games Revenue (billion), by Country 2025 & 2033
- Figure 31: Asia Pacific Online Games Revenue Share (%), by Country 2025 & 2033
List of Tables
- Table 1: Global Online Games Revenue billion Forecast, by Application 2020 & 2033
- Table 2: Global Online Games Revenue billion Forecast, by Types 2020 & 2033
- Table 3: Global Online Games Revenue billion Forecast, by Region 2020 & 2033
- Table 4: Global Online Games Revenue billion Forecast, by Application 2020 & 2033
- Table 5: Global Online Games Revenue billion Forecast, by Types 2020 & 2033
- Table 6: Global Online Games Revenue billion Forecast, by Country 2020 & 2033
- Table 7: United States Online Games Revenue (billion) Forecast, by Application 2020 & 2033
- Table 8: Canada Online Games Revenue (billion) Forecast, by Application 2020 & 2033
- Table 9: Mexico Online Games Revenue (billion) Forecast, by Application 2020 & 2033
- Table 10: Global Online Games Revenue billion Forecast, by Application 2020 & 2033
- Table 11: Global Online Games Revenue billion Forecast, by Types 2020 & 2033
- Table 12: Global Online Games Revenue billion Forecast, by Country 2020 & 2033
- Table 13: Brazil Online Games Revenue (billion) Forecast, by Application 2020 & 2033
- Table 14: Argentina Online Games Revenue (billion) Forecast, by Application 2020 & 2033
- Table 15: Rest of South America Online Games Revenue (billion) Forecast, by Application 2020 & 2033
- Table 16: Global Online Games Revenue billion Forecast, by Application 2020 & 2033
- Table 17: Global Online Games Revenue billion Forecast, by Types 2020 & 2033
- Table 18: Global Online Games Revenue billion Forecast, by Country 2020 & 2033
- Table 19: United Kingdom Online Games Revenue (billion) Forecast, by Application 2020 & 2033
- Table 20: Germany Online Games Revenue (billion) Forecast, by Application 2020 & 2033
- Table 21: France Online Games Revenue (billion) Forecast, by Application 2020 & 2033
- Table 22: Italy Online Games Revenue (billion) Forecast, by Application 2020 & 2033
- Table 23: Spain Online Games Revenue (billion) Forecast, by Application 2020 & 2033
- Table 24: Russia Online Games Revenue (billion) Forecast, by Application 2020 & 2033
- Table 25: Benelux Online Games Revenue (billion) Forecast, by Application 2020 & 2033
- Table 26: Nordics Online Games Revenue (billion) Forecast, by Application 2020 & 2033
- Table 27: Rest of Europe Online Games Revenue (billion) Forecast, by Application 2020 & 2033
- Table 28: Global Online Games Revenue billion Forecast, by Application 2020 & 2033
- Table 29: Global Online Games Revenue billion Forecast, by Types 2020 & 2033
- Table 30: Global Online Games Revenue billion Forecast, by Country 2020 & 2033
- Table 31: Turkey Online Games Revenue (billion) Forecast, by Application 2020 & 2033
- Table 32: Israel Online Games Revenue (billion) Forecast, by Application 2020 & 2033
- Table 33: GCC Online Games Revenue (billion) Forecast, by Application 2020 & 2033
- Table 34: North Africa Online Games Revenue (billion) Forecast, by Application 2020 & 2033
- Table 35: South Africa Online Games Revenue (billion) Forecast, by Application 2020 & 2033
- Table 36: Rest of Middle East & Africa Online Games Revenue (billion) Forecast, by Application 2020 & 2033
- Table 37: Global Online Games Revenue billion Forecast, by Application 2020 & 2033
- Table 38: Global Online Games Revenue billion Forecast, by Types 2020 & 2033
- Table 39: Global Online Games Revenue billion Forecast, by Country 2020 & 2033
- Table 40: China Online Games Revenue (billion) Forecast, by Application 2020 & 2033
- Table 41: India Online Games Revenue (billion) Forecast, by Application 2020 & 2033
- Table 42: Japan Online Games Revenue (billion) Forecast, by Application 2020 & 2033
- Table 43: South Korea Online Games Revenue (billion) Forecast, by Application 2020 & 2033
- Table 44: ASEAN Online Games Revenue (billion) Forecast, by Application 2020 & 2033
- Table 45: Oceania Online Games Revenue (billion) Forecast, by Application 2020 & 2033
- Table 46: Rest of Asia Pacific Online Games Revenue (billion) Forecast, by Application 2020 & 2033
Frequently Asked Questions
1. What is the projected Compound Annual Growth Rate (CAGR) of the Online Games?
The projected CAGR is approximately 9.8%.
2. Which companies are prominent players in the Online Games?
Key companies in the market include Tencent, Netease, Microsoft, Sony, Electronic Arts, Sega, Ubisoft, Nintendo, Square Enix, Activision Blizzard Inc., Gameloft SA, Glu Mobile, Kabam, Rovio Entertainment Ltd., Supercell Oy, Zynga Inc., CyberAgent, Walt Disney, Gamevil.
3. What are the main segments of the Online Games?
The market segments include Application, Types.
4. Can you provide details about the market size?
The market size is estimated to be USD 109.68 billion as of 2022.
5. What are some drivers contributing to market growth?
N/A
6. What are the notable trends driving market growth?
N/A
7. Are there any restraints impacting market growth?
N/A
8. Can you provide examples of recent developments in the market?
N/A
9. What pricing options are available for accessing the report?
Pricing options include single-user, multi-user, and enterprise licenses priced at USD 3350.00, USD 5025.00, and USD 6700.00 respectively.
10. Is the market size provided in terms of value or volume?
The market size is provided in terms of value, measured in billion.
11. Are there any specific market keywords associated with the report?
Yes, the market keyword associated with the report is "Online Games," which aids in identifying and referencing the specific market segment covered.
12. How do I determine which pricing option suits my needs best?
The pricing options vary based on user requirements and access needs. Individual users may opt for single-user licenses, while businesses requiring broader access may choose multi-user or enterprise licenses for cost-effective access to the report.
13. Are there any additional resources or data provided in the Online Games report?
While the report offers comprehensive insights, it's advisable to review the specific contents or supplementary materials provided to ascertain if additional resources or data are available.
14. How can I stay updated on further developments or reports in the Online Games?
To stay informed about further developments, trends, and reports in the Online Games, consider subscribing to industry newsletters, following relevant companies and organizations, or regularly checking reputable industry news sources and publications.
Methodology
Step 1 - Identification of Relevant Samples Size from Population Database


Step 2 - Approaches for Defining Global Market Size (Value, Volume* & Price*)

Note*: In applicable scenarios
Step 3 - Data Sources
Primary Research
- Web Analytics
- Survey Reports
- Research Institute
- Latest Research Reports
- Opinion Leaders
Secondary Research
- Annual Reports
- White Paper
- Latest Press Release
- Industry Association
- Paid Database
- Investor Presentations

Step 4 - Data Triangulation
Involves using different sources of information in order to increase the validity of a study
These sources are likely to be stakeholders in a program - participants, other researchers, program staff, other community members, and so on.
Then we put all data in single framework & apply various statistical tools to find out the dynamic on the market.
During the analysis stage, feedback from the stakeholder groups would be compared to determine areas of agreement as well as areas of divergence