

Key Insights
The global online casino market is poised for substantial growth, projected to reach an impressive $21.45 billion by 2025. This expansion is fueled by a robust Compound Annual Growth Rate (CAGR) of 12.2%, indicating a dynamic and rapidly evolving industry. Key drivers for this surge include the increasing accessibility of high-speed internet and mobile devices, enabling a more convenient and widespread gaming experience. Furthermore, advancements in technology, such as enhanced graphics, immersive live dealer options, and innovative game development, are attracting a broader demographic. The younger demographic, specifically the 18-29 and 30-39 age groups, are significant contributors to this growth, demonstrating a strong affinity for digital entertainment platforms. The convenience of web-based and download-based casinos continues to cater to diverse user preferences, while the rise of live-based casinos offers a more authentic and engaging social gaming experience, mirroring the appeal of traditional brick-and-mortar establishments.
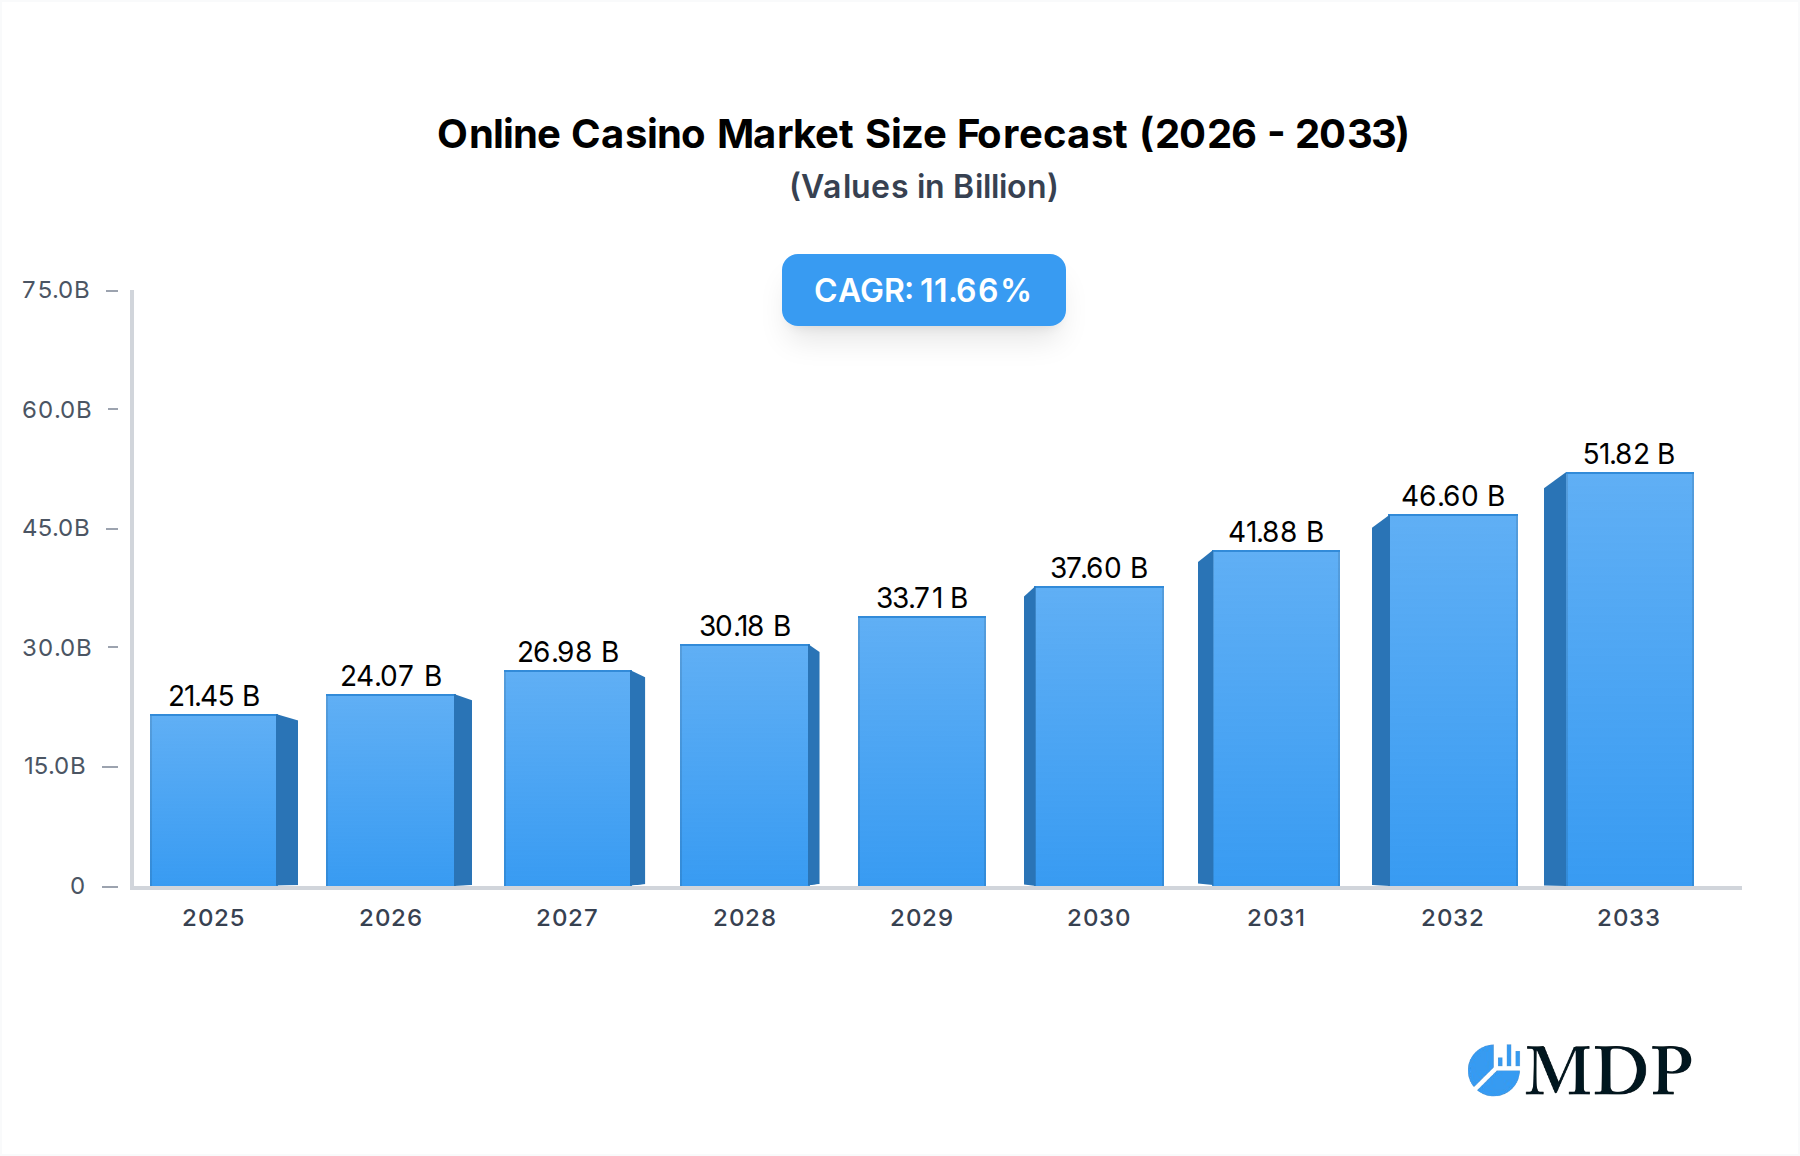
Online Casino Market Size (In Billion)
Despite the optimistic outlook, the market faces certain restraints that could influence its trajectory. Regulatory complexities and varying legal frameworks across different regions can pose challenges to market expansion and operational efficiency for key players like Bet365, Flutter Entertainment, and Kindred Group. Cybersecurity concerns and the need for robust player protection measures are also paramount, requiring continuous investment and adaptation. However, the industry's ability to innovate and adapt to these challenges, coupled with strong consumer demand for accessible and engaging entertainment, suggests a resilient and promising future. The market is characterized by intense competition among established giants and emerging players, pushing for continuous product development and customer acquisition strategies. Regions like Europe and North America are currently leading the market, but the Asia Pacific and South America regions are showing significant potential for future growth, driven by increasing internet penetration and a growing middle class.

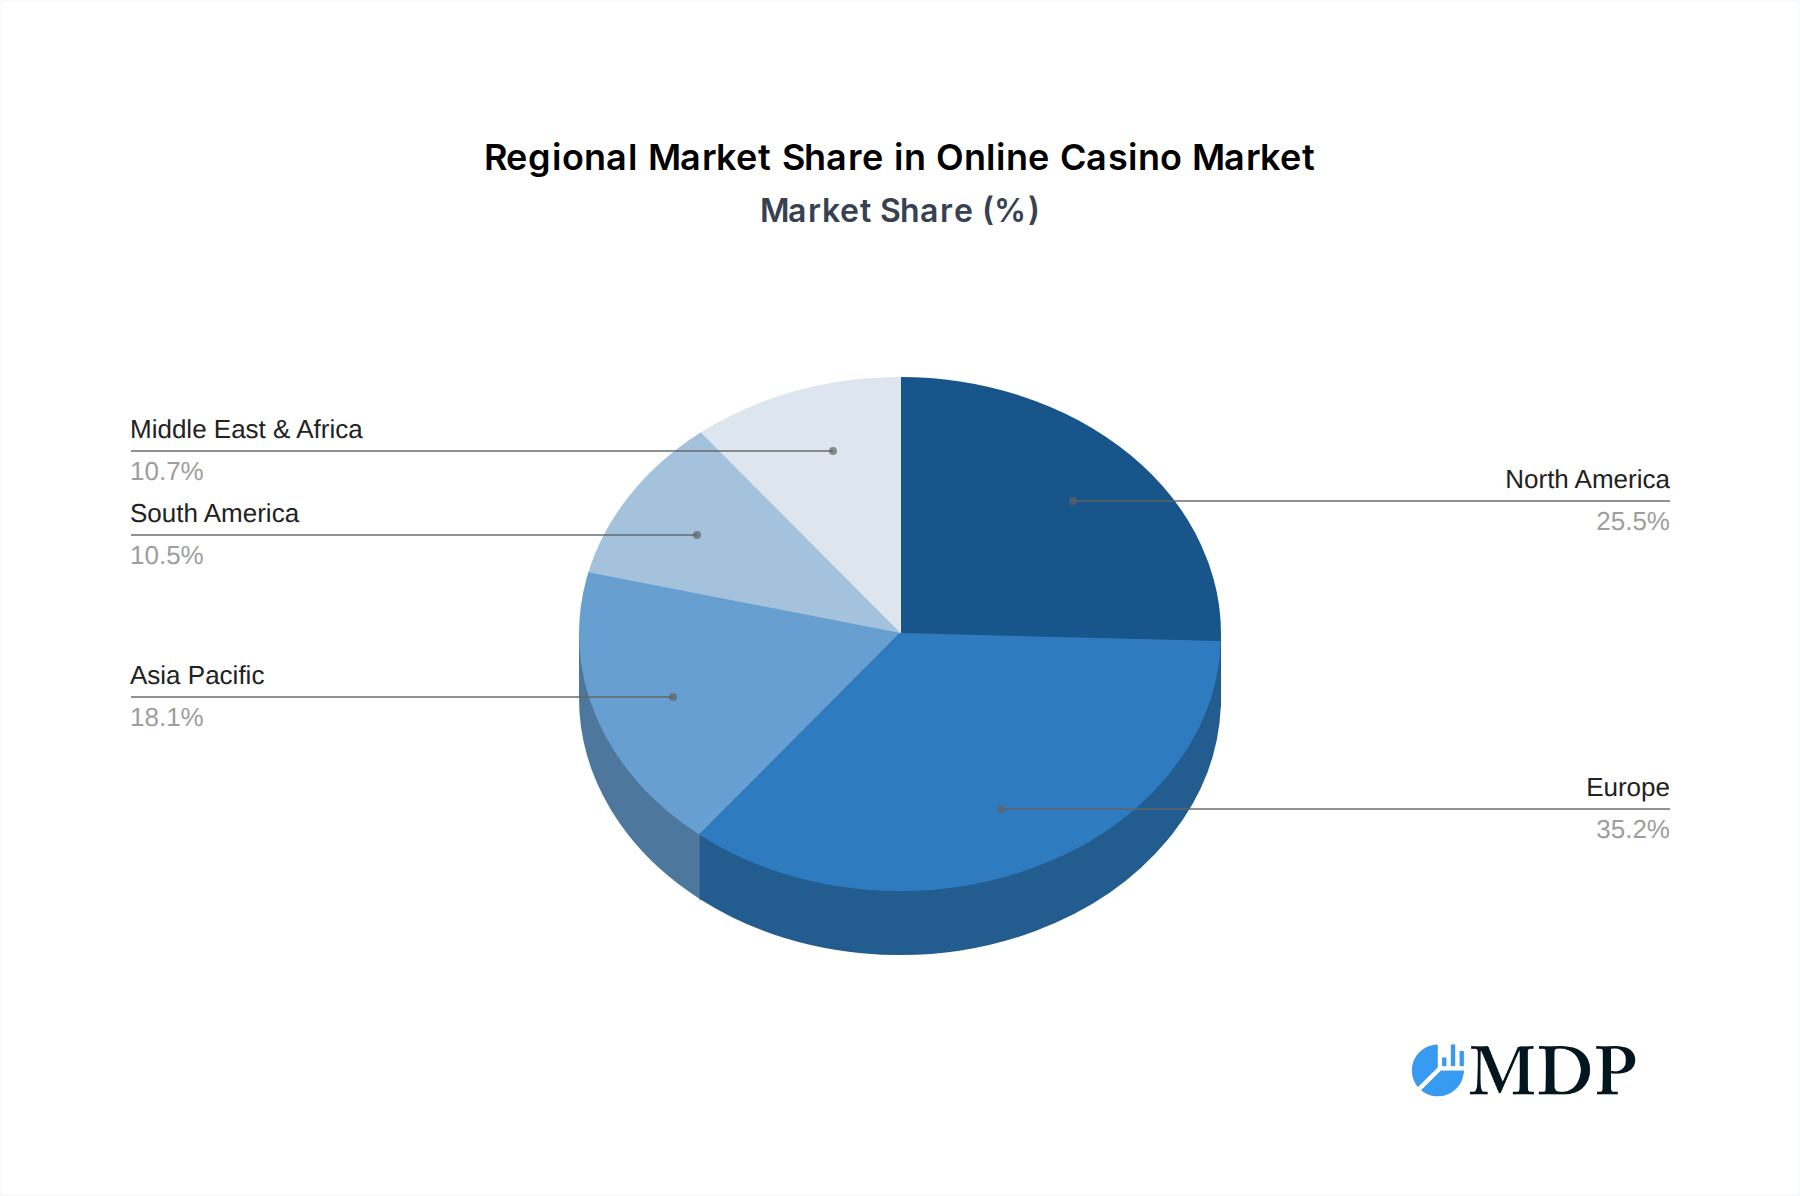
Online Casino Company Market Share
This in-depth report provides an indispensable analysis of the global online casino market, projected to reach billions in value by 2033. Covering the historical period from 2019 to 2024, with a base year of 2025 and a forecast period extending to 2033, this study delves into market dynamics, emerging trends, leading players, and strategic opportunities within this rapidly evolving sector. Leveraging high-traffic keywords, this report is optimized to attract industry stakeholders, investors, and decision-makers seeking actionable insights into the future of online gambling.
Online Casino Market Dynamics & Concentration
The online casino market is characterized by a dynamic interplay of innovation drivers, evolving regulatory frameworks, and the constant threat of product substitutes. Market concentration is a significant factor, with a few dominant players holding substantial market share, while numerous smaller operators compete for niche segments. The historical period (2019-2024) saw substantial growth fueled by increased internet penetration and mobile adoption. Innovation is primarily driven by advancements in software development, leading to more immersive and engaging gaming experiences, including the rise of live dealer games and virtual reality integration. Regulatory landscapes vary significantly across jurisdictions, posing both opportunities and challenges for market expansion. End-user trends indicate a growing preference for convenience, accessibility, and a diverse range of gaming options. Mergers and acquisitions (M&A) activities have been a notable feature, with an estimated billions of dollars in deal volume, consolidating market power and fostering synergistic growth. For instance, the consolidation of major players like Flutter Entertainment and The Stars Group significantly altered the competitive landscape. Market share distribution is highly fragmented, with the top X companies holding an estimated XX% of the global market. M&A deal counts are projected to continue at a steady pace, with an average of XX significant deals per year throughout the forecast period.
- Innovation Drivers: Advanced game development, AI-powered personalization, blockchain integration for transparency.
- Regulatory Frameworks: Patchwork of national and regional regulations, focus on responsible gambling and consumer protection.
- Product Substitutes: Traditional land-based casinos, sports betting, social casino games.
- End-User Trends: Demand for mobile-first experiences, social interaction features, diverse payment options.
- M&A Activities: Strategic acquisitions to gain market share, expand product portfolios, and enter new geographical markets.
Online Casino Industry Trends & Analysis
The online casino industry is experiencing robust growth, driven by a confluence of technological advancements, shifting consumer preferences, and increasing market penetration. The compound annual growth rate (CAGR) for the global online casino market is projected to be an impressive XX.XX% during the forecast period (2025-2033). Technological disruptions are at the forefront, with advancements in artificial intelligence (AI), virtual reality (VR), and augmented reality (AR) transforming the player experience. AI is being leveraged for personalized game recommendations, enhanced customer support, and fraud detection, while VR and AR offer highly immersive gaming environments that closely mimic traditional casino settings.
Consumer preferences are increasingly leaning towards mobile-first platforms, demanding seamless integration across devices and intuitive user interfaces. The demand for live dealer casinos continues to surge, offering real-time interaction with human dealers and a more authentic gaming atmosphere. This trend is particularly pronounced among younger demographics (18-29 and 30-39 years old) who are digital natives and accustomed to interactive online experiences.
Competitive dynamics are intense, with established giants and agile new entrants vying for market share. Companies are investing heavily in game variety, user experience, and innovative bonus structures to attract and retain players. Marketing strategies are becoming increasingly sophisticated, utilizing data analytics to target specific player segments and optimize campaign effectiveness. The market penetration of online casinos, while already substantial, is expected to deepen further, especially in emerging economies where internet access and disposable income are on the rise. Responsible gambling initiatives are also becoming a critical aspect of industry operations, with regulators and operators alike focusing on player well-being. The rise of cryptocurrency as a payment method is another significant trend, offering players anonymity and faster transaction times. Furthermore, the integration of gamification elements, such as leaderboards, achievements, and loyalty programs, is enhancing player engagement and retention. The increasing availability of high-speed internet and powerful mobile devices is also a crucial enabler of growth, making online casino games accessible to a wider audience than ever before.
Leading Markets & Segments in Online Casino
The online casino market exhibits distinct regional dominance and segment preferences, shaping its global landscape. Europe remains a leading region, driven by mature markets like the United Kingdom, Germany, and Sweden, where regulatory frameworks are well-established and consumer adoption is high. North America is also a rapidly expanding market, particularly following the legalization of online gambling in several US states. Asia, with its vast population and growing disposable income, presents significant untapped potential.
Within the application segment, the 18-29 years old demographic consistently shows the highest engagement rates, driven by their familiarity with digital platforms and a propensity for entertainment spending. The 30-39 years old segment is also a significant contributor, often seeking convenience and a form of leisure activity after work. The 40-49 years old segment is showing increasing engagement, influenced by the accessibility and variety offered by online platforms. The "Others" category, encompassing older demographics, is gradually increasing its participation as online casinos become more user-friendly and trusted.
In terms of types, Web-Based Casinos continue to dominate the market due to their immediate accessibility without the need for downloads. However, Live Based Casinos are experiencing phenomenal growth, offering an immersive and interactive experience that replicates the thrill of physical casinos. This is a key differentiator attracting players seeking a more engaging and social gambling environment. While Download-Based Online Casinos have seen a decline in popularity, they still cater to a segment of users who prefer dedicated software for potentially enhanced performance and features.
Dominant Region (Europe):
- Key Drivers: Mature regulatory environments, high internet and smartphone penetration, established online gambling culture.
- Detailed Dominance Analysis: European countries have historically been at the forefront of online gambling innovation. Robust licensing regimes, such as those in Malta and the UK, have fostered trust and provided a stable operating environment for major online casino operators. Economic policies supporting digital industries and strong consumer demand for entertainment further solidify Europe's leading position.
Dominant Application Segment (18-29 years old):
- Key Drivers: Digital native status, early adoption of new technologies, preference for mobile gaming, social integration features.
- Detailed Dominance Analysis: This demographic is highly receptive to online gaming due to their lifelong exposure to digital technologies. They are early adopters of new casino games and features, actively participate in online communities related to gaming, and are heavily influenced by social media trends. Their spending power, though potentially lower individually, is significant in aggregate.
Dominant Type (Web-Based Casinos):
- Key Drivers: Instant accessibility, no download required, broad device compatibility, ease of use.
- Detailed Dominance Analysis: The sheer convenience of web-based casinos cannot be overstated. Players can access games instantly through their web browsers on desktops, laptops, and mobile devices, eliminating the friction of downloading and installing software. This immediate access is crucial for casual players and those who prefer to switch between different gaming platforms easily.
Online Casino Product Developments
Product innovations in the online casino sector are primarily focused on enhancing user engagement and replicating the thrill of physical gaming. The integration of live dealer functionalities, powered by high-definition streaming and interactive chat features, has been a major breakthrough, bridging the gap between online and land-based experiences. Mobile-first design principles ensure seamless gameplay across all devices, with optimized interfaces and intuitive navigation. Advancements in Random Number Generator (RNG) technology are bolstering fairness and transparency, while the exploration of VR and AR technologies promises even more immersive gaming environments. Competitive advantages are increasingly derived from unique game mechanics, personalized player journeys, and robust loyalty programs.
Key Drivers of Online Casino Growth
The online casino market is propelled by several interconnected growth drivers. Technological advancements, particularly in mobile technology and internet speed, have made online gambling more accessible and enjoyable than ever. The increasing global internet penetration, coupled with a rising disposable income in many regions, fuels consumer spending on digital entertainment. Favorable regulatory changes in several key markets, such as the legalization and expansion of online gambling frameworks, are creating new opportunities for operators. Furthermore, the continued innovation in game development, offering diverse and engaging experiences, attracts and retains a broad player base.
- Technological Advancements: Widespread smartphone adoption, 5G network rollout, AI-driven personalization.
- Economic Factors: Growing disposable incomes, increasing demand for digital entertainment.
- Regulatory Changes: Legalization of online gambling in new jurisdictions, streamlined licensing processes.
- Product Innovation: Introduction of live dealer games, VR/AR integration, diverse game portfolios.
Challenges in the Online Casino Market
Despite its robust growth, the online casino market faces significant challenges. Stringent and fragmented regulatory landscapes across different countries create complex compliance hurdles and limit market access. The constant threat of supply chain disruptions, particularly concerning software providers and payment processors, can impact operational efficiency. Intense competition from both established players and emerging startups necessitates continuous innovation and significant marketing investment to maintain market share. Responsible gambling concerns and the need to prevent underage access and problem gambling require robust self-regulation and adherence to ethical practices, which can sometimes translate to higher operational costs.
- Regulatory Hurdles: Patchy legalization, varying compliance requirements, strict advertising restrictions.
- Competitive Pressures: High customer acquisition costs, price wars, market saturation in certain regions.
- Responsible Gambling: Increased scrutiny, demand for player protection tools, potential for reputational damage.
- Payment Processing Issues: Varying regulations on financial transactions, potential for fraud.
Emerging Opportunities in Online Casino
The online casino industry is ripe with emerging opportunities that promise substantial long-term growth. Technological breakthroughs, such as the mainstream adoption of virtual reality and augmented reality, are poised to revolutionize player immersion, creating entirely new gaming paradigms. Strategic partnerships between online casinos and leading technology providers, as well as established entertainment brands, can open up new revenue streams and customer bases. Market expansion into underserved emerging economies, where internet penetration is growing rapidly and consumer spending power is on the rise, presents a significant untapped potential. The development of innovative loyalty programs and gamified experiences can further enhance player retention and engagement, driving increased lifetime value.
Leading Players in the Online Casino Sector
- Bet365
- Kindred Group
- GVC Holdings
- Flutter Entertainment
- William Hill
- Pinnacle
- The Stars Group
- Betvictor
- Betsson AB
- Gamesys
- 888 Holdings
- Bet-at-home.com
- Intertops
- Betway
- Betfred
- Interwetten
- SBOBET
- Sportech
- EGB
- BetOnline
Key Milestones in Online Casino Industry
- 2019: Increased regulatory scrutiny in key European markets, leading to a focus on responsible gambling measures.
- 2020: Significant surge in online casino engagement due to global lockdowns and increased demand for remote entertainment.
- 2021: Major M&A activities, including the acquisition of The Stars Group by Flutter Entertainment, reshaping the market landscape.
- 2022: Growing adoption of cryptocurrencies for deposits and withdrawals, enhancing transaction speed and privacy.
- 2023: Advancements in live dealer technology, offering more immersive and interactive gaming experiences, with higher streaming quality and more diverse game offerings.
- 2024: Continued expansion of regulated markets in North America, with more states legalizing online casino operations.
Strategic Outlook for Online Casino Market
The strategic outlook for the online casino market remains exceptionally positive, driven by continuous technological innovation and expanding global accessibility. Growth accelerators will be found in the relentless pursuit of enhanced player experiences, particularly through VR/AR integration and AI-driven personalization. Strategic alliances with emerging technology firms and entertainment IPs will unlock novel revenue streams. Furthermore, targeted market expansion into developing economies, coupled with the development of robust responsible gambling frameworks, will foster sustainable long-term growth. The industry's ability to adapt to evolving regulatory landscapes and consumer preferences will be paramount to capitalizing on its vast future potential.
Online Casino Segmentation
-
1. Application
- 1.1. 18-29 years old
- 1.2. 30-39 years old
- 1.3. 40-49 years old
- 1.4. Others
-
2. Types
- 2.1. Web-Based Casinos
- 2.2. Download-Based Online Casinos
- 2.3. Live Based Casinos
Online Casino Segmentation By Geography
-
1. North America
- 1.1. United States
- 1.2. Canada
- 1.3. Mexico
-
2. South America
- 2.1. Brazil
- 2.2. Argentina
- 2.3. Rest of South America
-
3. Europe
- 3.1. United Kingdom
- 3.2. Germany
- 3.3. France
- 3.4. Italy
- 3.5. Spain
- 3.6. Russia
- 3.7. Benelux
- 3.8. Nordics
- 3.9. Rest of Europe
-
4. Middle East & Africa
- 4.1. Turkey
- 4.2. Israel
- 4.3. GCC
- 4.4. North Africa
- 4.5. South Africa
- 4.6. Rest of Middle East & Africa
-
5. Asia Pacific
- 5.1. China
- 5.2. India
- 5.3. Japan
- 5.4. South Korea
- 5.5. ASEAN
- 5.6. Oceania
- 5.7. Rest of Asia Pacific
Online Casino Regional Market Share
Geographic Coverage of Online Casino
Online Casino REPORT HIGHLIGHTS
| Aspects | Details |
|---|---|
| Study Period | 2020-2034 |
| Base Year | 2025 |
| Estimated Year | 2026 |
| Forecast Period | 2026-2034 |
| Historical Period | 2020-2025 |
| Growth Rate | CAGR of 12.2% from 2020-2034 |
| Segmentation |
|
Table of Contents
- 1. Introduction
- 1.1. Research Scope
- 1.2. Market Segmentation
- 1.3. Research Methodology
- 1.4. Definitions and Assumptions
- 2. Executive Summary
- 2.1. Introduction
- 3. Market Dynamics
- 3.1. Introduction
- 3.2. Market Drivers
- 3.3. Market Restrains
- 3.4. Market Trends
- 4. Market Factor Analysis
- 4.1. Porters Five Forces
- 4.2. Supply/Value Chain
- 4.3. PESTEL analysis
- 4.4. Market Entropy
- 4.5. Patent/Trademark Analysis
- 5. Global Online Casino Analysis, Insights and Forecast, 2020-2032
- 5.1. Market Analysis, Insights and Forecast - by Application
- 5.1.1. 18-29 years old
- 5.1.2. 30-39 years old
- 5.1.3. 40-49 years old
- 5.1.4. Others
- 5.2. Market Analysis, Insights and Forecast - by Types
- 5.2.1. Web-Based Casinos
- 5.2.2. Download-Based Online Casinos
- 5.2.3. Live Based Casinos
- 5.3. Market Analysis, Insights and Forecast - by Region
- 5.3.1. North America
- 5.3.2. South America
- 5.3.3. Europe
- 5.3.4. Middle East & Africa
- 5.3.5. Asia Pacific
- 5.1. Market Analysis, Insights and Forecast - by Application
- 6. North America Online Casino Analysis, Insights and Forecast, 2020-2032
- 6.1. Market Analysis, Insights and Forecast - by Application
- 6.1.1. 18-29 years old
- 6.1.2. 30-39 years old
- 6.1.3. 40-49 years old
- 6.1.4. Others
- 6.2. Market Analysis, Insights and Forecast - by Types
- 6.2.1. Web-Based Casinos
- 6.2.2. Download-Based Online Casinos
- 6.2.3. Live Based Casinos
- 6.1. Market Analysis, Insights and Forecast - by Application
- 7. South America Online Casino Analysis, Insights and Forecast, 2020-2032
- 7.1. Market Analysis, Insights and Forecast - by Application
- 7.1.1. 18-29 years old
- 7.1.2. 30-39 years old
- 7.1.3. 40-49 years old
- 7.1.4. Others
- 7.2. Market Analysis, Insights and Forecast - by Types
- 7.2.1. Web-Based Casinos
- 7.2.2. Download-Based Online Casinos
- 7.2.3. Live Based Casinos
- 7.1. Market Analysis, Insights and Forecast - by Application
- 8. Europe Online Casino Analysis, Insights and Forecast, 2020-2032
- 8.1. Market Analysis, Insights and Forecast - by Application
- 8.1.1. 18-29 years old
- 8.1.2. 30-39 years old
- 8.1.3. 40-49 years old
- 8.1.4. Others
- 8.2. Market Analysis, Insights and Forecast - by Types
- 8.2.1. Web-Based Casinos
- 8.2.2. Download-Based Online Casinos
- 8.2.3. Live Based Casinos
- 8.1. Market Analysis, Insights and Forecast - by Application
- 9. Middle East & Africa Online Casino Analysis, Insights and Forecast, 2020-2032
- 9.1. Market Analysis, Insights and Forecast - by Application
- 9.1.1. 18-29 years old
- 9.1.2. 30-39 years old
- 9.1.3. 40-49 years old
- 9.1.4. Others
- 9.2. Market Analysis, Insights and Forecast - by Types
- 9.2.1. Web-Based Casinos
- 9.2.2. Download-Based Online Casinos
- 9.2.3. Live Based Casinos
- 9.1. Market Analysis, Insights and Forecast - by Application
- 10. Asia Pacific Online Casino Analysis, Insights and Forecast, 2020-2032
- 10.1. Market Analysis, Insights and Forecast - by Application
- 10.1.1. 18-29 years old
- 10.1.2. 30-39 years old
- 10.1.3. 40-49 years old
- 10.1.4. Others
- 10.2. Market Analysis, Insights and Forecast - by Types
- 10.2.1. Web-Based Casinos
- 10.2.2. Download-Based Online Casinos
- 10.2.3. Live Based Casinos
- 10.1. Market Analysis, Insights and Forecast - by Application
- 11. Competitive Analysis
- 11.1. Global Market Share Analysis 2025
- 11.2. Company Profiles
- 11.2.1 Bet365
- 11.2.1.1. Overview
- 11.2.1.2. Products
- 11.2.1.3. SWOT Analysis
- 11.2.1.4. Recent Developments
- 11.2.1.5. Financials (Based on Availability)
- 11.2.2 Kindred Group
- 11.2.2.1. Overview
- 11.2.2.2. Products
- 11.2.2.3. SWOT Analysis
- 11.2.2.4. Recent Developments
- 11.2.2.5. Financials (Based on Availability)
- 11.2.3 GVC Holdings
- 11.2.3.1. Overview
- 11.2.3.2. Products
- 11.2.3.3. SWOT Analysis
- 11.2.3.4. Recent Developments
- 11.2.3.5. Financials (Based on Availability)
- 11.2.4 Flutter Entertainment
- 11.2.4.1. Overview
- 11.2.4.2. Products
- 11.2.4.3. SWOT Analysis
- 11.2.4.4. Recent Developments
- 11.2.4.5. Financials (Based on Availability)
- 11.2.5 William Hill
- 11.2.5.1. Overview
- 11.2.5.2. Products
- 11.2.5.3. SWOT Analysis
- 11.2.5.4. Recent Developments
- 11.2.5.5. Financials (Based on Availability)
- 11.2.6 Pinnacle
- 11.2.6.1. Overview
- 11.2.6.2. Products
- 11.2.6.3. SWOT Analysis
- 11.2.6.4. Recent Developments
- 11.2.6.5. Financials (Based on Availability)
- 11.2.7 The Stars Group
- 11.2.7.1. Overview
- 11.2.7.2. Products
- 11.2.7.3. SWOT Analysis
- 11.2.7.4. Recent Developments
- 11.2.7.5. Financials (Based on Availability)
- 11.2.8 Betvictor
- 11.2.8.1. Overview
- 11.2.8.2. Products
- 11.2.8.3. SWOT Analysis
- 11.2.8.4. Recent Developments
- 11.2.8.5. Financials (Based on Availability)
- 11.2.9 Betsson AB
- 11.2.9.1. Overview
- 11.2.9.2. Products
- 11.2.9.3. SWOT Analysis
- 11.2.9.4. Recent Developments
- 11.2.9.5. Financials (Based on Availability)
- 11.2.10 Gamesys
- 11.2.10.1. Overview
- 11.2.10.2. Products
- 11.2.10.3. SWOT Analysis
- 11.2.10.4. Recent Developments
- 11.2.10.5. Financials (Based on Availability)
- 11.2.11 888 Holdings
- 11.2.11.1. Overview
- 11.2.11.2. Products
- 11.2.11.3. SWOT Analysis
- 11.2.11.4. Recent Developments
- 11.2.11.5. Financials (Based on Availability)
- 11.2.12 Bet-at-home.com
- 11.2.12.1. Overview
- 11.2.12.2. Products
- 11.2.12.3. SWOT Analysis
- 11.2.12.4. Recent Developments
- 11.2.12.5. Financials (Based on Availability)
- 11.2.13 Intertops
- 11.2.13.1. Overview
- 11.2.13.2. Products
- 11.2.13.3. SWOT Analysis
- 11.2.13.4. Recent Developments
- 11.2.13.5. Financials (Based on Availability)
- 11.2.14 Betway
- 11.2.14.1. Overview
- 11.2.14.2. Products
- 11.2.14.3. SWOT Analysis
- 11.2.14.4. Recent Developments
- 11.2.14.5. Financials (Based on Availability)
- 11.2.15 Betfred
- 11.2.15.1. Overview
- 11.2.15.2. Products
- 11.2.15.3. SWOT Analysis
- 11.2.15.4. Recent Developments
- 11.2.15.5. Financials (Based on Availability)
- 11.2.16 Interwetten
- 11.2.16.1. Overview
- 11.2.16.2. Products
- 11.2.16.3. SWOT Analysis
- 11.2.16.4. Recent Developments
- 11.2.16.5. Financials (Based on Availability)
- 11.2.17 SBOBET
- 11.2.17.1. Overview
- 11.2.17.2. Products
- 11.2.17.3. SWOT Analysis
- 11.2.17.4. Recent Developments
- 11.2.17.5. Financials (Based on Availability)
- 11.2.18 Sportech
- 11.2.18.1. Overview
- 11.2.18.2. Products
- 11.2.18.3. SWOT Analysis
- 11.2.18.4. Recent Developments
- 11.2.18.5. Financials (Based on Availability)
- 11.2.19 EGB
- 11.2.19.1. Overview
- 11.2.19.2. Products
- 11.2.19.3. SWOT Analysis
- 11.2.19.4. Recent Developments
- 11.2.19.5. Financials (Based on Availability)
- 11.2.20 BetOnline
- 11.2.20.1. Overview
- 11.2.20.2. Products
- 11.2.20.3. SWOT Analysis
- 11.2.20.4. Recent Developments
- 11.2.20.5. Financials (Based on Availability)
- 11.2.1 Bet365
List of Figures
- Figure 1: Global Online Casino Revenue Breakdown (undefined, %) by Region 2025 & 2033
- Figure 2: North America Online Casino Revenue (undefined), by Application 2025 & 2033
- Figure 3: North America Online Casino Revenue Share (%), by Application 2025 & 2033
- Figure 4: North America Online Casino Revenue (undefined), by Types 2025 & 2033
- Figure 5: North America Online Casino Revenue Share (%), by Types 2025 & 2033
- Figure 6: North America Online Casino Revenue (undefined), by Country 2025 & 2033
- Figure 7: North America Online Casino Revenue Share (%), by Country 2025 & 2033
- Figure 8: South America Online Casino Revenue (undefined), by Application 2025 & 2033
- Figure 9: South America Online Casino Revenue Share (%), by Application 2025 & 2033
- Figure 10: South America Online Casino Revenue (undefined), by Types 2025 & 2033
- Figure 11: South America Online Casino Revenue Share (%), by Types 2025 & 2033
- Figure 12: South America Online Casino Revenue (undefined), by Country 2025 & 2033
- Figure 13: South America Online Casino Revenue Share (%), by Country 2025 & 2033
- Figure 14: Europe Online Casino Revenue (undefined), by Application 2025 & 2033
- Figure 15: Europe Online Casino Revenue Share (%), by Application 2025 & 2033
- Figure 16: Europe Online Casino Revenue (undefined), by Types 2025 & 2033
- Figure 17: Europe Online Casino Revenue Share (%), by Types 2025 & 2033
- Figure 18: Europe Online Casino Revenue (undefined), by Country 2025 & 2033
- Figure 19: Europe Online Casino Revenue Share (%), by Country 2025 & 2033
- Figure 20: Middle East & Africa Online Casino Revenue (undefined), by Application 2025 & 2033
- Figure 21: Middle East & Africa Online Casino Revenue Share (%), by Application 2025 & 2033
- Figure 22: Middle East & Africa Online Casino Revenue (undefined), by Types 2025 & 2033
- Figure 23: Middle East & Africa Online Casino Revenue Share (%), by Types 2025 & 2033
- Figure 24: Middle East & Africa Online Casino Revenue (undefined), by Country 2025 & 2033
- Figure 25: Middle East & Africa Online Casino Revenue Share (%), by Country 2025 & 2033
- Figure 26: Asia Pacific Online Casino Revenue (undefined), by Application 2025 & 2033
- Figure 27: Asia Pacific Online Casino Revenue Share (%), by Application 2025 & 2033
- Figure 28: Asia Pacific Online Casino Revenue (undefined), by Types 2025 & 2033
- Figure 29: Asia Pacific Online Casino Revenue Share (%), by Types 2025 & 2033
- Figure 30: Asia Pacific Online Casino Revenue (undefined), by Country 2025 & 2033
- Figure 31: Asia Pacific Online Casino Revenue Share (%), by Country 2025 & 2033
List of Tables
- Table 1: Global Online Casino Revenue undefined Forecast, by Application 2020 & 2033
- Table 2: Global Online Casino Revenue undefined Forecast, by Types 2020 & 2033
- Table 3: Global Online Casino Revenue undefined Forecast, by Region 2020 & 2033
- Table 4: Global Online Casino Revenue undefined Forecast, by Application 2020 & 2033
- Table 5: Global Online Casino Revenue undefined Forecast, by Types 2020 & 2033
- Table 6: Global Online Casino Revenue undefined Forecast, by Country 2020 & 2033
- Table 7: United States Online Casino Revenue (undefined) Forecast, by Application 2020 & 2033
- Table 8: Canada Online Casino Revenue (undefined) Forecast, by Application 2020 & 2033
- Table 9: Mexico Online Casino Revenue (undefined) Forecast, by Application 2020 & 2033
- Table 10: Global Online Casino Revenue undefined Forecast, by Application 2020 & 2033
- Table 11: Global Online Casino Revenue undefined Forecast, by Types 2020 & 2033
- Table 12: Global Online Casino Revenue undefined Forecast, by Country 2020 & 2033
- Table 13: Brazil Online Casino Revenue (undefined) Forecast, by Application 2020 & 2033
- Table 14: Argentina Online Casino Revenue (undefined) Forecast, by Application 2020 & 2033
- Table 15: Rest of South America Online Casino Revenue (undefined) Forecast, by Application 2020 & 2033
- Table 16: Global Online Casino Revenue undefined Forecast, by Application 2020 & 2033
- Table 17: Global Online Casino Revenue undefined Forecast, by Types 2020 & 2033
- Table 18: Global Online Casino Revenue undefined Forecast, by Country 2020 & 2033
- Table 19: United Kingdom Online Casino Revenue (undefined) Forecast, by Application 2020 & 2033
- Table 20: Germany Online Casino Revenue (undefined) Forecast, by Application 2020 & 2033
- Table 21: France Online Casino Revenue (undefined) Forecast, by Application 2020 & 2033
- Table 22: Italy Online Casino Revenue (undefined) Forecast, by Application 2020 & 2033
- Table 23: Spain Online Casino Revenue (undefined) Forecast, by Application 2020 & 2033
- Table 24: Russia Online Casino Revenue (undefined) Forecast, by Application 2020 & 2033
- Table 25: Benelux Online Casino Revenue (undefined) Forecast, by Application 2020 & 2033
- Table 26: Nordics Online Casino Revenue (undefined) Forecast, by Application 2020 & 2033
- Table 27: Rest of Europe Online Casino Revenue (undefined) Forecast, by Application 2020 & 2033
- Table 28: Global Online Casino Revenue undefined Forecast, by Application 2020 & 2033
- Table 29: Global Online Casino Revenue undefined Forecast, by Types 2020 & 2033
- Table 30: Global Online Casino Revenue undefined Forecast, by Country 2020 & 2033
- Table 31: Turkey Online Casino Revenue (undefined) Forecast, by Application 2020 & 2033
- Table 32: Israel Online Casino Revenue (undefined) Forecast, by Application 2020 & 2033
- Table 33: GCC Online Casino Revenue (undefined) Forecast, by Application 2020 & 2033
- Table 34: North Africa Online Casino Revenue (undefined) Forecast, by Application 2020 & 2033
- Table 35: South Africa Online Casino Revenue (undefined) Forecast, by Application 2020 & 2033
- Table 36: Rest of Middle East & Africa Online Casino Revenue (undefined) Forecast, by Application 2020 & 2033
- Table 37: Global Online Casino Revenue undefined Forecast, by Application 2020 & 2033
- Table 38: Global Online Casino Revenue undefined Forecast, by Types 2020 & 2033
- Table 39: Global Online Casino Revenue undefined Forecast, by Country 2020 & 2033
- Table 40: China Online Casino Revenue (undefined) Forecast, by Application 2020 & 2033
- Table 41: India Online Casino Revenue (undefined) Forecast, by Application 2020 & 2033
- Table 42: Japan Online Casino Revenue (undefined) Forecast, by Application 2020 & 2033
- Table 43: South Korea Online Casino Revenue (undefined) Forecast, by Application 2020 & 2033
- Table 44: ASEAN Online Casino Revenue (undefined) Forecast, by Application 2020 & 2033
- Table 45: Oceania Online Casino Revenue (undefined) Forecast, by Application 2020 & 2033
- Table 46: Rest of Asia Pacific Online Casino Revenue (undefined) Forecast, by Application 2020 & 2033
Frequently Asked Questions
1. What is the projected Compound Annual Growth Rate (CAGR) of the Online Casino?
The projected CAGR is approximately 12.2%.
2. Which companies are prominent players in the Online Casino?
Key companies in the market include Bet365, Kindred Group, GVC Holdings, Flutter Entertainment, William Hill, Pinnacle, The Stars Group, Betvictor, Betsson AB, Gamesys, 888 Holdings, Bet-at-home.com, Intertops, Betway, Betfred, Interwetten, SBOBET, Sportech, EGB, BetOnline.
3. What are the main segments of the Online Casino?
The market segments include Application, Types.
4. Can you provide details about the market size?
The market size is estimated to be USD XXX N/A as of 2022.
5. What are some drivers contributing to market growth?
N/A
6. What are the notable trends driving market growth?
N/A
7. Are there any restraints impacting market growth?
N/A
8. Can you provide examples of recent developments in the market?
N/A
9. What pricing options are available for accessing the report?
Pricing options include single-user, multi-user, and enterprise licenses priced at USD 2900.00, USD 4350.00, and USD 5800.00 respectively.
10. Is the market size provided in terms of value or volume?
The market size is provided in terms of value, measured in N/A.
11. Are there any specific market keywords associated with the report?
Yes, the market keyword associated with the report is "Online Casino," which aids in identifying and referencing the specific market segment covered.
12. How do I determine which pricing option suits my needs best?
The pricing options vary based on user requirements and access needs. Individual users may opt for single-user licenses, while businesses requiring broader access may choose multi-user or enterprise licenses for cost-effective access to the report.
13. Are there any additional resources or data provided in the Online Casino report?
While the report offers comprehensive insights, it's advisable to review the specific contents or supplementary materials provided to ascertain if additional resources or data are available.
14. How can I stay updated on further developments or reports in the Online Casino?
To stay informed about further developments, trends, and reports in the Online Casino, consider subscribing to industry newsletters, following relevant companies and organizations, or regularly checking reputable industry news sources and publications.
Methodology
Step 1 - Identification of Relevant Samples Size from Population Database


Step 2 - Approaches for Defining Global Market Size (Value, Volume* & Price*)

Note*: In applicable scenarios
Step 3 - Data Sources
Primary Research
- Web Analytics
- Survey Reports
- Research Institute
- Latest Research Reports
- Opinion Leaders
Secondary Research
- Annual Reports
- White Paper
- Latest Press Release
- Industry Association
- Paid Database
- Investor Presentations

Step 4 - Data Triangulation
Involves using different sources of information in order to increase the validity of a study
These sources are likely to be stakeholders in a program - participants, other researchers, program staff, other community members, and so on.
Then we put all data in single framework & apply various statistical tools to find out the dynamic on the market.
During the analysis stage, feedback from the stakeholder groups would be compared to determine areas of agreement as well as areas of divergence