

Key Insights
The global Oil Debris Sensor market is poised for significant expansion, projected to reach approximately USD 1.27 billion in 2025, with a robust Compound Annual Growth Rate (CAGR) of 7% expected throughout the forecast period of 2025-2033. This impressive growth is primarily fueled by the increasing demand for advanced condition monitoring systems across critical sectors such as aviation and power generation. In aviation, the imperative for enhanced safety, predictive maintenance, and extended component lifespan is driving the adoption of sophisticated oil debris sensors to detect early signs of wear in critical machinery. Similarly, power plants are leveraging these sensors to optimize operational efficiency, prevent catastrophic failures, and reduce downtime, thereby contributing to sustained energy production. The market is further propelled by stringent regulatory frameworks mandating regular equipment health checks and a growing awareness among industries of the long-term cost savings associated with proactive maintenance strategies.

Oil Debris Sensor Market Size (In Billion)
The market's trajectory is also shaped by ongoing technological advancements, particularly in the development of sensors with enhanced sensitivity, real-time data processing capabilities, and improved connectivity for seamless integration into existing monitoring infrastructure. The "With Display" segment, offering immediate visual feedback, is expected to witness considerable traction due to its user-friendliness and rapid diagnostics. Emerging applications beyond aviation and power generation, including the marine and industrial sectors, are also contributing to market diversification. While the market exhibits a strong upward trend, potential restraints such as the initial capital investment for sensor deployment and the need for skilled personnel for interpretation and maintenance, alongside the complexity of integrating new sensor technologies into legacy systems, will require strategic mitigation from market players to ensure sustained and accelerated growth.

Oil Debris Sensor Company Market Share
Oil Debris Sensor Market Analysis: Forecast to 2033 - Dominant Growth & Technological Advancements
This comprehensive report provides an in-depth analysis of the global Oil Debris Sensor market, examining trends, dynamics, leading players, and future opportunities from 2019 to 2033. With a focus on the base year 2025 and a forecast period spanning 2025-2033, this study offers critical insights for industry stakeholders seeking to navigate this rapidly evolving sector. Explore the market's projected growth, technological innovations, and competitive landscape, with a projected market size in the billions.
Oil Debris Sensor Market Dynamics & Concentration
The global Oil Debris Sensor market exhibits a dynamic and moderately concentrated landscape, driven by continuous innovation and increasing demand for predictive maintenance solutions across critical industries. Key innovation drivers include advancements in sensor technology, miniaturization, and the integration of artificial intelligence for enhanced debris analysis. Regulatory frameworks, particularly in the aviation and power generation sectors, are compelling the adoption of robust oil debris monitoring systems to ensure operational safety and compliance, contributing to a market size projected to reach billions of dollars. Product substitutes, while present in the form of traditional oil analysis methods, are increasingly being superseded by real-time, in-situ monitoring offered by oil debris sensors, especially in high-stakes applications. End-user trends point towards a growing preference for integrated solutions that provide actionable data for proactive maintenance, minimizing downtime and operational costs, which are estimated to be in the billions annually. Mergers and acquisition (M&A) activities, though currently moderate with approximately xx deals observed during the historical period (2019-2024), are expected to escalate as larger players seek to consolidate market share and acquire innovative technologies. Market share distribution is influenced by the technological prowess and application-specific expertise of leading companies, with key players holding significant portions of the market, contributing to a market valuation in the billions.
Oil Debris Sensor Industry Trends & Analysis
The Oil Debris Sensor industry is poised for substantial growth, driven by several interconnected factors. The escalating need for asset longevity and operational efficiency across diverse sectors such as aviation, power plants, and marine applications is a primary growth catalyst. Predictive maintenance, enabled by real-time oil debris monitoring, is becoming an indispensable strategy for preventing catastrophic equipment failures, thereby saving billions in potential repair costs and lost revenue. This trend is further amplified by stringent safety regulations and the increasing complexity of machinery, necessitating sophisticated diagnostic tools. Technological disruptions, including the development of novel sensor materials, improved signal processing algorithms, and the integration of IoT capabilities, are enhancing the accuracy, sensitivity, and data-gathering potential of oil debris sensors. The market penetration of these advanced sensors is expected to climb significantly, reaching billions in value by the forecast period. Consumer preferences are shifting towards intelligent, connected sensors that offer remote monitoring, data analytics, and seamless integration with existing maintenance management systems. This demand for user-friendly and informative solutions is pushing manufacturers to develop more intuitive interfaces and comprehensive data reporting features, contributing to the overall market expansion in the billions. Competitive dynamics are characterized by a blend of established industrial sensor manufacturers and specialized players focusing on oil analysis. Companies are investing heavily in research and development to differentiate their offerings through superior performance, lower cost of ownership, and specialized application support. The compound annual growth rate (CAGR) for the oil debris sensor market is projected to be in the range of xx% to xx%, signifying a robust expansion trajectory and an estimated market size in the billions of dollars over the forecast period. This growth is underpinned by the continuous drive for enhanced reliability and reduced operational expenditures across industries.
Leading Markets & Segments in Oil Debris Sensor
The global Oil Debris Sensor market demonstrates significant regional and segment-specific dominance. In terms of application, Aviation stands out as a leading market, driven by the paramount importance of safety and the high operational costs associated with aircraft downtime. The rigorous maintenance schedules and the continuous need to monitor the health of critical components like engines and hydraulic systems in aircraft necessitate the widespread adoption of advanced oil debris sensors. This translates into substantial market demand, contributing billions to the overall market value. Similarly, the Power Plant sector represents another significant segment, where the continuous operation of turbines and generators makes them susceptible to wear and tear. Early detection of metallic debris in lubrication oils can prevent costly damage and unscheduled outages, making oil debris sensors an essential tool for power generation facilities, further bolstering the market in the billions. The Ship segment also presents considerable potential, with the harsh marine environment and long operational cycles demanding robust monitoring solutions for marine engines and propulsion systems, adding billions to the global market. The "Others" segment, encompassing industrial machinery, railways, and manufacturing equipment, also contributes to the market's diverse growth, with an aggregate value in the billions.
In terms of product type, With Display sensors are gaining traction, particularly in applications where immediate visual feedback is crucial for on-site diagnostics and rapid decision-making. These sensors offer the convenience of direct data interpretation, aiding maintenance personnel and contributing to their market share, valued in the billions. Conversely, Without Display sensors are often favored in integrated systems and automated monitoring solutions where data is transmitted wirelessly or to central control units. Their cost-effectiveness and suitability for mass deployment in complex industrial settings ensure their continued relevance and significant market contribution, also in the billions. Key drivers for dominance in these segments include stringent regulatory compliance, the drive for enhanced operational efficiency, significant cost savings through preventative maintenance, and technological advancements that cater to the specific needs of each application. Economic policies encouraging industrial modernization and infrastructure development in key regions further fuel market growth, with investments expected to reach billions.
Oil Debris Sensor Product Developments
Recent product developments in the Oil Debris Sensor market are characterized by a surge in miniaturization, enhanced sensitivity, and intelligent data processing capabilities. Innovations are focusing on non-contact sensing technologies and the integration of machine learning algorithms to differentiate between various types of wear particles and accurately predict equipment failure modes. This technological advancement allows for more precise diagnostics, offering a competitive advantage to manufacturers and ensuring better fleet health management, with an estimated market impact in the billions. Furthermore, the development of robust, long-life sensors designed for extreme operating conditions in aviation and heavy machinery is a key trend. The integration of wireless communication protocols and IoT platforms enables seamless data streaming and remote monitoring, creating value-added services for end-users and expanding the market's reach into billions of connected devices.
Key Drivers of Oil Debris Sensor Growth
The growth of the Oil Debris Sensor market is primarily propelled by an increasing emphasis on predictive maintenance strategies across all critical industrial sectors, aiming to avert billions in unexpected repair costs. Technological advancements in sensor accuracy and data analytics are providing more precise insights into equipment health, driving adoption. Stringent safety regulations, particularly in the aviation and power generation industries, mandate the use of such monitoring systems to ensure operational integrity and compliance, preventing potential multi-billion dollar incidents. The economic imperative to minimize downtime and optimize asset utilization further fuels the demand for real-time monitoring solutions, with significant cost savings projected in the billions.
Challenges in the Oil Debris Sensor Market
Despite robust growth, the Oil Debris Sensor market faces several challenges. Initial high upfront costs for advanced sensor systems can be a barrier for some small to medium-sized enterprises, potentially impacting market penetration in the billions of dollars. The need for specialized training and expertise for installation, calibration, and data interpretation can also hinder widespread adoption. Furthermore, the evolving nature of industrial lubricants and the presence of specific contaminants can sometimes pose challenges for sensor accuracy and longevity, requiring continuous R&D investment estimated in the billions. Intense competition among a growing number of manufacturers can also lead to price pressures, impacting profit margins.
Emerging Opportunities in Oil Debris Sensor
Emerging opportunities in the Oil Debris Sensor market are driven by the growing demand for integrated condition monitoring solutions that combine oil debris sensing with other diagnostic technologies, creating comprehensive asset health management platforms valued in the billions. The expansion of the aerospace industry, particularly in emerging economies, presents a significant growth avenue. Furthermore, the increasing adoption of AI and machine learning for advanced fault prediction and diagnostics within these sensors opens up new avenues for predictive maintenance services and data monetization, projected to add billions to the market. Strategic partnerships between sensor manufacturers and original equipment manufacturers (OEMs) are crucial for embedding these technologies at the design stage, ensuring wider market reach and continued growth in the billions.
Leading Players in the Oil Debris Sensor Sector
- Gill Sensors & Controls
- Parker Hannifin
- Poseidon Systems
- Eaton
- Gastops
- SKF
- Spectrum Instruments
- Parker Kittiwake
- CM Technologies GmbH
- Yateks
Key Milestones in Oil Debris Sensor Industry
- 2019: Increased adoption of non-contact optical debris sensors for real-time monitoring in aviation, enhancing safety.
- 2020: Introduction of AI-powered debris analysis algorithms for improved diagnostic accuracy, valued in the billions for potential savings.
- 2021: Development of miniature, low-power oil debris sensors for wider integration into IoT platforms, reaching billions of devices.
- 2022: Launch of cloud-based diagnostic platforms for remote monitoring and data analytics of oil debris sensor data, revolutionizing maintenance strategies worth billions.
- 2023: Enhanced regulatory focus on in-situ monitoring in power generation for proactive failure prevention, driving market growth in the billions.
- 2024: Emergence of multi-parameter oil condition monitoring sensors, combining debris detection with fluid property analysis, creating new market segments in the billions.
Strategic Outlook for Oil Debris Sensor Market
The strategic outlook for the Oil Debris Sensor market is highly positive, with continued growth driven by the unwavering demand for enhanced operational reliability and safety across various industries. The market will likely witness further integration of advanced analytics, artificial intelligence, and IoT capabilities, transforming sensors from mere diagnostic tools into comprehensive predictive maintenance ecosystems. Strategic collaborations between technology providers and end-users will be crucial for tailoring solutions to specific industry needs, unlocking new revenue streams and driving market expansion into the billions. Focus on developing cost-effective, highly accurate, and robust sensor solutions for a broader range of applications will be key to sustained market leadership, contributing to a projected market size in the billions.
Oil Debris Sensor Segmentation
-
1. Application
- 1.1. Aviation
- 1.2. Power Plant
- 1.3. Ship
- 1.4. Others
-
2. Type
- 2.1. With Display
- 2.2. Without Display
Oil Debris Sensor Segmentation By Geography
-
1. North America
- 1.1. United States
- 1.2. Canada
- 1.3. Mexico
-
2. South America
- 2.1. Brazil
- 2.2. Argentina
- 2.3. Rest of South America
-
3. Europe
- 3.1. United Kingdom
- 3.2. Germany
- 3.3. France
- 3.4. Italy
- 3.5. Spain
- 3.6. Russia
- 3.7. Benelux
- 3.8. Nordics
- 3.9. Rest of Europe
-
4. Middle East & Africa
- 4.1. Turkey
- 4.2. Israel
- 4.3. GCC
- 4.4. North Africa
- 4.5. South Africa
- 4.6. Rest of Middle East & Africa
-
5. Asia Pacific
- 5.1. China
- 5.2. India
- 5.3. Japan
- 5.4. South Korea
- 5.5. ASEAN
- 5.6. Oceania
- 5.7. Rest of Asia Pacific
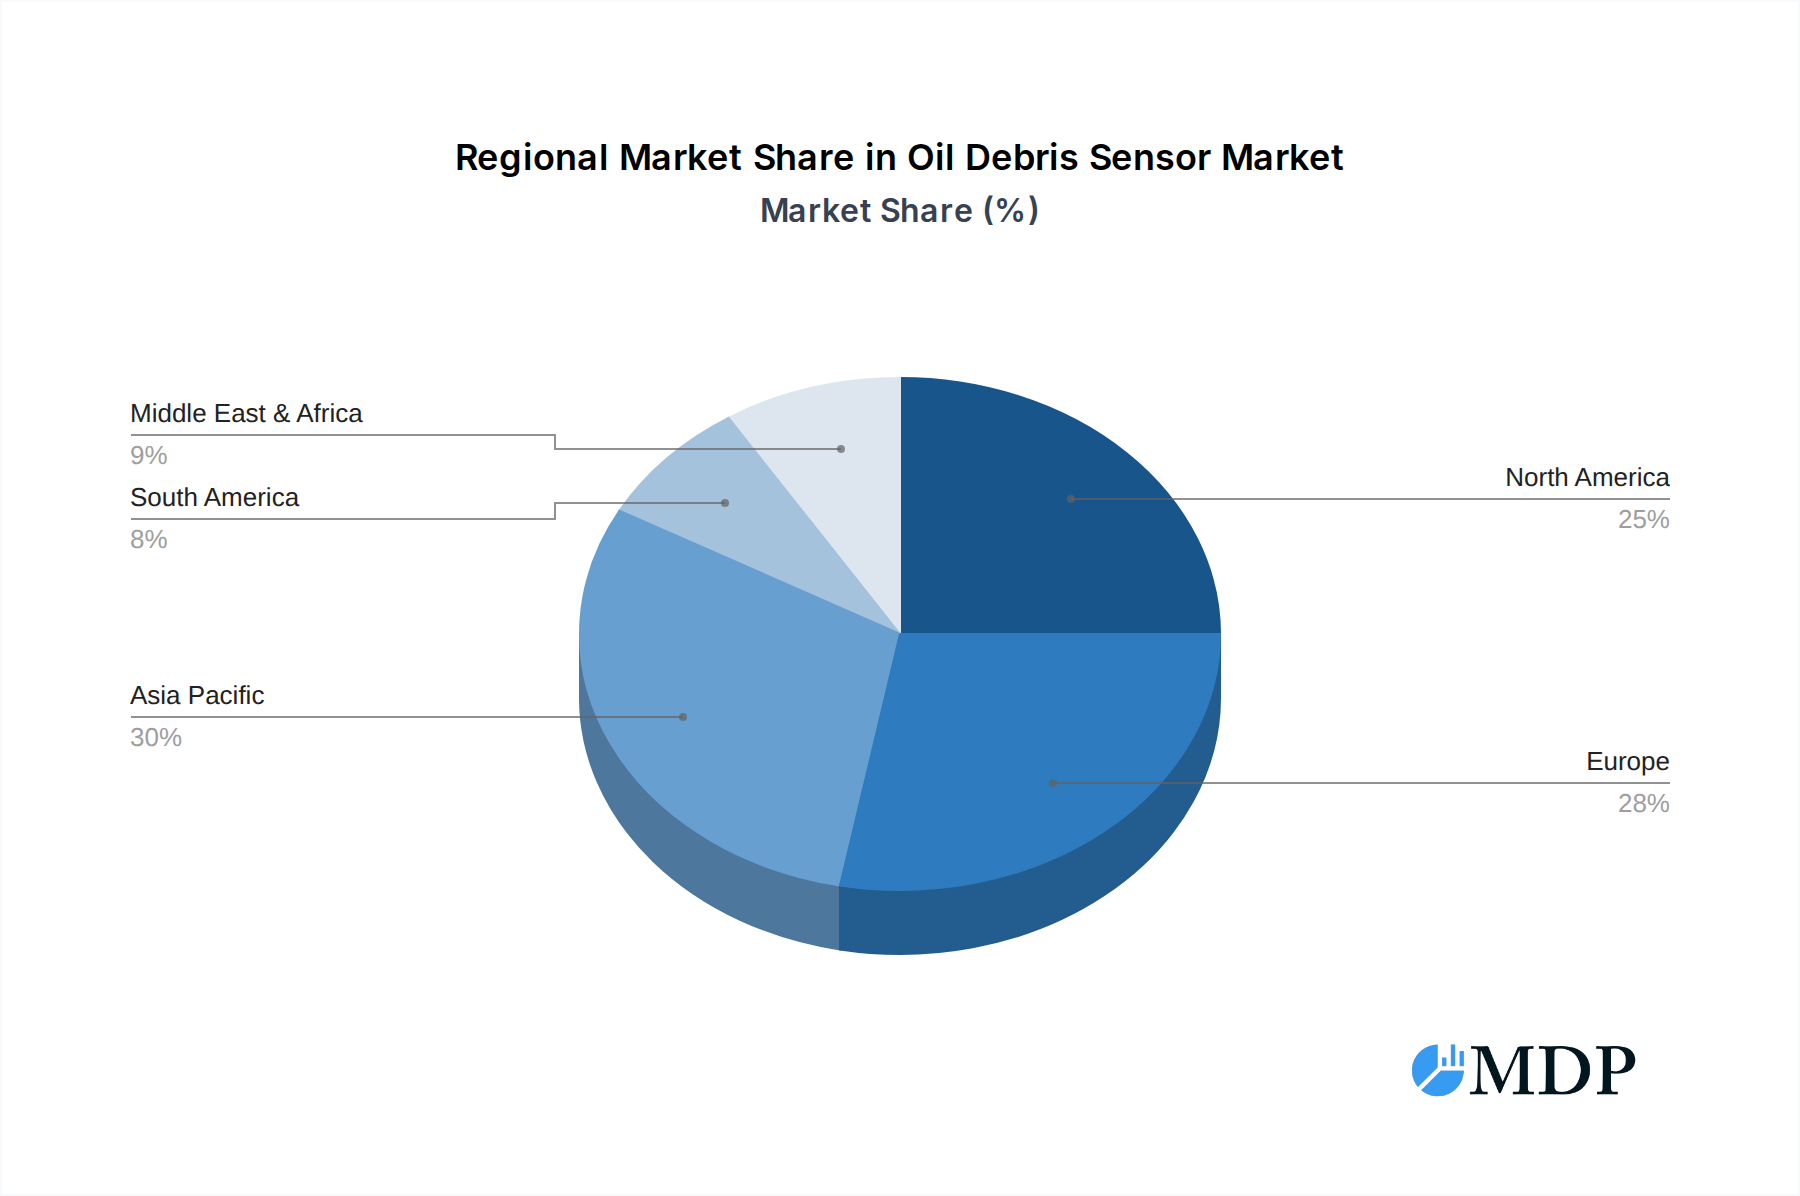
Oil Debris Sensor Regional Market Share
Geographic Coverage of Oil Debris Sensor
Oil Debris Sensor REPORT HIGHLIGHTS
| Aspects | Details |
|---|---|
| Study Period | 2020-2034 |
| Base Year | 2025 |
| Estimated Year | 2026 |
| Forecast Period | 2026-2034 |
| Historical Period | 2020-2025 |
| Growth Rate | CAGR of 7% from 2020-2034 |
| Segmentation |
|
Table of Contents
- 1. Introduction
- 1.1. Research Scope
- 1.2. Market Segmentation
- 1.3. Research Methodology
- 1.4. Definitions and Assumptions
- 2. Executive Summary
- 2.1. Introduction
- 3. Market Dynamics
- 3.1. Introduction
- 3.2. Market Drivers
- 3.3. Market Restrains
- 3.4. Market Trends
- 4. Market Factor Analysis
- 4.1. Porters Five Forces
- 4.2. Supply/Value Chain
- 4.3. PESTEL analysis
- 4.4. Market Entropy
- 4.5. Patent/Trademark Analysis
- 5. Global Oil Debris Sensor Analysis, Insights and Forecast, 2020-2032
- 5.1. Market Analysis, Insights and Forecast - by Application
- 5.1.1. Aviation
- 5.1.2. Power Plant
- 5.1.3. Ship
- 5.1.4. Others
- 5.2. Market Analysis, Insights and Forecast - by Type
- 5.2.1. With Display
- 5.2.2. Without Display
- 5.3. Market Analysis, Insights and Forecast - by Region
- 5.3.1. North America
- 5.3.2. South America
- 5.3.3. Europe
- 5.3.4. Middle East & Africa
- 5.3.5. Asia Pacific
- 5.1. Market Analysis, Insights and Forecast - by Application
- 6. North America Oil Debris Sensor Analysis, Insights and Forecast, 2020-2032
- 6.1. Market Analysis, Insights and Forecast - by Application
- 6.1.1. Aviation
- 6.1.2. Power Plant
- 6.1.3. Ship
- 6.1.4. Others
- 6.2. Market Analysis, Insights and Forecast - by Type
- 6.2.1. With Display
- 6.2.2. Without Display
- 6.1. Market Analysis, Insights and Forecast - by Application
- 7. South America Oil Debris Sensor Analysis, Insights and Forecast, 2020-2032
- 7.1. Market Analysis, Insights and Forecast - by Application
- 7.1.1. Aviation
- 7.1.2. Power Plant
- 7.1.3. Ship
- 7.1.4. Others
- 7.2. Market Analysis, Insights and Forecast - by Type
- 7.2.1. With Display
- 7.2.2. Without Display
- 7.1. Market Analysis, Insights and Forecast - by Application
- 8. Europe Oil Debris Sensor Analysis, Insights and Forecast, 2020-2032
- 8.1. Market Analysis, Insights and Forecast - by Application
- 8.1.1. Aviation
- 8.1.2. Power Plant
- 8.1.3. Ship
- 8.1.4. Others
- 8.2. Market Analysis, Insights and Forecast - by Type
- 8.2.1. With Display
- 8.2.2. Without Display
- 8.1. Market Analysis, Insights and Forecast - by Application
- 9. Middle East & Africa Oil Debris Sensor Analysis, Insights and Forecast, 2020-2032
- 9.1. Market Analysis, Insights and Forecast - by Application
- 9.1.1. Aviation
- 9.1.2. Power Plant
- 9.1.3. Ship
- 9.1.4. Others
- 9.2. Market Analysis, Insights and Forecast - by Type
- 9.2.1. With Display
- 9.2.2. Without Display
- 9.1. Market Analysis, Insights and Forecast - by Application
- 10. Asia Pacific Oil Debris Sensor Analysis, Insights and Forecast, 2020-2032
- 10.1. Market Analysis, Insights and Forecast - by Application
- 10.1.1. Aviation
- 10.1.2. Power Plant
- 10.1.3. Ship
- 10.1.4. Others
- 10.2. Market Analysis, Insights and Forecast - by Type
- 10.2.1. With Display
- 10.2.2. Without Display
- 10.1. Market Analysis, Insights and Forecast - by Application
- 11. Competitive Analysis
- 11.1. Global Market Share Analysis 2025
- 11.2. Company Profiles
- 11.2.1 Gill Sensors & Controls
- 11.2.1.1. Overview
- 11.2.1.2. Products
- 11.2.1.3. SWOT Analysis
- 11.2.1.4. Recent Developments
- 11.2.1.5. Financials (Based on Availability)
- 11.2.2 Parker Hannifin
- 11.2.2.1. Overview
- 11.2.2.2. Products
- 11.2.2.3. SWOT Analysis
- 11.2.2.4. Recent Developments
- 11.2.2.5. Financials (Based on Availability)
- 11.2.3 Poseidon Systems
- 11.2.3.1. Overview
- 11.2.3.2. Products
- 11.2.3.3. SWOT Analysis
- 11.2.3.4. Recent Developments
- 11.2.3.5. Financials (Based on Availability)
- 11.2.4 Eaton
- 11.2.4.1. Overview
- 11.2.4.2. Products
- 11.2.4.3. SWOT Analysis
- 11.2.4.4. Recent Developments
- 11.2.4.5. Financials (Based on Availability)
- 11.2.5 Gastops
- 11.2.5.1. Overview
- 11.2.5.2. Products
- 11.2.5.3. SWOT Analysis
- 11.2.5.4. Recent Developments
- 11.2.5.5. Financials (Based on Availability)
- 11.2.6 SKF
- 11.2.6.1. Overview
- 11.2.6.2. Products
- 11.2.6.3. SWOT Analysis
- 11.2.6.4. Recent Developments
- 11.2.6.5. Financials (Based on Availability)
- 11.2.7 Spectrum Instruments
- 11.2.7.1. Overview
- 11.2.7.2. Products
- 11.2.7.3. SWOT Analysis
- 11.2.7.4. Recent Developments
- 11.2.7.5. Financials (Based on Availability)
- 11.2.8 Parker Kittiwake
- 11.2.8.1. Overview
- 11.2.8.2. Products
- 11.2.8.3. SWOT Analysis
- 11.2.8.4. Recent Developments
- 11.2.8.5. Financials (Based on Availability)
- 11.2.9 CM Technologies GmbH
- 11.2.9.1. Overview
- 11.2.9.2. Products
- 11.2.9.3. SWOT Analysis
- 11.2.9.4. Recent Developments
- 11.2.9.5. Financials (Based on Availability)
- 11.2.10 Yateks
- 11.2.10.1. Overview
- 11.2.10.2. Products
- 11.2.10.3. SWOT Analysis
- 11.2.10.4. Recent Developments
- 11.2.10.5. Financials (Based on Availability)
- 11.2.1 Gill Sensors & Controls
List of Figures
- Figure 1: Global Oil Debris Sensor Revenue Breakdown (billion, %) by Region 2025 & 2033
- Figure 2: Global Oil Debris Sensor Volume Breakdown (K, %) by Region 2025 & 2033
- Figure 3: North America Oil Debris Sensor Revenue (billion), by Application 2025 & 2033
- Figure 4: North America Oil Debris Sensor Volume (K), by Application 2025 & 2033
- Figure 5: North America Oil Debris Sensor Revenue Share (%), by Application 2025 & 2033
- Figure 6: North America Oil Debris Sensor Volume Share (%), by Application 2025 & 2033
- Figure 7: North America Oil Debris Sensor Revenue (billion), by Type 2025 & 2033
- Figure 8: North America Oil Debris Sensor Volume (K), by Type 2025 & 2033
- Figure 9: North America Oil Debris Sensor Revenue Share (%), by Type 2025 & 2033
- Figure 10: North America Oil Debris Sensor Volume Share (%), by Type 2025 & 2033
- Figure 11: North America Oil Debris Sensor Revenue (billion), by Country 2025 & 2033
- Figure 12: North America Oil Debris Sensor Volume (K), by Country 2025 & 2033
- Figure 13: North America Oil Debris Sensor Revenue Share (%), by Country 2025 & 2033
- Figure 14: North America Oil Debris Sensor Volume Share (%), by Country 2025 & 2033
- Figure 15: South America Oil Debris Sensor Revenue (billion), by Application 2025 & 2033
- Figure 16: South America Oil Debris Sensor Volume (K), by Application 2025 & 2033
- Figure 17: South America Oil Debris Sensor Revenue Share (%), by Application 2025 & 2033
- Figure 18: South America Oil Debris Sensor Volume Share (%), by Application 2025 & 2033
- Figure 19: South America Oil Debris Sensor Revenue (billion), by Type 2025 & 2033
- Figure 20: South America Oil Debris Sensor Volume (K), by Type 2025 & 2033
- Figure 21: South America Oil Debris Sensor Revenue Share (%), by Type 2025 & 2033
- Figure 22: South America Oil Debris Sensor Volume Share (%), by Type 2025 & 2033
- Figure 23: South America Oil Debris Sensor Revenue (billion), by Country 2025 & 2033
- Figure 24: South America Oil Debris Sensor Volume (K), by Country 2025 & 2033
- Figure 25: South America Oil Debris Sensor Revenue Share (%), by Country 2025 & 2033
- Figure 26: South America Oil Debris Sensor Volume Share (%), by Country 2025 & 2033
- Figure 27: Europe Oil Debris Sensor Revenue (billion), by Application 2025 & 2033
- Figure 28: Europe Oil Debris Sensor Volume (K), by Application 2025 & 2033
- Figure 29: Europe Oil Debris Sensor Revenue Share (%), by Application 2025 & 2033
- Figure 30: Europe Oil Debris Sensor Volume Share (%), by Application 2025 & 2033
- Figure 31: Europe Oil Debris Sensor Revenue (billion), by Type 2025 & 2033
- Figure 32: Europe Oil Debris Sensor Volume (K), by Type 2025 & 2033
- Figure 33: Europe Oil Debris Sensor Revenue Share (%), by Type 2025 & 2033
- Figure 34: Europe Oil Debris Sensor Volume Share (%), by Type 2025 & 2033
- Figure 35: Europe Oil Debris Sensor Revenue (billion), by Country 2025 & 2033
- Figure 36: Europe Oil Debris Sensor Volume (K), by Country 2025 & 2033
- Figure 37: Europe Oil Debris Sensor Revenue Share (%), by Country 2025 & 2033
- Figure 38: Europe Oil Debris Sensor Volume Share (%), by Country 2025 & 2033
- Figure 39: Middle East & Africa Oil Debris Sensor Revenue (billion), by Application 2025 & 2033
- Figure 40: Middle East & Africa Oil Debris Sensor Volume (K), by Application 2025 & 2033
- Figure 41: Middle East & Africa Oil Debris Sensor Revenue Share (%), by Application 2025 & 2033
- Figure 42: Middle East & Africa Oil Debris Sensor Volume Share (%), by Application 2025 & 2033
- Figure 43: Middle East & Africa Oil Debris Sensor Revenue (billion), by Type 2025 & 2033
- Figure 44: Middle East & Africa Oil Debris Sensor Volume (K), by Type 2025 & 2033
- Figure 45: Middle East & Africa Oil Debris Sensor Revenue Share (%), by Type 2025 & 2033
- Figure 46: Middle East & Africa Oil Debris Sensor Volume Share (%), by Type 2025 & 2033
- Figure 47: Middle East & Africa Oil Debris Sensor Revenue (billion), by Country 2025 & 2033
- Figure 48: Middle East & Africa Oil Debris Sensor Volume (K), by Country 2025 & 2033
- Figure 49: Middle East & Africa Oil Debris Sensor Revenue Share (%), by Country 2025 & 2033
- Figure 50: Middle East & Africa Oil Debris Sensor Volume Share (%), by Country 2025 & 2033
- Figure 51: Asia Pacific Oil Debris Sensor Revenue (billion), by Application 2025 & 2033
- Figure 52: Asia Pacific Oil Debris Sensor Volume (K), by Application 2025 & 2033
- Figure 53: Asia Pacific Oil Debris Sensor Revenue Share (%), by Application 2025 & 2033
- Figure 54: Asia Pacific Oil Debris Sensor Volume Share (%), by Application 2025 & 2033
- Figure 55: Asia Pacific Oil Debris Sensor Revenue (billion), by Type 2025 & 2033
- Figure 56: Asia Pacific Oil Debris Sensor Volume (K), by Type 2025 & 2033
- Figure 57: Asia Pacific Oil Debris Sensor Revenue Share (%), by Type 2025 & 2033
- Figure 58: Asia Pacific Oil Debris Sensor Volume Share (%), by Type 2025 & 2033
- Figure 59: Asia Pacific Oil Debris Sensor Revenue (billion), by Country 2025 & 2033
- Figure 60: Asia Pacific Oil Debris Sensor Volume (K), by Country 2025 & 2033
- Figure 61: Asia Pacific Oil Debris Sensor Revenue Share (%), by Country 2025 & 2033
- Figure 62: Asia Pacific Oil Debris Sensor Volume Share (%), by Country 2025 & 2033
List of Tables
- Table 1: Global Oil Debris Sensor Revenue billion Forecast, by Application 2020 & 2033
- Table 2: Global Oil Debris Sensor Volume K Forecast, by Application 2020 & 2033
- Table 3: Global Oil Debris Sensor Revenue billion Forecast, by Type 2020 & 2033
- Table 4: Global Oil Debris Sensor Volume K Forecast, by Type 2020 & 2033
- Table 5: Global Oil Debris Sensor Revenue billion Forecast, by Region 2020 & 2033
- Table 6: Global Oil Debris Sensor Volume K Forecast, by Region 2020 & 2033
- Table 7: Global Oil Debris Sensor Revenue billion Forecast, by Application 2020 & 2033
- Table 8: Global Oil Debris Sensor Volume K Forecast, by Application 2020 & 2033
- Table 9: Global Oil Debris Sensor Revenue billion Forecast, by Type 2020 & 2033
- Table 10: Global Oil Debris Sensor Volume K Forecast, by Type 2020 & 2033
- Table 11: Global Oil Debris Sensor Revenue billion Forecast, by Country 2020 & 2033
- Table 12: Global Oil Debris Sensor Volume K Forecast, by Country 2020 & 2033
- Table 13: United States Oil Debris Sensor Revenue (billion) Forecast, by Application 2020 & 2033
- Table 14: United States Oil Debris Sensor Volume (K) Forecast, by Application 2020 & 2033
- Table 15: Canada Oil Debris Sensor Revenue (billion) Forecast, by Application 2020 & 2033
- Table 16: Canada Oil Debris Sensor Volume (K) Forecast, by Application 2020 & 2033
- Table 17: Mexico Oil Debris Sensor Revenue (billion) Forecast, by Application 2020 & 2033
- Table 18: Mexico Oil Debris Sensor Volume (K) Forecast, by Application 2020 & 2033
- Table 19: Global Oil Debris Sensor Revenue billion Forecast, by Application 2020 & 2033
- Table 20: Global Oil Debris Sensor Volume K Forecast, by Application 2020 & 2033
- Table 21: Global Oil Debris Sensor Revenue billion Forecast, by Type 2020 & 2033
- Table 22: Global Oil Debris Sensor Volume K Forecast, by Type 2020 & 2033
- Table 23: Global Oil Debris Sensor Revenue billion Forecast, by Country 2020 & 2033
- Table 24: Global Oil Debris Sensor Volume K Forecast, by Country 2020 & 2033
- Table 25: Brazil Oil Debris Sensor Revenue (billion) Forecast, by Application 2020 & 2033
- Table 26: Brazil Oil Debris Sensor Volume (K) Forecast, by Application 2020 & 2033
- Table 27: Argentina Oil Debris Sensor Revenue (billion) Forecast, by Application 2020 & 2033
- Table 28: Argentina Oil Debris Sensor Volume (K) Forecast, by Application 2020 & 2033
- Table 29: Rest of South America Oil Debris Sensor Revenue (billion) Forecast, by Application 2020 & 2033
- Table 30: Rest of South America Oil Debris Sensor Volume (K) Forecast, by Application 2020 & 2033
- Table 31: Global Oil Debris Sensor Revenue billion Forecast, by Application 2020 & 2033
- Table 32: Global Oil Debris Sensor Volume K Forecast, by Application 2020 & 2033
- Table 33: Global Oil Debris Sensor Revenue billion Forecast, by Type 2020 & 2033
- Table 34: Global Oil Debris Sensor Volume K Forecast, by Type 2020 & 2033
- Table 35: Global Oil Debris Sensor Revenue billion Forecast, by Country 2020 & 2033
- Table 36: Global Oil Debris Sensor Volume K Forecast, by Country 2020 & 2033
- Table 37: United Kingdom Oil Debris Sensor Revenue (billion) Forecast, by Application 2020 & 2033
- Table 38: United Kingdom Oil Debris Sensor Volume (K) Forecast, by Application 2020 & 2033
- Table 39: Germany Oil Debris Sensor Revenue (billion) Forecast, by Application 2020 & 2033
- Table 40: Germany Oil Debris Sensor Volume (K) Forecast, by Application 2020 & 2033
- Table 41: France Oil Debris Sensor Revenue (billion) Forecast, by Application 2020 & 2033
- Table 42: France Oil Debris Sensor Volume (K) Forecast, by Application 2020 & 2033
- Table 43: Italy Oil Debris Sensor Revenue (billion) Forecast, by Application 2020 & 2033
- Table 44: Italy Oil Debris Sensor Volume (K) Forecast, by Application 2020 & 2033
- Table 45: Spain Oil Debris Sensor Revenue (billion) Forecast, by Application 2020 & 2033
- Table 46: Spain Oil Debris Sensor Volume (K) Forecast, by Application 2020 & 2033
- Table 47: Russia Oil Debris Sensor Revenue (billion) Forecast, by Application 2020 & 2033
- Table 48: Russia Oil Debris Sensor Volume (K) Forecast, by Application 2020 & 2033
- Table 49: Benelux Oil Debris Sensor Revenue (billion) Forecast, by Application 2020 & 2033
- Table 50: Benelux Oil Debris Sensor Volume (K) Forecast, by Application 2020 & 2033
- Table 51: Nordics Oil Debris Sensor Revenue (billion) Forecast, by Application 2020 & 2033
- Table 52: Nordics Oil Debris Sensor Volume (K) Forecast, by Application 2020 & 2033
- Table 53: Rest of Europe Oil Debris Sensor Revenue (billion) Forecast, by Application 2020 & 2033
- Table 54: Rest of Europe Oil Debris Sensor Volume (K) Forecast, by Application 2020 & 2033
- Table 55: Global Oil Debris Sensor Revenue billion Forecast, by Application 2020 & 2033
- Table 56: Global Oil Debris Sensor Volume K Forecast, by Application 2020 & 2033
- Table 57: Global Oil Debris Sensor Revenue billion Forecast, by Type 2020 & 2033
- Table 58: Global Oil Debris Sensor Volume K Forecast, by Type 2020 & 2033
- Table 59: Global Oil Debris Sensor Revenue billion Forecast, by Country 2020 & 2033
- Table 60: Global Oil Debris Sensor Volume K Forecast, by Country 2020 & 2033
- Table 61: Turkey Oil Debris Sensor Revenue (billion) Forecast, by Application 2020 & 2033
- Table 62: Turkey Oil Debris Sensor Volume (K) Forecast, by Application 2020 & 2033
- Table 63: Israel Oil Debris Sensor Revenue (billion) Forecast, by Application 2020 & 2033
- Table 64: Israel Oil Debris Sensor Volume (K) Forecast, by Application 2020 & 2033
- Table 65: GCC Oil Debris Sensor Revenue (billion) Forecast, by Application 2020 & 2033
- Table 66: GCC Oil Debris Sensor Volume (K) Forecast, by Application 2020 & 2033
- Table 67: North Africa Oil Debris Sensor Revenue (billion) Forecast, by Application 2020 & 2033
- Table 68: North Africa Oil Debris Sensor Volume (K) Forecast, by Application 2020 & 2033
- Table 69: South Africa Oil Debris Sensor Revenue (billion) Forecast, by Application 2020 & 2033
- Table 70: South Africa Oil Debris Sensor Volume (K) Forecast, by Application 2020 & 2033
- Table 71: Rest of Middle East & Africa Oil Debris Sensor Revenue (billion) Forecast, by Application 2020 & 2033
- Table 72: Rest of Middle East & Africa Oil Debris Sensor Volume (K) Forecast, by Application 2020 & 2033
- Table 73: Global Oil Debris Sensor Revenue billion Forecast, by Application 2020 & 2033
- Table 74: Global Oil Debris Sensor Volume K Forecast, by Application 2020 & 2033
- Table 75: Global Oil Debris Sensor Revenue billion Forecast, by Type 2020 & 2033
- Table 76: Global Oil Debris Sensor Volume K Forecast, by Type 2020 & 2033
- Table 77: Global Oil Debris Sensor Revenue billion Forecast, by Country 2020 & 2033
- Table 78: Global Oil Debris Sensor Volume K Forecast, by Country 2020 & 2033
- Table 79: China Oil Debris Sensor Revenue (billion) Forecast, by Application 2020 & 2033
- Table 80: China Oil Debris Sensor Volume (K) Forecast, by Application 2020 & 2033
- Table 81: India Oil Debris Sensor Revenue (billion) Forecast, by Application 2020 & 2033
- Table 82: India Oil Debris Sensor Volume (K) Forecast, by Application 2020 & 2033
- Table 83: Japan Oil Debris Sensor Revenue (billion) Forecast, by Application 2020 & 2033
- Table 84: Japan Oil Debris Sensor Volume (K) Forecast, by Application 2020 & 2033
- Table 85: South Korea Oil Debris Sensor Revenue (billion) Forecast, by Application 2020 & 2033
- Table 86: South Korea Oil Debris Sensor Volume (K) Forecast, by Application 2020 & 2033
- Table 87: ASEAN Oil Debris Sensor Revenue (billion) Forecast, by Application 2020 & 2033
- Table 88: ASEAN Oil Debris Sensor Volume (K) Forecast, by Application 2020 & 2033
- Table 89: Oceania Oil Debris Sensor Revenue (billion) Forecast, by Application 2020 & 2033
- Table 90: Oceania Oil Debris Sensor Volume (K) Forecast, by Application 2020 & 2033
- Table 91: Rest of Asia Pacific Oil Debris Sensor Revenue (billion) Forecast, by Application 2020 & 2033
- Table 92: Rest of Asia Pacific Oil Debris Sensor Volume (K) Forecast, by Application 2020 & 2033
Frequently Asked Questions
1. What is the projected Compound Annual Growth Rate (CAGR) of the Oil Debris Sensor?
The projected CAGR is approximately 7%.
2. Which companies are prominent players in the Oil Debris Sensor?
Key companies in the market include Gill Sensors & Controls, Parker Hannifin, Poseidon Systems, Eaton, Gastops, SKF, Spectrum Instruments, Parker Kittiwake, CM Technologies GmbH, Yateks.
3. What are the main segments of the Oil Debris Sensor?
The market segments include Application, Type.
4. Can you provide details about the market size?
The market size is estimated to be USD 1.27 billion as of 2022.
5. What are some drivers contributing to market growth?
N/A
6. What are the notable trends driving market growth?
N/A
7. Are there any restraints impacting market growth?
N/A
8. Can you provide examples of recent developments in the market?
N/A
9. What pricing options are available for accessing the report?
Pricing options include single-user, multi-user, and enterprise licenses priced at USD 3950.00, USD 5925.00, and USD 7900.00 respectively.
10. Is the market size provided in terms of value or volume?
The market size is provided in terms of value, measured in billion and volume, measured in K.
11. Are there any specific market keywords associated with the report?
Yes, the market keyword associated with the report is "Oil Debris Sensor," which aids in identifying and referencing the specific market segment covered.
12. How do I determine which pricing option suits my needs best?
The pricing options vary based on user requirements and access needs. Individual users may opt for single-user licenses, while businesses requiring broader access may choose multi-user or enterprise licenses for cost-effective access to the report.
13. Are there any additional resources or data provided in the Oil Debris Sensor report?
While the report offers comprehensive insights, it's advisable to review the specific contents or supplementary materials provided to ascertain if additional resources or data are available.
14. How can I stay updated on further developments or reports in the Oil Debris Sensor?
To stay informed about further developments, trends, and reports in the Oil Debris Sensor, consider subscribing to industry newsletters, following relevant companies and organizations, or regularly checking reputable industry news sources and publications.
Methodology
Step 1 - Identification of Relevant Samples Size from Population Database


Step 2 - Approaches for Defining Global Market Size (Value, Volume* & Price*)

Note*: In applicable scenarios
Step 3 - Data Sources
Primary Research
- Web Analytics
- Survey Reports
- Research Institute
- Latest Research Reports
- Opinion Leaders
Secondary Research
- Annual Reports
- White Paper
- Latest Press Release
- Industry Association
- Paid Database
- Investor Presentations

Step 4 - Data Triangulation
Involves using different sources of information in order to increase the validity of a study
These sources are likely to be stakeholders in a program - participants, other researchers, program staff, other community members, and so on.
Then we put all data in single framework & apply various statistical tools to find out the dynamic on the market.
During the analysis stage, feedback from the stakeholder groups would be compared to determine areas of agreement as well as areas of divergence