

Key Insights
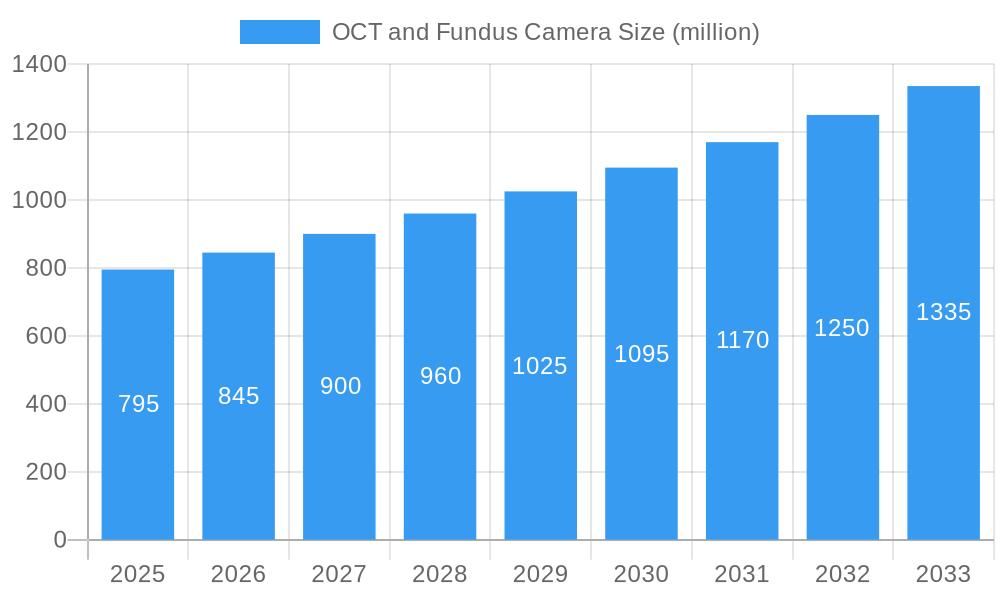
The Optical Coherence Tomography (OCT) and Fundus Camera market, valued at $654.1 million in 2025, is projected for substantial growth with a Compound Annual Growth Rate (CAGR) of 6%. This expansion is driven by the increasing incidence of age-related eye conditions such as macular degeneration and diabetic retinopathy, alongside a growing elderly global population. Technological advancements, including the integration of Artificial Intelligence (AI) and machine learning for enhanced image analysis and diagnostics, are key growth catalysts. The rising adoption of OCT and Fundus Camera systems in ophthalmology settings and hospitals, supported by improved accessibility and affordability, further fuels market dynamics. Miniaturization and portability are extending device utility into remote areas and telemedicine, broadening market reach. However, the substantial cost of advanced systems and the requirement for skilled personnel present market restraints. Key market participants, including Zeiss, Topcon, Nikon (Optos), Kowa, Nidek, Heidelberg Engineering, Optovue, and Optomed, are focused on continuous innovation and product portfolio expansion to secure market share. Market segmentation is anticipated across device types (e.g., spectral-domain OCT, swept-source OCT, advanced fundus cameras) and end-user segments (hospitals, clinics, research institutions). Geographically, North America and Europe are expected to maintain a strong presence, with Asia-Pacific exhibiting accelerated growth.
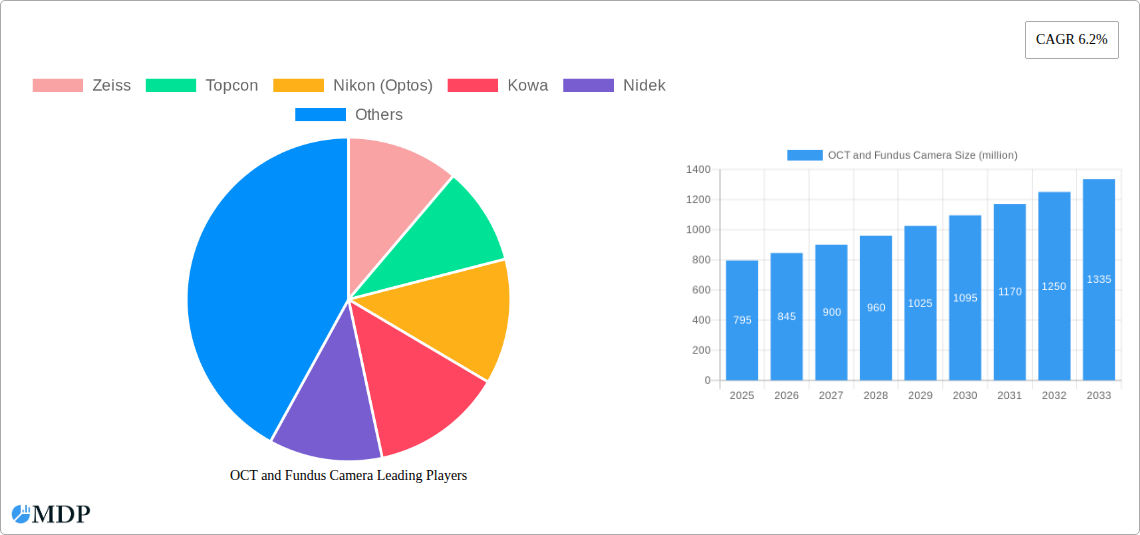
OCT and Fundus Camera Market Size (In Million)
The market's future trajectory is significantly shaped by the ongoing development of sophisticated imaging techniques, seamless integration with Electronic Health Records (EHR), and user-friendly interfaces for efficient diagnosis. Regulatory approvals and reimbursement policies will critically influence market access and adoption rates globally. The introduction of novel diagnostic capabilities, such as combined OCT and angiography systems for comprehensive retinal assessment, and the expansion of OCT applications beyond ophthalmology, will also drive market growth. Competitive pressures are expected to foster innovation, potentially leading to price reductions and increased accessibility of these vital diagnostic tools for healthcare providers and patients worldwide. The long-term outlook for the OCT and Fundus Camera market remains highly positive, indicating significant growth potential over the forecast period.
OCT and Fundus Camera Company Market Share
Unlocking Growth in the Multi-Million Dollar OCT and Fundus Camera Market: A Comprehensive Report (2019-2033)
This comprehensive report delivers actionable insights into the dynamic OCT and Fundus Camera market, projecting a market value exceeding $XX million by 2033. It provides a deep dive into market dynamics, competitive landscapes, technological advancements, and future growth opportunities, covering the period from 2019 to 2033. This report is essential for stakeholders including manufacturers, investors, and healthcare professionals seeking to navigate this rapidly evolving sector. The report leverages rigorous data analysis to provide a clear and concise understanding of the market's trajectory.
OCT and Fundus Camera Market Dynamics & Concentration
The global OCT and Fundus Camera market, valued at $XX million in 2025, is experiencing robust growth driven by technological advancements and increasing prevalence of ophthalmologic diseases. Market concentration is moderate, with key players such as Zeiss, Topcon, Nikon (Optos), Kowa, Nidek, Heidelberg Engineering, Optovue, and Optomed holding significant shares. However, the market is witnessing increased competition from emerging players and innovative startups. Stringent regulatory frameworks, particularly concerning medical device approvals, impact market entry and expansion. The market is also influenced by the availability of substitute technologies and evolving end-user preferences, favoring portable and user-friendly devices. M&A activity has been moderate, with approximately XX deals recorded between 2019 and 2024, reflecting strategic consolidation and expansion efforts within the sector.
- Market Share: Zeiss holds approximately XX% market share, followed by Topcon at XX%, Nikon (Optos) at XX%, and other players accounting for the remaining share.
- M&A Activity: The forecast indicates an increase in M&A activity with XX deals projected for 2025-2033, driven by a need for technological advancements and market expansion.
- Innovation Drivers: Miniaturization, improved image quality, AI integration, and cloud-based data management are key drivers of innovation.
OCT and Fundus Camera Industry Trends & Analysis
The OCT and Fundus Camera market exhibits a CAGR of XX% during the forecast period (2025-2033), driven primarily by the rising prevalence of age-related macular degeneration (AMD), diabetic retinopathy, glaucoma, and other ophthalmic conditions. Technological advancements, such as the integration of Artificial Intelligence (AI) for improved diagnostic accuracy and automation, are significantly impacting market growth. The increasing adoption of teleophthalmology and the growing preference for non-invasive diagnostic tools contribute to market expansion. Competitive dynamics are intense, with established players focusing on product innovation and strategic partnerships to maintain their market share. Market penetration rates are highest in developed regions due to factors including robust healthcare infrastructure and higher disposable incomes. The market shows strong growth potential in developing economies with expanding healthcare sectors.
Leading Markets & Segments in OCT and Fundus Camera
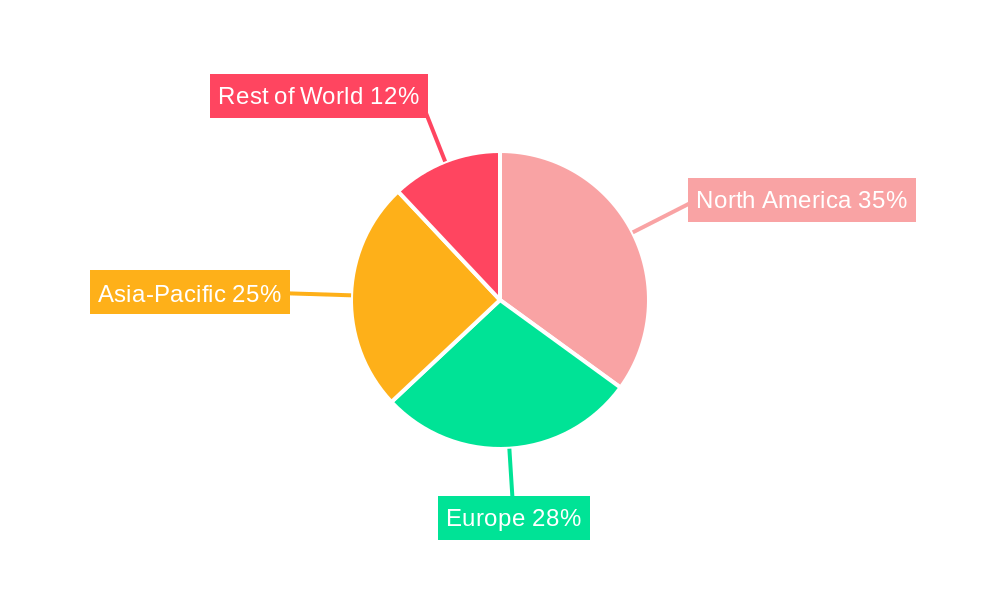
North America dominates the global OCT and Fundus Camera market, driven by factors including high healthcare expenditure, advanced medical infrastructure, and a large geriatric population susceptible to age-related eye diseases. Europe follows as a significant market, exhibiting substantial growth due to increasing adoption of advanced diagnostic technologies and favorable healthcare policies. Asia-Pacific is poised for significant growth, fueled by rapidly expanding healthcare infrastructure and rising prevalence of ophthalmologic diseases. The key segments within the market include handheld devices, tabletop systems, and software solutions. Handheld devices are gaining popularity due to their portability and ease of use in remote areas, although tabletop systems still hold a larger market share due to advanced functionalities.
- North America: High healthcare expenditure, advanced infrastructure, and a large geriatric population are major contributing factors to market dominance.
- Europe: Strong regulatory environment and growing adoption of advanced diagnostic technologies fuel market expansion.
- Asia-Pacific: Rapidly expanding healthcare infrastructure and increasing prevalence of ophthalmologic conditions drive significant growth potential.
OCT and Fundus Camera Product Developments
Recent product developments focus on enhancing image quality, improving user interface, and integrating AI for automated analysis. Miniaturized and portable devices are gaining traction, offering increased accessibility and convenience. The integration of cloud-based platforms enables seamless data sharing and remote diagnostics, improving healthcare delivery efficiency. These advancements enhance diagnostic capabilities, improve patient outcomes, and increase the overall efficiency of ophthalmologic practices.
Key Drivers of OCT and Fundus Camera Growth
Technological advancements such as AI integration for improved diagnostic accuracy and automation are key drivers. The increasing prevalence of age-related eye diseases globally fuels demand. Favorable regulatory landscapes in several regions support market expansion. Growing adoption of teleophthalmology and the rising demand for non-invasive diagnostic tools further boost market growth. The increasing awareness among patients and healthcare professionals of the benefits of early diagnosis and treatment contributes to increased market demand.
Challenges in the OCT and Fundus Camera Market
High initial investment costs associated with purchasing advanced equipment present a barrier for smaller healthcare facilities. The complex regulatory approval processes for new medical devices can slow down market entry and expansion. Competition among existing players and the emergence of new entrants create intense competitive pressure. Supply chain disruptions can affect the availability of components and impact manufacturing timelines.
Emerging Opportunities in OCT and Fundus Camera
Advancements in AI and machine learning offer significant potential for enhancing diagnostic accuracy and automating workflows. Strategic partnerships between device manufacturers and healthcare providers can drive market penetration and adoption. Expansion into emerging markets with growing healthcare infrastructure presents significant growth opportunities. Development of cost-effective and portable devices can expand accessibility to wider populations.
Leading Players in the OCT and Fundus Camera Sector
- Zeiss
- Topcon
- Nikon (Optos)
- Kowa
- Nidek
- Heidelberg Engineering
- Optovue
- Optomed
Key Milestones in OCT and Fundus Camera Industry
- 2020: FDA approval of AI-powered diagnostic software for retinal imaging.
- 2022: Launch of a new generation of portable OCT devices with enhanced image quality.
- 2023: Several strategic partnerships between device manufacturers and healthcare providers to expand market reach.
- 2024: Significant investments in research and development for next-generation OCT technologies.
Strategic Outlook for OCT and Fundus Camera Market
The OCT and Fundus Camera market is poised for robust growth, driven by technological innovation and increasing demand. Strategic partnerships, focused investments in R&D, and expansion into underserved markets present significant opportunities for industry players. The increasing adoption of telemedicine and the growing emphasis on preventative healthcare will further accelerate market growth in the coming years, resulting in a substantial market expansion by 2033.
OCT and Fundus Camera Segmentation
-
1. Application
- 1.1. Hospital
- 1.2. Eye Clinic
- 1.3. Other
-
2. Types
- 2.1. OCT
- 2.2. Fundus Camera
OCT and Fundus Camera Segmentation By Geography
-
1. North America
- 1.1. United States
- 1.2. Canada
- 1.3. Mexico
-
2. South America
- 2.1. Brazil
- 2.2. Argentina
- 2.3. Rest of South America
-
3. Europe
- 3.1. United Kingdom
- 3.2. Germany
- 3.3. France
- 3.4. Italy
- 3.5. Spain
- 3.6. Russia
- 3.7. Benelux
- 3.8. Nordics
- 3.9. Rest of Europe
-
4. Middle East & Africa
- 4.1. Turkey
- 4.2. Israel
- 4.3. GCC
- 4.4. North Africa
- 4.5. South Africa
- 4.6. Rest of Middle East & Africa
-
5. Asia Pacific
- 5.1. China
- 5.2. India
- 5.3. Japan
- 5.4. South Korea
- 5.5. ASEAN
- 5.6. Oceania
- 5.7. Rest of Asia Pacific
OCT and Fundus Camera Regional Market Share
Geographic Coverage of OCT and Fundus Camera
OCT and Fundus Camera REPORT HIGHLIGHTS
| Aspects | Details |
|---|---|
| Study Period | 2020-2034 |
| Base Year | 2025 |
| Estimated Year | 2026 |
| Forecast Period | 2026-2034 |
| Historical Period | 2020-2025 |
| Growth Rate | CAGR of 6% from 2020-2034 |
| Segmentation |
|
Table of Contents
- 1. Introduction
- 1.1. Research Scope
- 1.2. Market Segmentation
- 1.3. Research Objective
- 1.4. Definitions and Assumptions
- 2. Executive Summary
- 2.1. Market Snapshot
- 3. Market Dynamics
- 3.1. Market Drivers
- 3.2. Market Restrains
- 3.3. Market Trends
- 3.4. Market Opportunities
- 4. Market Factor Analysis
- 4.1. Porters Five Forces
- 4.1.1. Bargaining Power of Suppliers
- 4.1.2. Bargaining Power of Buyers
- 4.1.3. Threat of New Entrants
- 4.1.4. Threat of Substitutes
- 4.1.5. Competitive Rivalry
- 4.2. PESTEL analysis
- 4.3. BCG Analysis
- 4.3.1. Stars (High Growth, High Market Share)
- 4.3.2. Cash Cows (Low Growth, High Market Share)
- 4.3.3. Question Mark (High Growth, Low Market Share)
- 4.3.4. Dogs (Low Growth, Low Market Share)
- 4.4. Ansoff Matrix Analysis
- 4.5. Supply Chain Analysis
- 4.6. Regulatory Landscape
- 4.7. Current Market Potential and Opportunity Assessment (TAM–SAM–SOM Framework)
- 4.8. MDP Analyst Note
- 4.1. Porters Five Forces
- 5. Market Analysis, Insights and Forecast 2021-2033
- 5.1. Market Analysis, Insights and Forecast - by Application
- 5.1.1. Hospital
- 5.1.2. Eye Clinic
- 5.1.3. Other
- 5.2. Market Analysis, Insights and Forecast - by Types
- 5.2.1. OCT
- 5.2.2. Fundus Camera
- 5.3. Market Analysis, Insights and Forecast - by Region
- 5.3.1. North America
- 5.3.2. South America
- 5.3.3. Europe
- 5.3.4. Middle East & Africa
- 5.3.5. Asia Pacific
- 5.1. Market Analysis, Insights and Forecast - by Application
- 6. Global OCT and Fundus Camera Analysis, Insights and Forecast, 2021-2033
- 6.1. Market Analysis, Insights and Forecast - by Application
- 6.1.1. Hospital
- 6.1.2. Eye Clinic
- 6.1.3. Other
- 6.2. Market Analysis, Insights and Forecast - by Types
- 6.2.1. OCT
- 6.2.2. Fundus Camera
- 6.1. Market Analysis, Insights and Forecast - by Application
- 7. North America OCT and Fundus Camera Analysis, Insights and Forecast, 2020-2032
- 7.1. Market Analysis, Insights and Forecast - by Application
- 7.1.1. Hospital
- 7.1.2. Eye Clinic
- 7.1.3. Other
- 7.2. Market Analysis, Insights and Forecast - by Types
- 7.2.1. OCT
- 7.2.2. Fundus Camera
- 7.1. Market Analysis, Insights and Forecast - by Application
- 8. South America OCT and Fundus Camera Analysis, Insights and Forecast, 2020-2032
- 8.1. Market Analysis, Insights and Forecast - by Application
- 8.1.1. Hospital
- 8.1.2. Eye Clinic
- 8.1.3. Other
- 8.2. Market Analysis, Insights and Forecast - by Types
- 8.2.1. OCT
- 8.2.2. Fundus Camera
- 8.1. Market Analysis, Insights and Forecast - by Application
- 9. Europe OCT and Fundus Camera Analysis, Insights and Forecast, 2020-2032
- 9.1. Market Analysis, Insights and Forecast - by Application
- 9.1.1. Hospital
- 9.1.2. Eye Clinic
- 9.1.3. Other
- 9.2. Market Analysis, Insights and Forecast - by Types
- 9.2.1. OCT
- 9.2.2. Fundus Camera
- 9.1. Market Analysis, Insights and Forecast - by Application
- 10. Middle East & Africa OCT and Fundus Camera Analysis, Insights and Forecast, 2020-2032
- 10.1. Market Analysis, Insights and Forecast - by Application
- 10.1.1. Hospital
- 10.1.2. Eye Clinic
- 10.1.3. Other
- 10.2. Market Analysis, Insights and Forecast - by Types
- 10.2.1. OCT
- 10.2.2. Fundus Camera
- 10.1. Market Analysis, Insights and Forecast - by Application
- 11. Asia Pacific OCT and Fundus Camera Analysis, Insights and Forecast, 2020-2032
- 11.1. Market Analysis, Insights and Forecast - by Application
- 11.1.1. Hospital
- 11.1.2. Eye Clinic
- 11.1.3. Other
- 11.2. Market Analysis, Insights and Forecast - by Types
- 11.2.1. OCT
- 11.2.2. Fundus Camera
- 11.1. Market Analysis, Insights and Forecast - by Application
- 12. Competitive Analysis
- 12.1. Company Profiles
- 12.1.1 Zeiss
- 12.1.1.1. Company Overview
- 12.1.1.2. Products
- 12.1.1.3. Company Financials
- 12.1.1.4. SWOT Analysis
- 12.1.2 Topcon
- 12.1.2.1. Company Overview
- 12.1.2.2. Products
- 12.1.2.3. Company Financials
- 12.1.2.4. SWOT Analysis
- 12.1.3 Nikon (Optos)
- 12.1.3.1. Company Overview
- 12.1.3.2. Products
- 12.1.3.3. Company Financials
- 12.1.3.4. SWOT Analysis
- 12.1.4 Kowa
- 12.1.4.1. Company Overview
- 12.1.4.2. Products
- 12.1.4.3. Company Financials
- 12.1.4.4. SWOT Analysis
- 12.1.5 Nidek
- 12.1.5.1. Company Overview
- 12.1.5.2. Products
- 12.1.5.3. Company Financials
- 12.1.5.4. SWOT Analysis
- 12.1.6 Heidelberg Engineering
- 12.1.6.1. Company Overview
- 12.1.6.2. Products
- 12.1.6.3. Company Financials
- 12.1.6.4. SWOT Analysis
- 12.1.7 Optovue
- 12.1.7.1. Company Overview
- 12.1.7.2. Products
- 12.1.7.3. Company Financials
- 12.1.7.4. SWOT Analysis
- 12.1.8 Optomed
- 12.1.8.1. Company Overview
- 12.1.8.2. Products
- 12.1.8.3. Company Financials
- 12.1.8.4. SWOT Analysis
- 12.1.1 Zeiss
- 12.2. Market Entropy
- 12.2.1 Company's Key Areas Served
- 12.2.2 Recent Developments
- 12.3. Company Market Share Analysis 2025
- 12.3.1 Top 5 Companies Market Share Analysis
- 12.3.2 Top 3 Companies Market Share Analysis
- 12.4. List of Potential Customers
- 13. Research Methodology
List of Figures
- Figure 1: Global OCT and Fundus Camera Revenue Breakdown (million, %) by Region 2025 & 2033
- Figure 2: Global OCT and Fundus Camera Volume Breakdown (K, %) by Region 2025 & 2033
- Figure 3: North America OCT and Fundus Camera Revenue (million), by Application 2025 & 2033
- Figure 4: North America OCT and Fundus Camera Volume (K), by Application 2025 & 2033
- Figure 5: North America OCT and Fundus Camera Revenue Share (%), by Application 2025 & 2033
- Figure 6: North America OCT and Fundus Camera Volume Share (%), by Application 2025 & 2033
- Figure 7: North America OCT and Fundus Camera Revenue (million), by Types 2025 & 2033
- Figure 8: North America OCT and Fundus Camera Volume (K), by Types 2025 & 2033
- Figure 9: North America OCT and Fundus Camera Revenue Share (%), by Types 2025 & 2033
- Figure 10: North America OCT and Fundus Camera Volume Share (%), by Types 2025 & 2033
- Figure 11: North America OCT and Fundus Camera Revenue (million), by Country 2025 & 2033
- Figure 12: North America OCT and Fundus Camera Volume (K), by Country 2025 & 2033
- Figure 13: North America OCT and Fundus Camera Revenue Share (%), by Country 2025 & 2033
- Figure 14: North America OCT and Fundus Camera Volume Share (%), by Country 2025 & 2033
- Figure 15: South America OCT and Fundus Camera Revenue (million), by Application 2025 & 2033
- Figure 16: South America OCT and Fundus Camera Volume (K), by Application 2025 & 2033
- Figure 17: South America OCT and Fundus Camera Revenue Share (%), by Application 2025 & 2033
- Figure 18: South America OCT and Fundus Camera Volume Share (%), by Application 2025 & 2033
- Figure 19: South America OCT and Fundus Camera Revenue (million), by Types 2025 & 2033
- Figure 20: South America OCT and Fundus Camera Volume (K), by Types 2025 & 2033
- Figure 21: South America OCT and Fundus Camera Revenue Share (%), by Types 2025 & 2033
- Figure 22: South America OCT and Fundus Camera Volume Share (%), by Types 2025 & 2033
- Figure 23: South America OCT and Fundus Camera Revenue (million), by Country 2025 & 2033
- Figure 24: South America OCT and Fundus Camera Volume (K), by Country 2025 & 2033
- Figure 25: South America OCT and Fundus Camera Revenue Share (%), by Country 2025 & 2033
- Figure 26: South America OCT and Fundus Camera Volume Share (%), by Country 2025 & 2033
- Figure 27: Europe OCT and Fundus Camera Revenue (million), by Application 2025 & 2033
- Figure 28: Europe OCT and Fundus Camera Volume (K), by Application 2025 & 2033
- Figure 29: Europe OCT and Fundus Camera Revenue Share (%), by Application 2025 & 2033
- Figure 30: Europe OCT and Fundus Camera Volume Share (%), by Application 2025 & 2033
- Figure 31: Europe OCT and Fundus Camera Revenue (million), by Types 2025 & 2033
- Figure 32: Europe OCT and Fundus Camera Volume (K), by Types 2025 & 2033
- Figure 33: Europe OCT and Fundus Camera Revenue Share (%), by Types 2025 & 2033
- Figure 34: Europe OCT and Fundus Camera Volume Share (%), by Types 2025 & 2033
- Figure 35: Europe OCT and Fundus Camera Revenue (million), by Country 2025 & 2033
- Figure 36: Europe OCT and Fundus Camera Volume (K), by Country 2025 & 2033
- Figure 37: Europe OCT and Fundus Camera Revenue Share (%), by Country 2025 & 2033
- Figure 38: Europe OCT and Fundus Camera Volume Share (%), by Country 2025 & 2033
- Figure 39: Middle East & Africa OCT and Fundus Camera Revenue (million), by Application 2025 & 2033
- Figure 40: Middle East & Africa OCT and Fundus Camera Volume (K), by Application 2025 & 2033
- Figure 41: Middle East & Africa OCT and Fundus Camera Revenue Share (%), by Application 2025 & 2033
- Figure 42: Middle East & Africa OCT and Fundus Camera Volume Share (%), by Application 2025 & 2033
- Figure 43: Middle East & Africa OCT and Fundus Camera Revenue (million), by Types 2025 & 2033
- Figure 44: Middle East & Africa OCT and Fundus Camera Volume (K), by Types 2025 & 2033
- Figure 45: Middle East & Africa OCT and Fundus Camera Revenue Share (%), by Types 2025 & 2033
- Figure 46: Middle East & Africa OCT and Fundus Camera Volume Share (%), by Types 2025 & 2033
- Figure 47: Middle East & Africa OCT and Fundus Camera Revenue (million), by Country 2025 & 2033
- Figure 48: Middle East & Africa OCT and Fundus Camera Volume (K), by Country 2025 & 2033
- Figure 49: Middle East & Africa OCT and Fundus Camera Revenue Share (%), by Country 2025 & 2033
- Figure 50: Middle East & Africa OCT and Fundus Camera Volume Share (%), by Country 2025 & 2033
- Figure 51: Asia Pacific OCT and Fundus Camera Revenue (million), by Application 2025 & 2033
- Figure 52: Asia Pacific OCT and Fundus Camera Volume (K), by Application 2025 & 2033
- Figure 53: Asia Pacific OCT and Fundus Camera Revenue Share (%), by Application 2025 & 2033
- Figure 54: Asia Pacific OCT and Fundus Camera Volume Share (%), by Application 2025 & 2033
- Figure 55: Asia Pacific OCT and Fundus Camera Revenue (million), by Types 2025 & 2033
- Figure 56: Asia Pacific OCT and Fundus Camera Volume (K), by Types 2025 & 2033
- Figure 57: Asia Pacific OCT and Fundus Camera Revenue Share (%), by Types 2025 & 2033
- Figure 58: Asia Pacific OCT and Fundus Camera Volume Share (%), by Types 2025 & 2033
- Figure 59: Asia Pacific OCT and Fundus Camera Revenue (million), by Country 2025 & 2033
- Figure 60: Asia Pacific OCT and Fundus Camera Volume (K), by Country 2025 & 2033
- Figure 61: Asia Pacific OCT and Fundus Camera Revenue Share (%), by Country 2025 & 2033
- Figure 62: Asia Pacific OCT and Fundus Camera Volume Share (%), by Country 2025 & 2033
List of Tables
- Table 1: Global OCT and Fundus Camera Revenue million Forecast, by Application 2020 & 2033
- Table 2: Global OCT and Fundus Camera Volume K Forecast, by Application 2020 & 2033
- Table 3: Global OCT and Fundus Camera Revenue million Forecast, by Types 2020 & 2033
- Table 4: Global OCT and Fundus Camera Volume K Forecast, by Types 2020 & 2033
- Table 5: Global OCT and Fundus Camera Revenue million Forecast, by Region 2020 & 2033
- Table 6: Global OCT and Fundus Camera Volume K Forecast, by Region 2020 & 2033
- Table 7: Global OCT and Fundus Camera Revenue million Forecast, by Application 2020 & 2033
- Table 8: Global OCT and Fundus Camera Volume K Forecast, by Application 2020 & 2033
- Table 9: Global OCT and Fundus Camera Revenue million Forecast, by Types 2020 & 2033
- Table 10: Global OCT and Fundus Camera Volume K Forecast, by Types 2020 & 2033
- Table 11: Global OCT and Fundus Camera Revenue million Forecast, by Country 2020 & 2033
- Table 12: Global OCT and Fundus Camera Volume K Forecast, by Country 2020 & 2033
- Table 13: United States OCT and Fundus Camera Revenue (million) Forecast, by Application 2020 & 2033
- Table 14: United States OCT and Fundus Camera Volume (K) Forecast, by Application 2020 & 2033
- Table 15: Canada OCT and Fundus Camera Revenue (million) Forecast, by Application 2020 & 2033
- Table 16: Canada OCT and Fundus Camera Volume (K) Forecast, by Application 2020 & 2033
- Table 17: Mexico OCT and Fundus Camera Revenue (million) Forecast, by Application 2020 & 2033
- Table 18: Mexico OCT and Fundus Camera Volume (K) Forecast, by Application 2020 & 2033
- Table 19: Global OCT and Fundus Camera Revenue million Forecast, by Application 2020 & 2033
- Table 20: Global OCT and Fundus Camera Volume K Forecast, by Application 2020 & 2033
- Table 21: Global OCT and Fundus Camera Revenue million Forecast, by Types 2020 & 2033
- Table 22: Global OCT and Fundus Camera Volume K Forecast, by Types 2020 & 2033
- Table 23: Global OCT and Fundus Camera Revenue million Forecast, by Country 2020 & 2033
- Table 24: Global OCT and Fundus Camera Volume K Forecast, by Country 2020 & 2033
- Table 25: Brazil OCT and Fundus Camera Revenue (million) Forecast, by Application 2020 & 2033
- Table 26: Brazil OCT and Fundus Camera Volume (K) Forecast, by Application 2020 & 2033
- Table 27: Argentina OCT and Fundus Camera Revenue (million) Forecast, by Application 2020 & 2033
- Table 28: Argentina OCT and Fundus Camera Volume (K) Forecast, by Application 2020 & 2033
- Table 29: Rest of South America OCT and Fundus Camera Revenue (million) Forecast, by Application 2020 & 2033
- Table 30: Rest of South America OCT and Fundus Camera Volume (K) Forecast, by Application 2020 & 2033
- Table 31: Global OCT and Fundus Camera Revenue million Forecast, by Application 2020 & 2033
- Table 32: Global OCT and Fundus Camera Volume K Forecast, by Application 2020 & 2033
- Table 33: Global OCT and Fundus Camera Revenue million Forecast, by Types 2020 & 2033
- Table 34: Global OCT and Fundus Camera Volume K Forecast, by Types 2020 & 2033
- Table 35: Global OCT and Fundus Camera Revenue million Forecast, by Country 2020 & 2033
- Table 36: Global OCT and Fundus Camera Volume K Forecast, by Country 2020 & 2033
- Table 37: United Kingdom OCT and Fundus Camera Revenue (million) Forecast, by Application 2020 & 2033
- Table 38: United Kingdom OCT and Fundus Camera Volume (K) Forecast, by Application 2020 & 2033
- Table 39: Germany OCT and Fundus Camera Revenue (million) Forecast, by Application 2020 & 2033
- Table 40: Germany OCT and Fundus Camera Volume (K) Forecast, by Application 2020 & 2033
- Table 41: France OCT and Fundus Camera Revenue (million) Forecast, by Application 2020 & 2033
- Table 42: France OCT and Fundus Camera Volume (K) Forecast, by Application 2020 & 2033
- Table 43: Italy OCT and Fundus Camera Revenue (million) Forecast, by Application 2020 & 2033
- Table 44: Italy OCT and Fundus Camera Volume (K) Forecast, by Application 2020 & 2033
- Table 45: Spain OCT and Fundus Camera Revenue (million) Forecast, by Application 2020 & 2033
- Table 46: Spain OCT and Fundus Camera Volume (K) Forecast, by Application 2020 & 2033
- Table 47: Russia OCT and Fundus Camera Revenue (million) Forecast, by Application 2020 & 2033
- Table 48: Russia OCT and Fundus Camera Volume (K) Forecast, by Application 2020 & 2033
- Table 49: Benelux OCT and Fundus Camera Revenue (million) Forecast, by Application 2020 & 2033
- Table 50: Benelux OCT and Fundus Camera Volume (K) Forecast, by Application 2020 & 2033
- Table 51: Nordics OCT and Fundus Camera Revenue (million) Forecast, by Application 2020 & 2033
- Table 52: Nordics OCT and Fundus Camera Volume (K) Forecast, by Application 2020 & 2033
- Table 53: Rest of Europe OCT and Fundus Camera Revenue (million) Forecast, by Application 2020 & 2033
- Table 54: Rest of Europe OCT and Fundus Camera Volume (K) Forecast, by Application 2020 & 2033
- Table 55: Global OCT and Fundus Camera Revenue million Forecast, by Application 2020 & 2033
- Table 56: Global OCT and Fundus Camera Volume K Forecast, by Application 2020 & 2033
- Table 57: Global OCT and Fundus Camera Revenue million Forecast, by Types 2020 & 2033
- Table 58: Global OCT and Fundus Camera Volume K Forecast, by Types 2020 & 2033
- Table 59: Global OCT and Fundus Camera Revenue million Forecast, by Country 2020 & 2033
- Table 60: Global OCT and Fundus Camera Volume K Forecast, by Country 2020 & 2033
- Table 61: Turkey OCT and Fundus Camera Revenue (million) Forecast, by Application 2020 & 2033
- Table 62: Turkey OCT and Fundus Camera Volume (K) Forecast, by Application 2020 & 2033
- Table 63: Israel OCT and Fundus Camera Revenue (million) Forecast, by Application 2020 & 2033
- Table 64: Israel OCT and Fundus Camera Volume (K) Forecast, by Application 2020 & 2033
- Table 65: GCC OCT and Fundus Camera Revenue (million) Forecast, by Application 2020 & 2033
- Table 66: GCC OCT and Fundus Camera Volume (K) Forecast, by Application 2020 & 2033
- Table 67: North Africa OCT and Fundus Camera Revenue (million) Forecast, by Application 2020 & 2033
- Table 68: North Africa OCT and Fundus Camera Volume (K) Forecast, by Application 2020 & 2033
- Table 69: South Africa OCT and Fundus Camera Revenue (million) Forecast, by Application 2020 & 2033
- Table 70: South Africa OCT and Fundus Camera Volume (K) Forecast, by Application 2020 & 2033
- Table 71: Rest of Middle East & Africa OCT and Fundus Camera Revenue (million) Forecast, by Application 2020 & 2033
- Table 72: Rest of Middle East & Africa OCT and Fundus Camera Volume (K) Forecast, by Application 2020 & 2033
- Table 73: Global OCT and Fundus Camera Revenue million Forecast, by Application 2020 & 2033
- Table 74: Global OCT and Fundus Camera Volume K Forecast, by Application 2020 & 2033
- Table 75: Global OCT and Fundus Camera Revenue million Forecast, by Types 2020 & 2033
- Table 76: Global OCT and Fundus Camera Volume K Forecast, by Types 2020 & 2033
- Table 77: Global OCT and Fundus Camera Revenue million Forecast, by Country 2020 & 2033
- Table 78: Global OCT and Fundus Camera Volume K Forecast, by Country 2020 & 2033
- Table 79: China OCT and Fundus Camera Revenue (million) Forecast, by Application 2020 & 2033
- Table 80: China OCT and Fundus Camera Volume (K) Forecast, by Application 2020 & 2033
- Table 81: India OCT and Fundus Camera Revenue (million) Forecast, by Application 2020 & 2033
- Table 82: India OCT and Fundus Camera Volume (K) Forecast, by Application 2020 & 2033
- Table 83: Japan OCT and Fundus Camera Revenue (million) Forecast, by Application 2020 & 2033
- Table 84: Japan OCT and Fundus Camera Volume (K) Forecast, by Application 2020 & 2033
- Table 85: South Korea OCT and Fundus Camera Revenue (million) Forecast, by Application 2020 & 2033
- Table 86: South Korea OCT and Fundus Camera Volume (K) Forecast, by Application 2020 & 2033
- Table 87: ASEAN OCT and Fundus Camera Revenue (million) Forecast, by Application 2020 & 2033
- Table 88: ASEAN OCT and Fundus Camera Volume (K) Forecast, by Application 2020 & 2033
- Table 89: Oceania OCT and Fundus Camera Revenue (million) Forecast, by Application 2020 & 2033
- Table 90: Oceania OCT and Fundus Camera Volume (K) Forecast, by Application 2020 & 2033
- Table 91: Rest of Asia Pacific OCT and Fundus Camera Revenue (million) Forecast, by Application 2020 & 2033
- Table 92: Rest of Asia Pacific OCT and Fundus Camera Volume (K) Forecast, by Application 2020 & 2033
Frequently Asked Questions
1. What is the projected Compound Annual Growth Rate (CAGR) of the OCT and Fundus Camera?
The projected CAGR is approximately 6%.
2. Which companies are prominent players in the OCT and Fundus Camera?
Key companies in the market include Zeiss, Topcon, Nikon (Optos), Kowa, Nidek, Heidelberg Engineering, Optovue, Optomed.
3. What are the main segments of the OCT and Fundus Camera?
The market segments include Application, Types.
4. Can you provide details about the market size?
The market size is estimated to be USD 654.1 million as of 2022.
5. What are some drivers contributing to market growth?
N/A
6. What are the notable trends driving market growth?
N/A
7. Are there any restraints impacting market growth?
N/A
8. Can you provide examples of recent developments in the market?
N/A
9. What pricing options are available for accessing the report?
Pricing options include single-user, multi-user, and enterprise licenses priced at USD 3950.00, USD 5925.00, and USD 7900.00 respectively.
10. Is the market size provided in terms of value or volume?
The market size is provided in terms of value, measured in million and volume, measured in K.
11. Are there any specific market keywords associated with the report?
Yes, the market keyword associated with the report is "OCT and Fundus Camera," which aids in identifying and referencing the specific market segment covered.
12. How do I determine which pricing option suits my needs best?
The pricing options vary based on user requirements and access needs. Individual users may opt for single-user licenses, while businesses requiring broader access may choose multi-user or enterprise licenses for cost-effective access to the report.
13. Are there any additional resources or data provided in the OCT and Fundus Camera report?
While the report offers comprehensive insights, it's advisable to review the specific contents or supplementary materials provided to ascertain if additional resources or data are available.
14. How can I stay updated on further developments or reports in the OCT and Fundus Camera?
To stay informed about further developments, trends, and reports in the OCT and Fundus Camera, consider subscribing to industry newsletters, following relevant companies and organizations, or regularly checking reputable industry news sources and publications.
Methodology
Step 1 - Identification of Relevant Samples Size from Population Database


Step 2 - Approaches for Defining Global Market Size (Value, Volume* & Price*)

Note*: In applicable scenarios
Step 3 - Data Sources
Primary Research
- Web Analytics
- Survey Reports
- Research Institute
- Latest Research Reports
- Opinion Leaders
Secondary Research
- Annual Reports
- White Paper
- Latest Press Release
- Industry Association
- Paid Database
- Investor Presentations

Step 4 - Data Triangulation
Involves using different sources of information in order to increase the validity of a study
These sources are likely to be stakeholders in a program - participants, other researchers, program staff, other community members, and so on.
Then we put all data in single framework & apply various statistical tools to find out the dynamic on the market.
During the analysis stage, feedback from the stakeholder groups would be compared to determine areas of agreement as well as areas of divergence