

Key Insights
The global Nuclear Power Reactor Decommissioning Services market is poised for substantial growth, estimated to reach USD 9.66 billion in 2025. This expansion is driven by a confluence of factors, including the aging nuclear reactor fleet worldwide, increasing regulatory scrutiny, and the growing emphasis on safe and environmentally responsible disposal of nuclear assets. The market is projected to witness a robust Compound Annual Growth Rate (CAGR) of 15.44%, indicating a significant upward trajectory for the forecast period of 2025-2033. This strong growth is primarily fueled by the ongoing retirement of older nuclear power plants, particularly Pressurized Water Reactors (PWRs) and Boiling Water Reactors (BWRs), which constitute the largest segments of the market. Furthermore, advancements in decommissioning technologies and methodologies, coupled with substantial investments in the nuclear sector for both operational life extensions and new builds, are creating a consistent demand for specialized decommissioning services. The increasing global commitment to clean energy solutions also indirectly supports the nuclear decommissioning market, as the phased retirement of older, less efficient plants makes way for advanced and safer nuclear technologies, necessitating their eventual decommissioning.
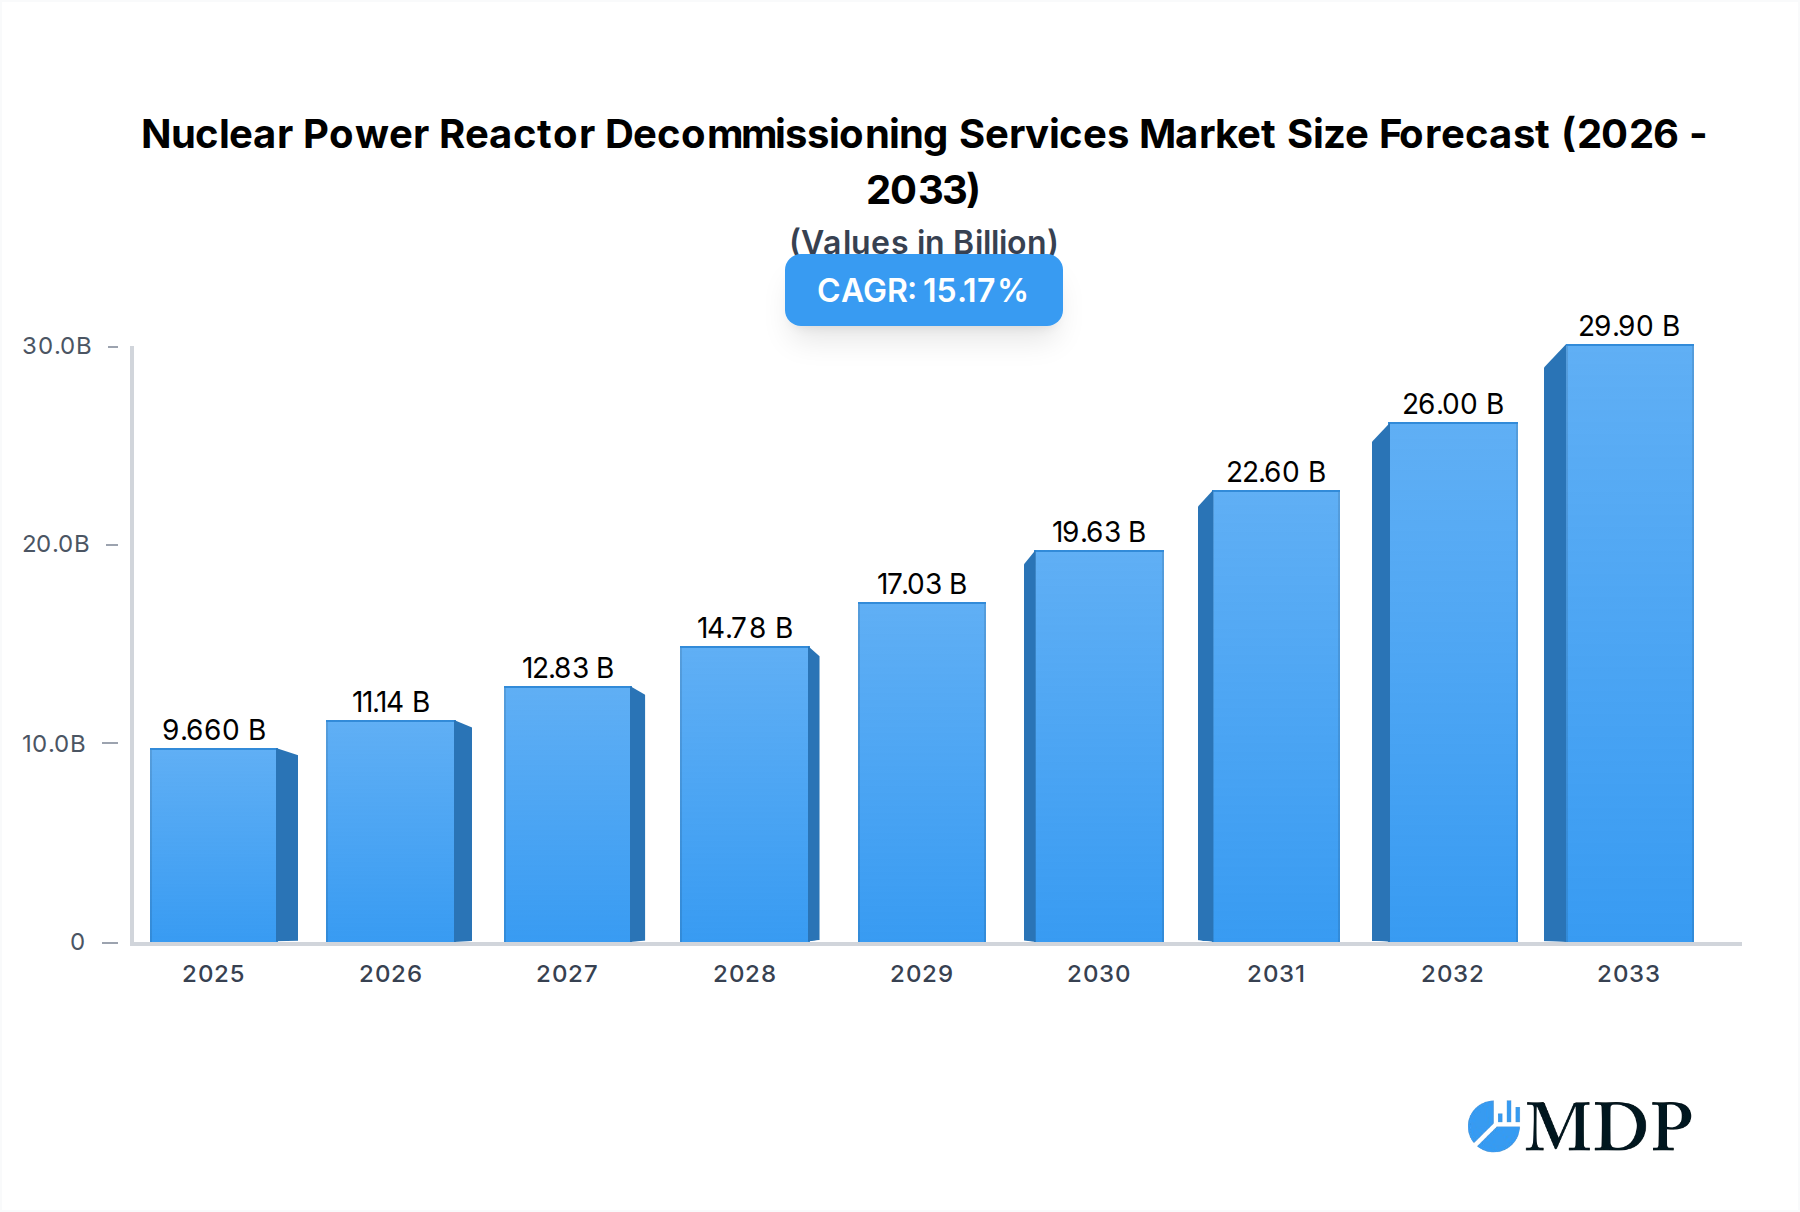
Nuclear Power Reactor Decommissioning Services Market Size (In Billion)
The market's expansion is also significantly influenced by proactive governmental policies and international collaborations aimed at enhancing nuclear safety and waste management protocols. This regulatory push compels plant operators to allocate significant budgets towards decommissioning activities, thereby stimulating market demand. Key applications within this market span commercial power reactors, prototype power reactors, and research reactors, with a clear focus on the commercial segment due to the sheer number of aging facilities. Geographically, North America and Europe are expected to dominate the market share, owing to the presence of a mature nuclear energy infrastructure and a substantial number of reactors nearing or already past their operational lifespan. Emerging economies in the Asia Pacific region are also anticipated to contribute significantly to market growth as their nuclear programs mature and older facilities require decommissioning. The competitive landscape features established global players and specialized service providers, all vying to secure long-term contracts and leverage technological innovation to offer comprehensive and cost-effective decommissioning solutions.

Nuclear Power Reactor Decommissioning Services Company Market Share
Nuclear Power Reactor Decommissioning Services Market Report: Comprehensive Analysis and Strategic Outlook (2019–2033)
This in-depth report provides a comprehensive analysis of the global Nuclear Power Reactor Decommissioning Services market, covering the study period from 2019 to 2033, with a base and estimated year of 2025. Delve into market dynamics, industry trends, leading segments, product developments, growth drivers, challenges, emerging opportunities, and a strategic outlook, equipping industry stakeholders with actionable insights. The market is poised for significant expansion as older nuclear facilities reach the end of their operational life, necessitating specialized and increasingly sophisticated decommissioning strategies. We forecast a robust Compound Annual Growth Rate (CAGR) throughout the forecast period, driven by the inherent complexities and evolving regulatory landscapes surrounding nuclear power plant retirement.
Nuclear Power Reactor Decommissioning Services Market Dynamics & Concentration
The Nuclear Power Reactor Decommissioning Services market exhibits a moderate to high concentration, with a few key players dominating the landscape due to the significant capital investment, specialized expertise, and stringent regulatory approvals required for operation. Innovation drivers are primarily focused on enhancing safety protocols, reducing environmental impact, and optimizing cost-efficiency through advanced robotics, remote handling technologies, and improved waste management techniques. Regulatory frameworks, established by bodies like the IAEA and national atomic energy agencies, play a pivotal role in dictating decommissioning methodologies, safety standards, and timelines, creating significant barriers to entry for new market participants. Product substitutes are largely non-existent in the context of full reactor decommissioning, as the process is inherently unique. End-user trends are shifting towards a greater demand for integrated, turnkey solutions that encompass the entire decommissioning lifecycle, from planning and characterization to dismantling and site remediation. Mergers and acquisitions (M&A) activities are notable, driven by companies seeking to consolidate expertise, expand geographical reach, and acquire new technologies. For instance, recent M&A activities in the historical period (2019–2024) point towards consolidation aimed at achieving economies of scale and enhancing competitive positioning. Estimated M&A deal counts in recent years suggest a trend of strategic acquisitions by larger entities seeking to bolster their decommissioning portfolios, potentially reaching several billion in deal value.
Nuclear Power Reactor Decommissioning Services Industry Trends & Analysis
The Nuclear Power Reactor Decommissioning Services industry is experiencing a period of accelerated growth and transformation, fundamentally shaped by an aging global nuclear fleet and increasing public and governmental pressure for responsible end-of-life management. Market growth drivers are predominantly anchored in the escalating number of nuclear power reactors reaching their operational expiry dates. Across the globe, an estimated XXX gigawatts of nuclear capacity are projected to require decommissioning in the coming decades, creating a sustained demand for specialized services. Technological disruptions are at the forefront of industry evolution, with significant investments being channeled into developing and deploying advanced robotics, artificial intelligence, and sophisticated remote-handling equipment. These innovations are crucial for minimizing human exposure to radiation during dismantling processes, improving efficiency, and reducing overall project costs. Furthermore, the ongoing development of enhanced waste characterization and management techniques, including advanced segmentation and packaging technologies, is critical for addressing the complex radioactive waste streams generated. Consumer preferences are increasingly leaning towards comprehensive, end-to-end decommissioning solutions. Clients, primarily utility companies and government entities, are seeking reliable partners capable of managing the entire process from initial planning and regulatory compliance to final site restoration, thereby minimizing their risk and operational burden. This has led to a demand for integrated service providers that can offer a full spectrum of expertise. Competitive dynamics are characterized by a fierce battle for project tenders, with companies differentiating themselves based on their proven track record, technological prowess, safety performance, and cost-competitiveness. The market penetration of advanced decommissioning technologies is steadily increasing as their effectiveness and cost-benefits become more evident. The CAGR for the Nuclear Power Reactor Decommissioning Services market is projected to be substantial, likely in the range of XX% to XX% during the forecast period, reflecting the growing demand and the complex nature of the services offered. The estimated market size is projected to reach several billion by 2025, with robust growth anticipated through 2033.
Leading Markets & Segments in Nuclear Power Reactor Decommissioning Services
The global Nuclear Power Reactor Decommissioning Services market is significantly influenced by regional policies, the existing nuclear power infrastructure, and the types of reactors in operation.
Dominant Region: North America and Europe currently represent the leading markets for nuclear power reactor decommissioning services. This dominance is attributable to:
- Aging Reactor Fleet: A substantial number of older commercial nuclear power reactors in these regions have either reached or are nearing their operational lifespan, necessitating active decommissioning programs.
- Mature Regulatory Frameworks: Well-established and stringent regulatory frameworks for nuclear safety and decommissioning in countries like the United States, Canada, the United Kingdom, and France provide a clear roadmap and create consistent demand for these specialized services.
- Economic Policies and Investment: Government policies supporting the responsible management of nuclear assets and significant private sector investment in the nuclear industry have fostered a robust market for decommissioning expertise.
- Infrastructure and Supply Chain: Developed industrial infrastructure and established supply chains for specialized equipment and services further bolster the capacity for large-scale decommissioning projects in these regions.
Dominant Segment by Application: For Commercial Power Reactor decommissioning is by far the largest and most significant segment within the market.
- High Volume: The sheer number of commercial power reactors worldwide, compared to prototype or research reactors, naturally drives the volume of decommissioning projects in this category.
- Scale and Complexity: Commercial reactors, particularly those of higher power output, involve more extensive dismantling and waste management challenges, requiring comprehensive and costly decommissioning efforts.
- Regulatory Mandates: Governments worldwide mandate the safe and timely decommissioning of commercial power reactors upon their permanent shutdown, ensuring continuous demand.
Dominant Segment by Type: Pressurized Water Reactor (PWR) Decommissioning represents the most prevalent type of reactor decommissioning.
- Global Prevalence: PWRs constitute the largest fleet of operational nuclear power reactors globally, meaning that as they reach end-of-life, they will constitute the majority of decommissioning projects.
- Established Decommissioning Methodologies: Decades of experience in decommissioning PWRs have led to well-defined processes, technologies, and best practices, making them a more predictable and manageable undertaking compared to some other reactor types.
- Availability of Specialized Expertise: The widespread nature of PWRs has fostered a mature ecosystem of companies and professionals specializing in their decommissioning.
While Boiling Water Reactor (BWR) decommissioning also represents a significant segment, and "Others" may encompass niche reactor types, the sheer volume and established nature of PWRs solidify their dominance. The economic policies and infrastructure supporting nuclear power in regions with large PWR fleets are key drivers for the continued demand in this segment.
Nuclear Power Reactor Decommissioning Services Product Developments
Recent product developments in nuclear power reactor decommissioning services are characterized by a strong emphasis on enhancing safety, efficiency, and cost-effectiveness. Innovations in robotics and automation are leading to the development of more sophisticated remote-controlled manipulators, drones for inspection in hazardous environments, and autonomous systems for dismantling tasks. Advanced segmentation techniques, such as laser cutting and plasma arc cutting, are becoming more refined for efficient material processing. Furthermore, there is a growing focus on improved characterization tools for radioactive waste and integrated software solutions for project management and regulatory compliance. These developments offer significant competitive advantages by reducing human exposure, accelerating project timelines, and optimizing waste disposal strategies. The market fit for these innovations is strong, driven by the continuous need for safer and more economical decommissioning solutions.
Key Drivers of Nuclear Power Reactor Decommissioning Services Growth
Several key factors are propelling the growth of the Nuclear Power Reactor Decommissioning Services market. Foremost among these is the aging global nuclear power infrastructure, with a significant number of reactors reaching their designed operational lifetimes and requiring phased decommissioning. Secondly, stringent regulatory mandates and evolving safety standards imposed by national and international bodies necessitate professional and compliant decommissioning processes. Thirdly, advancements in decommissioning technologies, including robotics, remote handling, and waste management solutions, are making the process safer, more efficient, and economically viable. Finally, increased public and governmental awareness regarding the responsible management of nuclear assets and the potential environmental impact of legacy sites is creating sustained demand for specialized decommissioning services.
Challenges in the Nuclear Power Reactor Decommissioning Services Market
The Nuclear Power Reactor Decommissioning Services market faces several significant challenges. Stringent and complex regulatory requirements can lead to prolonged permitting processes and substantial compliance costs, impacting project timelines and budgets. The generation of large volumes of radioactive waste poses significant logistical and disposal challenges, requiring specialized handling, storage, and long-term management solutions. The highly specialized nature of the expertise and equipment required creates a high barrier to entry and can lead to workforce shortages. Furthermore, uncertainties in long-term cost projections and funding mechanisms for large-scale decommissioning projects can create financial risks for stakeholders. Finally, public perception and engagement surrounding nuclear decommissioning can also present challenges in gaining project approvals and maintaining social license to operate.
Emerging Opportunities in Nuclear Power Reactor Decommissioning Services
Emerging opportunities in the Nuclear Power Reactor Decommissioning Services market are primarily driven by technological breakthroughs and strategic market expansion. The development of novel decontamination techniques and advanced robotics for in-situ dismantling are poised to significantly reduce costs and enhance safety. Strategic partnerships and collaborations between established players and technology providers, or between decommissioning firms and waste management specialists, can lead to more integrated and efficient service offerings. Furthermore, the potential for repurposing decommissioned nuclear sites for new energy initiatives, such as advanced nuclear reactors or renewable energy projects, presents a long-term growth catalyst. The increasing global focus on circular economy principles within the nuclear sector also opens avenues for innovative waste valorization and material recycling strategies.
Leading Players in the Nuclear Power Reactor Decommissioning Services Sector
- Babcock International Group PLC
- James Fisher & Sons PLC
- NorthStar Group Services Inc.
- Fluor Corporation
- GE Hitachi Nuclear Services
- Studsvik AB
- WS Atkins PLC
- Enercon Services Inc.
- Areva S.A.
- AECOM
- Bechtel Group Inc.
- Westinghouse Electric Company
Key Milestones in Nuclear Power Reactor Decommissioning Services Industry
- 2019: Increased regulatory focus on advanced waste management techniques for decommissioning.
- 2020: Significant advancements in robotic arms for remote dismantling, improving safety margins.
- 2021: Launch of new integrated decommissioning planning software solutions.
- 2022: Key M&A activities involving consolidation of expertise in specialized decommissioning services.
- 2023: Growing adoption of AI for predictive maintenance and risk assessment in decommissioning projects.
- 2024: Enhanced international collaboration on standardization of decommissioning best practices.
Strategic Outlook for Nuclear Power Reactor Decommissioning Services Market
The strategic outlook for the Nuclear Power Reactor Decommissioning Services market is overwhelmingly positive, driven by the inevitable progression of the global nuclear fleet toward end-of-life. Growth accelerators will include continued investment in technological innovation, particularly in automation and AI, to further enhance safety and efficiency. Strategic opportunities lie in forging robust partnerships to offer end-to-end solutions, thereby capturing a larger market share and mitigating project risks. Furthermore, companies that can demonstrate a strong commitment to environmental stewardship and provide transparent communication regarding decommissioning processes will gain a competitive edge. The long-term potential is substantial, as the demand for responsible nuclear site closure and remediation is expected to remain a critical global imperative for decades to come.
Nuclear Power Reactor Decommissioning Services Segmentation
-
1. Application
- 1.1. For Commercial Power Reactor
- 1.2. For Prototype Power Reactor and Research Reactor
-
2. Types
- 2.1. Pressurized Water Reactor Decommissioning
- 2.2. Boiling Water Reactor Decommissioning
- 2.3. Others
Nuclear Power Reactor Decommissioning Services Segmentation By Geography
-
1. North America
- 1.1. United States
- 1.2. Canada
- 1.3. Mexico
-
2. South America
- 2.1. Brazil
- 2.2. Argentina
- 2.3. Rest of South America
-
3. Europe
- 3.1. United Kingdom
- 3.2. Germany
- 3.3. France
- 3.4. Italy
- 3.5. Spain
- 3.6. Russia
- 3.7. Benelux
- 3.8. Nordics
- 3.9. Rest of Europe
-
4. Middle East & Africa
- 4.1. Turkey
- 4.2. Israel
- 4.3. GCC
- 4.4. North Africa
- 4.5. South Africa
- 4.6. Rest of Middle East & Africa
-
5. Asia Pacific
- 5.1. China
- 5.2. India
- 5.3. Japan
- 5.4. South Korea
- 5.5. ASEAN
- 5.6. Oceania
- 5.7. Rest of Asia Pacific
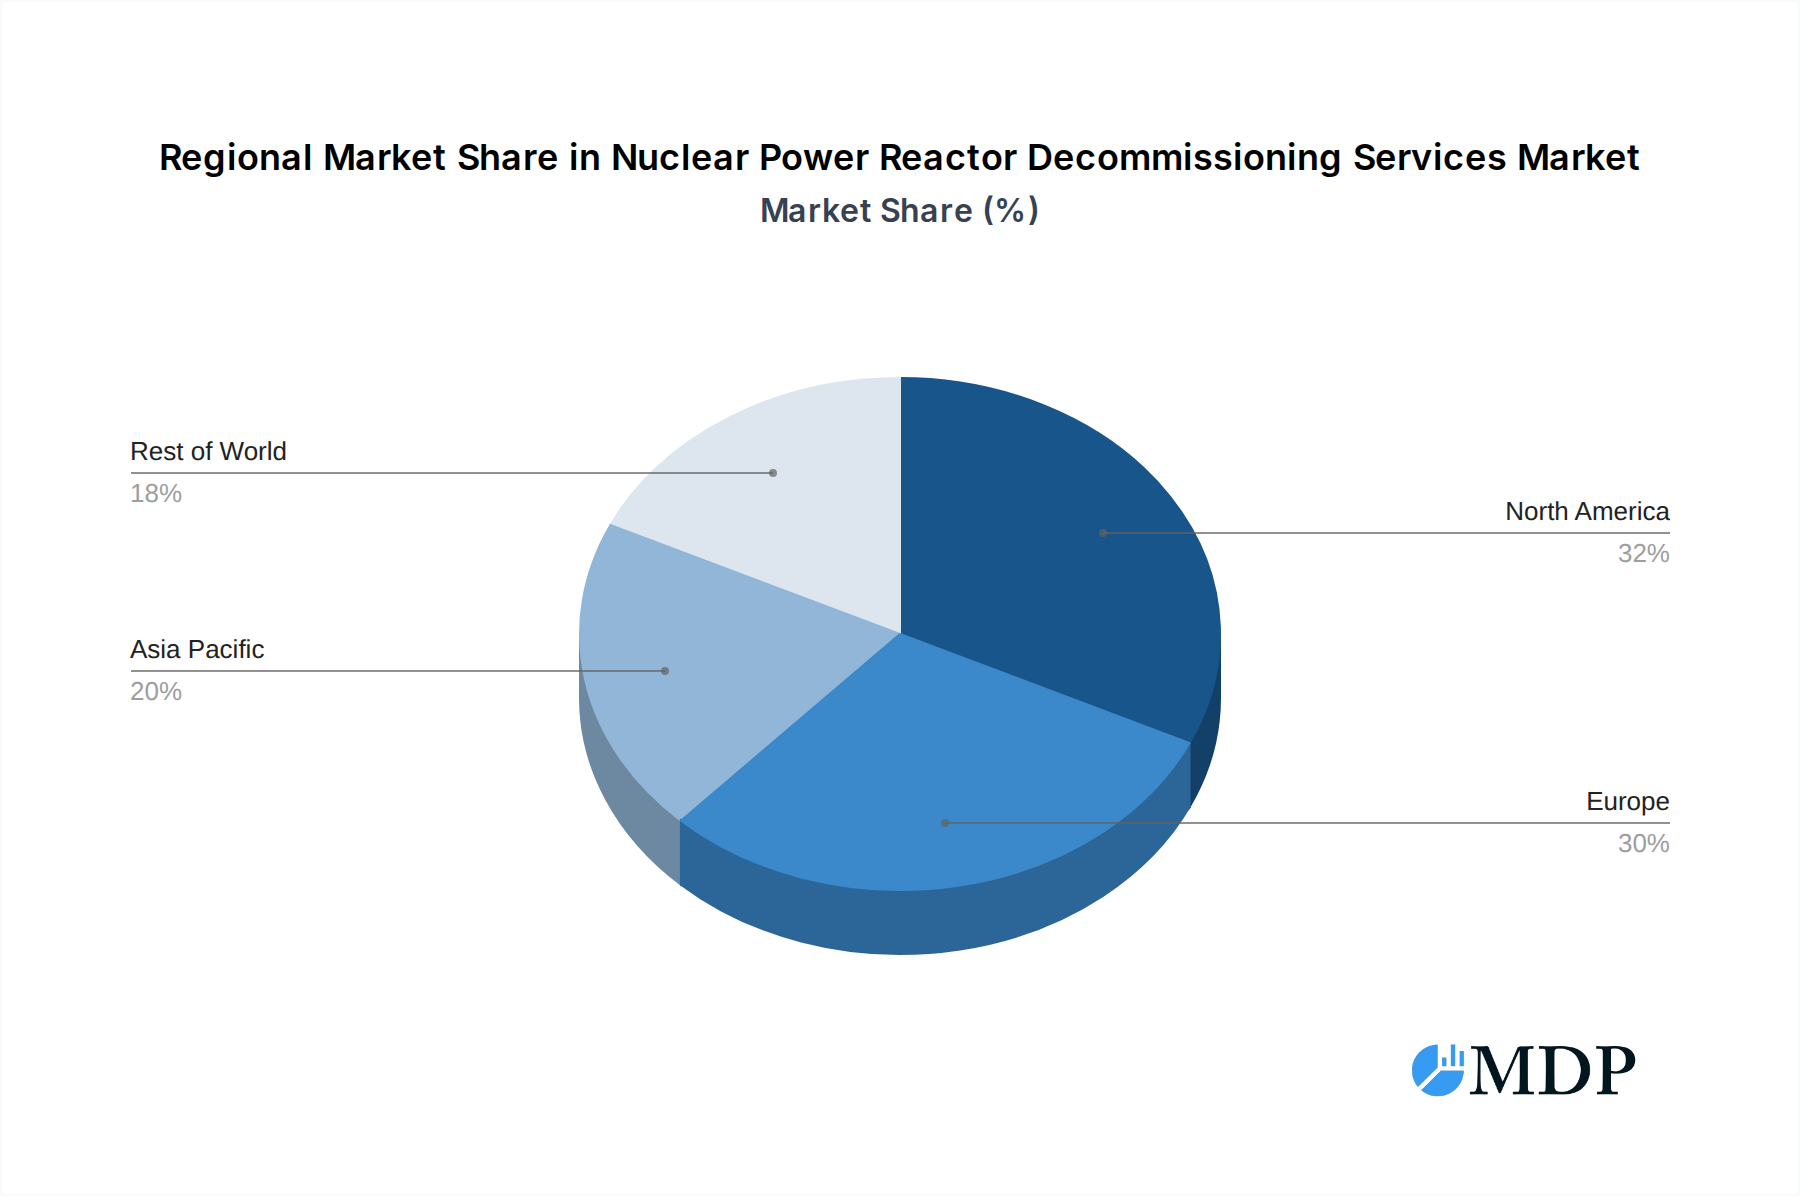
Nuclear Power Reactor Decommissioning Services Regional Market Share
Geographic Coverage of Nuclear Power Reactor Decommissioning Services
Nuclear Power Reactor Decommissioning Services REPORT HIGHLIGHTS
| Aspects | Details |
|---|---|
| Study Period | 2020-2034 |
| Base Year | 2025 |
| Estimated Year | 2026 |
| Forecast Period | 2026-2034 |
| Historical Period | 2020-2025 |
| Growth Rate | CAGR of 15.44% from 2020-2034 |
| Segmentation |
|
Table of Contents
- 1. Introduction
- 1.1. Research Scope
- 1.2. Market Segmentation
- 1.3. Research Methodology
- 1.4. Definitions and Assumptions
- 2. Executive Summary
- 2.1. Introduction
- 3. Market Dynamics
- 3.1. Introduction
- 3.2. Market Drivers
- 3.3. Market Restrains
- 3.4. Market Trends
- 4. Market Factor Analysis
- 4.1. Porters Five Forces
- 4.2. Supply/Value Chain
- 4.3. PESTEL analysis
- 4.4. Market Entropy
- 4.5. Patent/Trademark Analysis
- 5. Global Nuclear Power Reactor Decommissioning Services Analysis, Insights and Forecast, 2020-2032
- 5.1. Market Analysis, Insights and Forecast - by Application
- 5.1.1. For Commercial Power Reactor
- 5.1.2. For Prototype Power Reactor and Research Reactor
- 5.2. Market Analysis, Insights and Forecast - by Types
- 5.2.1. Pressurized Water Reactor Decommissioning
- 5.2.2. Boiling Water Reactor Decommissioning
- 5.2.3. Others
- 5.3. Market Analysis, Insights and Forecast - by Region
- 5.3.1. North America
- 5.3.2. South America
- 5.3.3. Europe
- 5.3.4. Middle East & Africa
- 5.3.5. Asia Pacific
- 5.1. Market Analysis, Insights and Forecast - by Application
- 6. North America Nuclear Power Reactor Decommissioning Services Analysis, Insights and Forecast, 2020-2032
- 6.1. Market Analysis, Insights and Forecast - by Application
- 6.1.1. For Commercial Power Reactor
- 6.1.2. For Prototype Power Reactor and Research Reactor
- 6.2. Market Analysis, Insights and Forecast - by Types
- 6.2.1. Pressurized Water Reactor Decommissioning
- 6.2.2. Boiling Water Reactor Decommissioning
- 6.2.3. Others
- 6.1. Market Analysis, Insights and Forecast - by Application
- 7. South America Nuclear Power Reactor Decommissioning Services Analysis, Insights and Forecast, 2020-2032
- 7.1. Market Analysis, Insights and Forecast - by Application
- 7.1.1. For Commercial Power Reactor
- 7.1.2. For Prototype Power Reactor and Research Reactor
- 7.2. Market Analysis, Insights and Forecast - by Types
- 7.2.1. Pressurized Water Reactor Decommissioning
- 7.2.2. Boiling Water Reactor Decommissioning
- 7.2.3. Others
- 7.1. Market Analysis, Insights and Forecast - by Application
- 8. Europe Nuclear Power Reactor Decommissioning Services Analysis, Insights and Forecast, 2020-2032
- 8.1. Market Analysis, Insights and Forecast - by Application
- 8.1.1. For Commercial Power Reactor
- 8.1.2. For Prototype Power Reactor and Research Reactor
- 8.2. Market Analysis, Insights and Forecast - by Types
- 8.2.1. Pressurized Water Reactor Decommissioning
- 8.2.2. Boiling Water Reactor Decommissioning
- 8.2.3. Others
- 8.1. Market Analysis, Insights and Forecast - by Application
- 9. Middle East & Africa Nuclear Power Reactor Decommissioning Services Analysis, Insights and Forecast, 2020-2032
- 9.1. Market Analysis, Insights and Forecast - by Application
- 9.1.1. For Commercial Power Reactor
- 9.1.2. For Prototype Power Reactor and Research Reactor
- 9.2. Market Analysis, Insights and Forecast - by Types
- 9.2.1. Pressurized Water Reactor Decommissioning
- 9.2.2. Boiling Water Reactor Decommissioning
- 9.2.3. Others
- 9.1. Market Analysis, Insights and Forecast - by Application
- 10. Asia Pacific Nuclear Power Reactor Decommissioning Services Analysis, Insights and Forecast, 2020-2032
- 10.1. Market Analysis, Insights and Forecast - by Application
- 10.1.1. For Commercial Power Reactor
- 10.1.2. For Prototype Power Reactor and Research Reactor
- 10.2. Market Analysis, Insights and Forecast - by Types
- 10.2.1. Pressurized Water Reactor Decommissioning
- 10.2.2. Boiling Water Reactor Decommissioning
- 10.2.3. Others
- 10.1. Market Analysis, Insights and Forecast - by Application
- 11. Competitive Analysis
- 11.1. Global Market Share Analysis 2025
- 11.2. Company Profiles
- 11.2.1 Babcock International Group PLC
- 11.2.1.1. Overview
- 11.2.1.2. Products
- 11.2.1.3. SWOT Analysis
- 11.2.1.4. Recent Developments
- 11.2.1.5. Financials (Based on Availability)
- 11.2.2 James Fisher & Sons PLC
- 11.2.2.1. Overview
- 11.2.2.2. Products
- 11.2.2.3. SWOT Analysis
- 11.2.2.4. Recent Developments
- 11.2.2.5. Financials (Based on Availability)
- 11.2.3 NorthStar Group Services Inc.
- 11.2.3.1. Overview
- 11.2.3.2. Products
- 11.2.3.3. SWOT Analysis
- 11.2.3.4. Recent Developments
- 11.2.3.5. Financials (Based on Availability)
- 11.2.4 Fluor Corporation
- 11.2.4.1. Overview
- 11.2.4.2. Products
- 11.2.4.3. SWOT Analysis
- 11.2.4.4. Recent Developments
- 11.2.4.5. Financials (Based on Availability)
- 11.2.5 GE Hitachi Nuclear Services
- 11.2.5.1. Overview
- 11.2.5.2. Products
- 11.2.5.3. SWOT Analysis
- 11.2.5.4. Recent Developments
- 11.2.5.5. Financials (Based on Availability)
- 11.2.6 Studsvik AB
- 11.2.6.1. Overview
- 11.2.6.2. Products
- 11.2.6.3. SWOT Analysis
- 11.2.6.4. Recent Developments
- 11.2.6.5. Financials (Based on Availability)
- 11.2.7 WS Atkins PLC
- 11.2.7.1. Overview
- 11.2.7.2. Products
- 11.2.7.3. SWOT Analysis
- 11.2.7.4. Recent Developments
- 11.2.7.5. Financials (Based on Availability)
- 11.2.8 Enercon Services Inc.
- 11.2.8.1. Overview
- 11.2.8.2. Products
- 11.2.8.3. SWOT Analysis
- 11.2.8.4. Recent Developments
- 11.2.8.5. Financials (Based on Availability)
- 11.2.9 Areva S.A.
- 11.2.9.1. Overview
- 11.2.9.2. Products
- 11.2.9.3. SWOT Analysis
- 11.2.9.4. Recent Developments
- 11.2.9.5. Financials (Based on Availability)
- 11.2.10 AECOM
- 11.2.10.1. Overview
- 11.2.10.2. Products
- 11.2.10.3. SWOT Analysis
- 11.2.10.4. Recent Developments
- 11.2.10.5. Financials (Based on Availability)
- 11.2.11 Bechtel Group Inc.
- 11.2.11.1. Overview
- 11.2.11.2. Products
- 11.2.11.3. SWOT Analysis
- 11.2.11.4. Recent Developments
- 11.2.11.5. Financials (Based on Availability)
- 11.2.12 Westinghouse Electric Company
- 11.2.12.1. Overview
- 11.2.12.2. Products
- 11.2.12.3. SWOT Analysis
- 11.2.12.4. Recent Developments
- 11.2.12.5. Financials (Based on Availability)
- 11.2.1 Babcock International Group PLC
List of Figures
- Figure 1: Global Nuclear Power Reactor Decommissioning Services Revenue Breakdown (undefined, %) by Region 2025 & 2033
- Figure 2: North America Nuclear Power Reactor Decommissioning Services Revenue (undefined), by Application 2025 & 2033
- Figure 3: North America Nuclear Power Reactor Decommissioning Services Revenue Share (%), by Application 2025 & 2033
- Figure 4: North America Nuclear Power Reactor Decommissioning Services Revenue (undefined), by Types 2025 & 2033
- Figure 5: North America Nuclear Power Reactor Decommissioning Services Revenue Share (%), by Types 2025 & 2033
- Figure 6: North America Nuclear Power Reactor Decommissioning Services Revenue (undefined), by Country 2025 & 2033
- Figure 7: North America Nuclear Power Reactor Decommissioning Services Revenue Share (%), by Country 2025 & 2033
- Figure 8: South America Nuclear Power Reactor Decommissioning Services Revenue (undefined), by Application 2025 & 2033
- Figure 9: South America Nuclear Power Reactor Decommissioning Services Revenue Share (%), by Application 2025 & 2033
- Figure 10: South America Nuclear Power Reactor Decommissioning Services Revenue (undefined), by Types 2025 & 2033
- Figure 11: South America Nuclear Power Reactor Decommissioning Services Revenue Share (%), by Types 2025 & 2033
- Figure 12: South America Nuclear Power Reactor Decommissioning Services Revenue (undefined), by Country 2025 & 2033
- Figure 13: South America Nuclear Power Reactor Decommissioning Services Revenue Share (%), by Country 2025 & 2033
- Figure 14: Europe Nuclear Power Reactor Decommissioning Services Revenue (undefined), by Application 2025 & 2033
- Figure 15: Europe Nuclear Power Reactor Decommissioning Services Revenue Share (%), by Application 2025 & 2033
- Figure 16: Europe Nuclear Power Reactor Decommissioning Services Revenue (undefined), by Types 2025 & 2033
- Figure 17: Europe Nuclear Power Reactor Decommissioning Services Revenue Share (%), by Types 2025 & 2033
- Figure 18: Europe Nuclear Power Reactor Decommissioning Services Revenue (undefined), by Country 2025 & 2033
- Figure 19: Europe Nuclear Power Reactor Decommissioning Services Revenue Share (%), by Country 2025 & 2033
- Figure 20: Middle East & Africa Nuclear Power Reactor Decommissioning Services Revenue (undefined), by Application 2025 & 2033
- Figure 21: Middle East & Africa Nuclear Power Reactor Decommissioning Services Revenue Share (%), by Application 2025 & 2033
- Figure 22: Middle East & Africa Nuclear Power Reactor Decommissioning Services Revenue (undefined), by Types 2025 & 2033
- Figure 23: Middle East & Africa Nuclear Power Reactor Decommissioning Services Revenue Share (%), by Types 2025 & 2033
- Figure 24: Middle East & Africa Nuclear Power Reactor Decommissioning Services Revenue (undefined), by Country 2025 & 2033
- Figure 25: Middle East & Africa Nuclear Power Reactor Decommissioning Services Revenue Share (%), by Country 2025 & 2033
- Figure 26: Asia Pacific Nuclear Power Reactor Decommissioning Services Revenue (undefined), by Application 2025 & 2033
- Figure 27: Asia Pacific Nuclear Power Reactor Decommissioning Services Revenue Share (%), by Application 2025 & 2033
- Figure 28: Asia Pacific Nuclear Power Reactor Decommissioning Services Revenue (undefined), by Types 2025 & 2033
- Figure 29: Asia Pacific Nuclear Power Reactor Decommissioning Services Revenue Share (%), by Types 2025 & 2033
- Figure 30: Asia Pacific Nuclear Power Reactor Decommissioning Services Revenue (undefined), by Country 2025 & 2033
- Figure 31: Asia Pacific Nuclear Power Reactor Decommissioning Services Revenue Share (%), by Country 2025 & 2033
List of Tables
- Table 1: Global Nuclear Power Reactor Decommissioning Services Revenue undefined Forecast, by Application 2020 & 2033
- Table 2: Global Nuclear Power Reactor Decommissioning Services Revenue undefined Forecast, by Types 2020 & 2033
- Table 3: Global Nuclear Power Reactor Decommissioning Services Revenue undefined Forecast, by Region 2020 & 2033
- Table 4: Global Nuclear Power Reactor Decommissioning Services Revenue undefined Forecast, by Application 2020 & 2033
- Table 5: Global Nuclear Power Reactor Decommissioning Services Revenue undefined Forecast, by Types 2020 & 2033
- Table 6: Global Nuclear Power Reactor Decommissioning Services Revenue undefined Forecast, by Country 2020 & 2033
- Table 7: United States Nuclear Power Reactor Decommissioning Services Revenue (undefined) Forecast, by Application 2020 & 2033
- Table 8: Canada Nuclear Power Reactor Decommissioning Services Revenue (undefined) Forecast, by Application 2020 & 2033
- Table 9: Mexico Nuclear Power Reactor Decommissioning Services Revenue (undefined) Forecast, by Application 2020 & 2033
- Table 10: Global Nuclear Power Reactor Decommissioning Services Revenue undefined Forecast, by Application 2020 & 2033
- Table 11: Global Nuclear Power Reactor Decommissioning Services Revenue undefined Forecast, by Types 2020 & 2033
- Table 12: Global Nuclear Power Reactor Decommissioning Services Revenue undefined Forecast, by Country 2020 & 2033
- Table 13: Brazil Nuclear Power Reactor Decommissioning Services Revenue (undefined) Forecast, by Application 2020 & 2033
- Table 14: Argentina Nuclear Power Reactor Decommissioning Services Revenue (undefined) Forecast, by Application 2020 & 2033
- Table 15: Rest of South America Nuclear Power Reactor Decommissioning Services Revenue (undefined) Forecast, by Application 2020 & 2033
- Table 16: Global Nuclear Power Reactor Decommissioning Services Revenue undefined Forecast, by Application 2020 & 2033
- Table 17: Global Nuclear Power Reactor Decommissioning Services Revenue undefined Forecast, by Types 2020 & 2033
- Table 18: Global Nuclear Power Reactor Decommissioning Services Revenue undefined Forecast, by Country 2020 & 2033
- Table 19: United Kingdom Nuclear Power Reactor Decommissioning Services Revenue (undefined) Forecast, by Application 2020 & 2033
- Table 20: Germany Nuclear Power Reactor Decommissioning Services Revenue (undefined) Forecast, by Application 2020 & 2033
- Table 21: France Nuclear Power Reactor Decommissioning Services Revenue (undefined) Forecast, by Application 2020 & 2033
- Table 22: Italy Nuclear Power Reactor Decommissioning Services Revenue (undefined) Forecast, by Application 2020 & 2033
- Table 23: Spain Nuclear Power Reactor Decommissioning Services Revenue (undefined) Forecast, by Application 2020 & 2033
- Table 24: Russia Nuclear Power Reactor Decommissioning Services Revenue (undefined) Forecast, by Application 2020 & 2033
- Table 25: Benelux Nuclear Power Reactor Decommissioning Services Revenue (undefined) Forecast, by Application 2020 & 2033
- Table 26: Nordics Nuclear Power Reactor Decommissioning Services Revenue (undefined) Forecast, by Application 2020 & 2033
- Table 27: Rest of Europe Nuclear Power Reactor Decommissioning Services Revenue (undefined) Forecast, by Application 2020 & 2033
- Table 28: Global Nuclear Power Reactor Decommissioning Services Revenue undefined Forecast, by Application 2020 & 2033
- Table 29: Global Nuclear Power Reactor Decommissioning Services Revenue undefined Forecast, by Types 2020 & 2033
- Table 30: Global Nuclear Power Reactor Decommissioning Services Revenue undefined Forecast, by Country 2020 & 2033
- Table 31: Turkey Nuclear Power Reactor Decommissioning Services Revenue (undefined) Forecast, by Application 2020 & 2033
- Table 32: Israel Nuclear Power Reactor Decommissioning Services Revenue (undefined) Forecast, by Application 2020 & 2033
- Table 33: GCC Nuclear Power Reactor Decommissioning Services Revenue (undefined) Forecast, by Application 2020 & 2033
- Table 34: North Africa Nuclear Power Reactor Decommissioning Services Revenue (undefined) Forecast, by Application 2020 & 2033
- Table 35: South Africa Nuclear Power Reactor Decommissioning Services Revenue (undefined) Forecast, by Application 2020 & 2033
- Table 36: Rest of Middle East & Africa Nuclear Power Reactor Decommissioning Services Revenue (undefined) Forecast, by Application 2020 & 2033
- Table 37: Global Nuclear Power Reactor Decommissioning Services Revenue undefined Forecast, by Application 2020 & 2033
- Table 38: Global Nuclear Power Reactor Decommissioning Services Revenue undefined Forecast, by Types 2020 & 2033
- Table 39: Global Nuclear Power Reactor Decommissioning Services Revenue undefined Forecast, by Country 2020 & 2033
- Table 40: China Nuclear Power Reactor Decommissioning Services Revenue (undefined) Forecast, by Application 2020 & 2033
- Table 41: India Nuclear Power Reactor Decommissioning Services Revenue (undefined) Forecast, by Application 2020 & 2033
- Table 42: Japan Nuclear Power Reactor Decommissioning Services Revenue (undefined) Forecast, by Application 2020 & 2033
- Table 43: South Korea Nuclear Power Reactor Decommissioning Services Revenue (undefined) Forecast, by Application 2020 & 2033
- Table 44: ASEAN Nuclear Power Reactor Decommissioning Services Revenue (undefined) Forecast, by Application 2020 & 2033
- Table 45: Oceania Nuclear Power Reactor Decommissioning Services Revenue (undefined) Forecast, by Application 2020 & 2033
- Table 46: Rest of Asia Pacific Nuclear Power Reactor Decommissioning Services Revenue (undefined) Forecast, by Application 2020 & 2033
Frequently Asked Questions
1. What is the projected Compound Annual Growth Rate (CAGR) of the Nuclear Power Reactor Decommissioning Services?
The projected CAGR is approximately 15.44%.
2. Which companies are prominent players in the Nuclear Power Reactor Decommissioning Services?
Key companies in the market include Babcock International Group PLC, James Fisher & Sons PLC, NorthStar Group Services Inc., Fluor Corporation, GE Hitachi Nuclear Services, Studsvik AB, WS Atkins PLC, Enercon Services Inc., Areva S.A., AECOM, Bechtel Group Inc., Westinghouse Electric Company.
3. What are the main segments of the Nuclear Power Reactor Decommissioning Services?
The market segments include Application, Types.
4. Can you provide details about the market size?
The market size is estimated to be USD XXX N/A as of 2022.
5. What are some drivers contributing to market growth?
N/A
6. What are the notable trends driving market growth?
N/A
7. Are there any restraints impacting market growth?
N/A
8. Can you provide examples of recent developments in the market?
N/A
9. What pricing options are available for accessing the report?
Pricing options include single-user, multi-user, and enterprise licenses priced at USD 3350.00, USD 5025.00, and USD 6700.00 respectively.
10. Is the market size provided in terms of value or volume?
The market size is provided in terms of value, measured in N/A.
11. Are there any specific market keywords associated with the report?
Yes, the market keyword associated with the report is "Nuclear Power Reactor Decommissioning Services," which aids in identifying and referencing the specific market segment covered.
12. How do I determine which pricing option suits my needs best?
The pricing options vary based on user requirements and access needs. Individual users may opt for single-user licenses, while businesses requiring broader access may choose multi-user or enterprise licenses for cost-effective access to the report.
13. Are there any additional resources or data provided in the Nuclear Power Reactor Decommissioning Services report?
While the report offers comprehensive insights, it's advisable to review the specific contents or supplementary materials provided to ascertain if additional resources or data are available.
14. How can I stay updated on further developments or reports in the Nuclear Power Reactor Decommissioning Services?
To stay informed about further developments, trends, and reports in the Nuclear Power Reactor Decommissioning Services, consider subscribing to industry newsletters, following relevant companies and organizations, or regularly checking reputable industry news sources and publications.
Methodology
Step 1 - Identification of Relevant Samples Size from Population Database


Step 2 - Approaches for Defining Global Market Size (Value, Volume* & Price*)

Note*: In applicable scenarios
Step 3 - Data Sources
Primary Research
- Web Analytics
- Survey Reports
- Research Institute
- Latest Research Reports
- Opinion Leaders
Secondary Research
- Annual Reports
- White Paper
- Latest Press Release
- Industry Association
- Paid Database
- Investor Presentations

Step 4 - Data Triangulation
Involves using different sources of information in order to increase the validity of a study
These sources are likely to be stakeholders in a program - participants, other researchers, program staff, other community members, and so on.
Then we put all data in single framework & apply various statistical tools to find out the dynamic on the market.
During the analysis stage, feedback from the stakeholder groups would be compared to determine areas of agreement as well as areas of divergence