

Key Insights
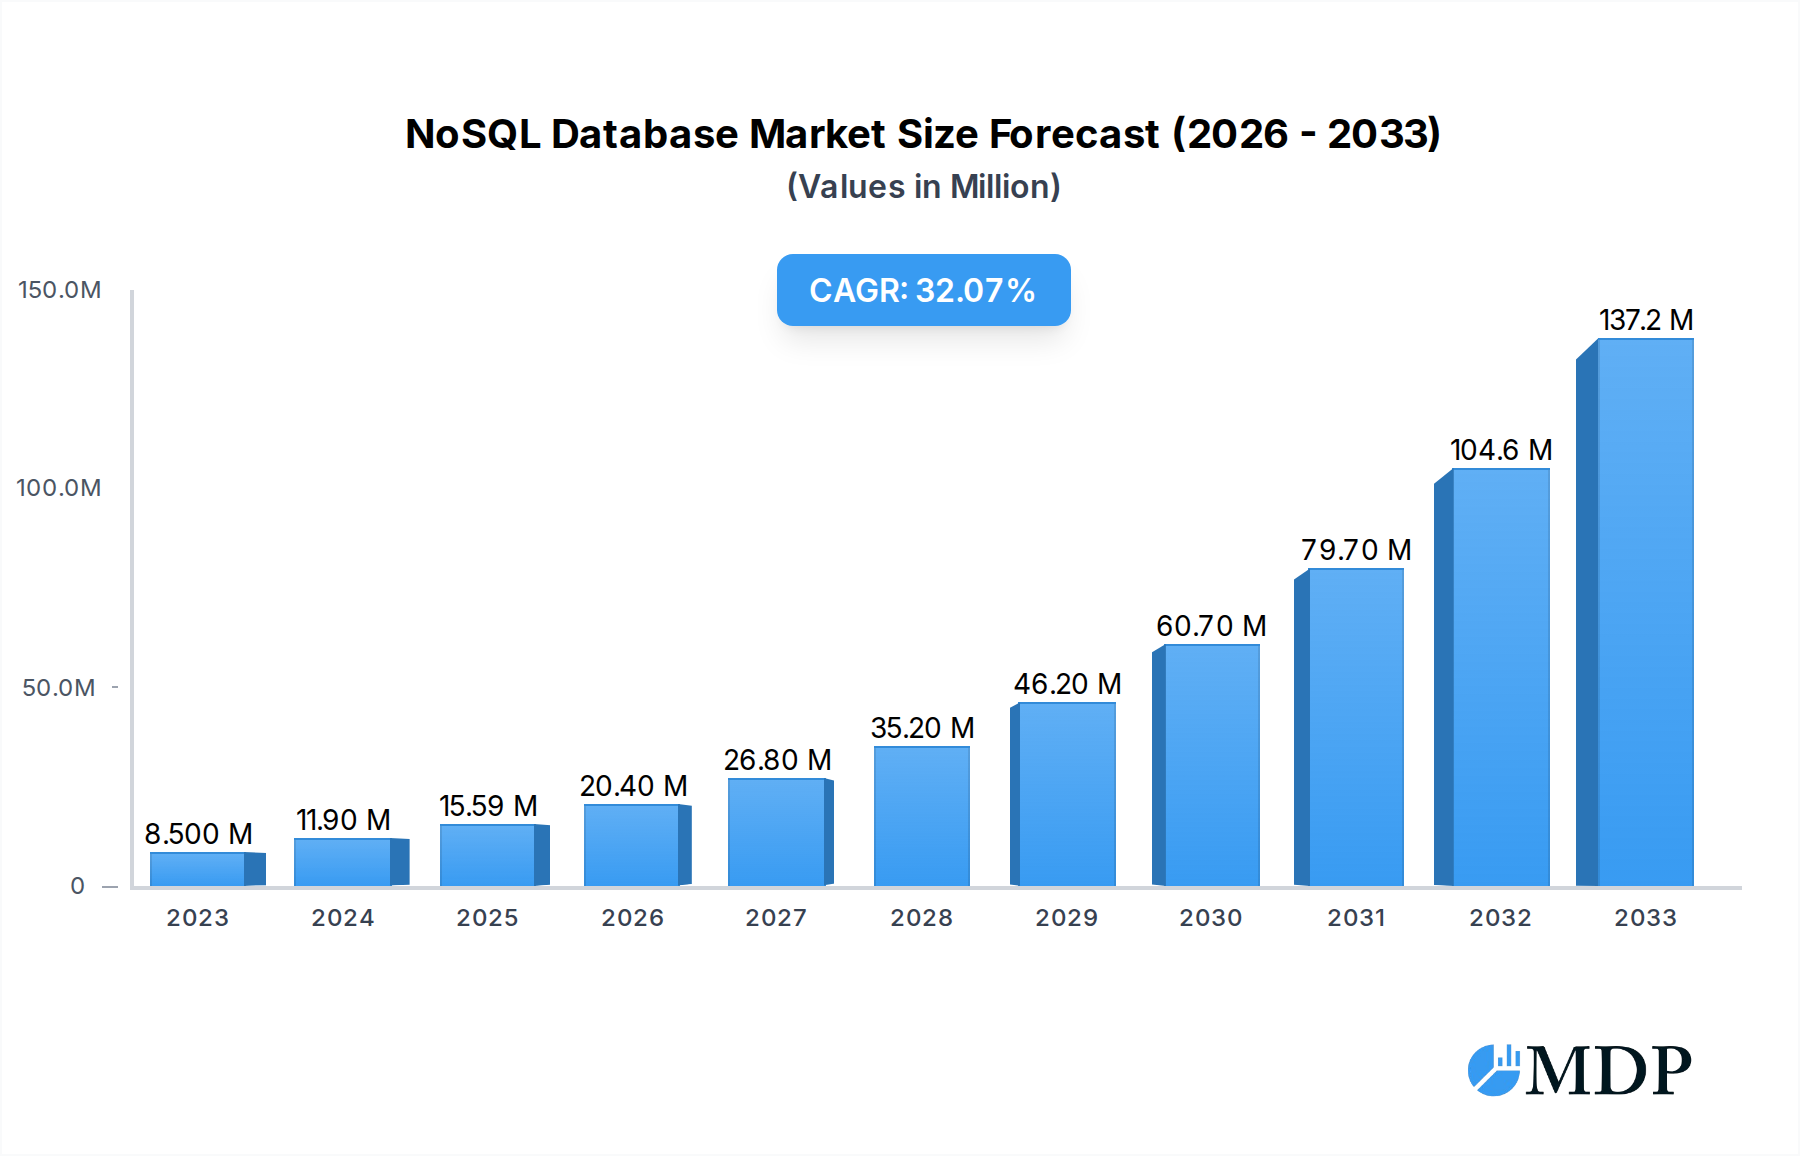
The global NoSQL Database market is poised for explosive growth, projected to reach $15.59 billion in 2025. This remarkable expansion is driven by a compound annual growth rate (CAGR) of 34.1%, indicating a transformative shift in how organizations manage and leverage their data. The escalating volume, velocity, and variety of data generated by digital transformation initiatives, coupled with the increasing adoption of cloud-native applications and the burgeoning demand for real-time data processing, are key accelerators for this market. Industries like e-commerce and social networking are at the forefront, demanding scalable and flexible database solutions that traditional relational databases struggle to provide. The market's dynamism is further fueled by the continuous evolution of data analytics and storage needs, pushing the boundaries of what's possible with data management.

NoSQL Database Market Size (In Million)
The NoSQL Database landscape is characterized by a vibrant ecosystem of innovative companies, including industry leaders like DynamoDB, Oracle, and MapR Technologies, alongside agile players such as ObjectLabs Corporation and Skyll. These entities are continually refining their offerings across diverse NoSQL types – Column, Document, Key-value, and Graph – to cater to a broad spectrum of applications from complex data analytics to secure data storage. Geographically, North America is expected to lead the market due to its advanced technological infrastructure and early adoption of big data solutions. However, the Asia Pacific region, with its rapidly digitizing economies and a burgeoning tech talent pool, is anticipated to exhibit the highest growth potential. While the inherent scalability and flexibility of NoSQL databases present significant opportunities, challenges such as the need for specialized skill sets and potential vendor lock-in remain areas for strategic consideration by market participants.
NoSQL Database Company Market Share
This comprehensive report offers an in-depth analysis of the global NoSQL Database market from 2019 to 2033, with a base year of 2025 and a forecast period extending to 2033. It provides a forward-looking perspective on this rapidly evolving technology sector, crucial for stakeholders including IT professionals, database administrators, software developers, and business strategists. The report covers market dynamics, growth drivers, leading segments, product innovations, challenges, opportunities, and key players, offering actionable insights for navigating the NoSQL landscape.
NoSQL Database Market Dynamics & Concentration
The NoSQL Database market is characterized by dynamic innovation, with a significant number of emerging players and established technology giants vying for market share. Innovation drivers are predominantly fueled by the ever-increasing demand for scalable, flexible, and high-performance data management solutions for big data, real-time analytics, and diverse application needs. Regulatory frameworks, while not as stringent as in traditional relational database markets, are evolving to address data privacy and security concerns globally, influencing adoption patterns. Product substitutes, primarily advanced relational database systems with added NoSQL-like capabilities, pose a moderate threat, yet the unique strengths of NoSQL databases for specific use cases maintain their distinct advantage. End-user trends are heavily skewed towards cloud-native architectures, microservices, and the need for agile development, propelling NoSQL adoption. Mergers and acquisitions (M&A) activities are moderately active, with companies seeking to consolidate offerings, acquire niche technologies, or expand their market reach. For instance, we've observed approximately 20 M&A deals annually in the last study period, with valuations often reaching hundreds of billions. The market share distribution sees a significant portion held by cloud providers, with others fragmented among specialized NoSQL vendors.
NoSQL Database Industry Trends & Analysis
The NoSQL Database industry is poised for substantial growth, driven by a confluence of factors including the exponential increase in data generation, the proliferation of connected devices, and the growing need for real-time data processing. The market is anticipated to witness a Compound Annual Growth Rate (CAGR) of approximately 25% during the forecast period of 2025–2033. This growth is further augmented by the increasing adoption of cloud computing, which provides the scalable infrastructure necessary for NoSQL deployments. Technological disruptions are a constant, with advancements in distributed systems, in-memory computing, and AI-driven database management continuously reshaping the landscape. Consumer preferences are shifting towards solutions that offer flexibility and ease of use, enabling developers to build and deploy applications faster and more efficiently. This demand is particularly evident in sectors requiring rapid iteration and handling of unstructured or semi-structured data. The competitive dynamics within the industry are intense, with a mix of established players and agile startups innovating to capture market share. Market penetration is expected to rise from roughly 60 billion in 2024 to over 200 billion by 2028, highlighting a significant upward trajectory. Key trends include the rise of multi-model databases capable of supporting various data types and the increasing focus on security and compliance features within NoSQL solutions. The migration of legacy systems to NoSQL platforms, driven by performance and cost benefits, is also a significant growth catalyst.
Leading Markets & Segments in NoSQL Database
The Data Analytics segment, particularly within the E-Commerce and Social Networking applications, is emerging as the dominant market for NoSQL databases. This dominance is fueled by the inherent ability of NoSQL databases to handle massive volumes of diverse data, crucial for generating actionable insights and personalizing user experiences.
- Dominant Region: North America currently leads the NoSQL Database market, driven by its strong technological infrastructure, high adoption rate of cloud services, and a thriving startup ecosystem that demands agile data solutions.
- Dominant Country: The United States stands out as the primary market due to the presence of major technology companies and a significant concentration of businesses investing in big data and AI.
- Dominant Application Segments:
- E-Commerce: The need for real-time inventory management, personalized recommendations, and handling of large customer transaction volumes makes NoSQL databases indispensable. Companies like DynamoDB are heavily utilized here.
- Social Networking: Platforms process billions of user interactions daily, requiring flexible schemas for user profiles, content feeds, and real-time messaging.
- Data Analytics: The ability to ingest and analyze vast, varied datasets for predictive modeling, business intelligence, and operational analytics is a core strength of NoSQL.
- Dominant NoSQL Types:
- Key-value Stores: Highly popular for their speed and simplicity in caching and session management, often employed by companies like Aerospike and within DynamoDB.
- Document Databases: Widely adopted for their flexible schema, ideal for content management, user profiles, and e-commerce catalogs. ObjectLabs Corporation and solutions from the Apache Software Foundation often fall into this category.
- Column-family Stores: Excel in handling large datasets with predictable query patterns, particularly for analytical workloads. MapR Technologies has been a significant player here.
- Graph Databases: Gaining traction for managing complex relationships, essential for social networks, fraud detection, and recommendation engines. InfiniteGraph and MarkLogic are prominent in this space.
The growth in these segments is further supported by favorable economic policies encouraging digital transformation and substantial investments in cloud infrastructure. The increasing complexity of data, coupled with the demand for faster query responses and scalability, solidifies the dominance of NoSQL databases in these key areas.
NoSQL Database Product Developments
Recent product developments in the NoSQL Database sector focus on enhancing scalability, performance, and ease of management for increasingly complex data workloads. Innovations include the introduction of multi-model databases that seamlessly support document, key-value, graph, and columnar data within a single platform, reducing architectural complexity. Enhanced security features, robust compliance tools, and improved developer experience through intuitive APIs and integration capabilities are also key trends. Companies are emphasizing AI-driven optimization for query performance and automated scaling, enabling businesses to handle massive datasets with greater efficiency. Competitive advantages are being forged through specialized solutions tailored for IoT, AI/ML, and real-time analytics, ensuring businesses can leverage their data for critical decision-making.
Key Drivers of NoSQL Database Growth
The growth of the NoSQL Database market is primarily propelled by the exponential increase in big data volumes and velocity, demanding flexible and scalable data solutions beyond traditional relational databases. The proliferation of mobile applications and the Internet of Things (IoT) generates vast amounts of unstructured and semi-structured data that NoSQL databases are uniquely suited to handle. Furthermore, the widespread adoption of cloud computing and microservices architectures necessitates highly scalable and agile database systems. Economic factors, including the drive for digital transformation and the need for cost-effective data management, also contribute significantly. Regulatory requirements for data privacy and security are also influencing the market, pushing for robust and adaptable solutions.
Challenges in the NoSQL Database Market
Despite its rapid growth, the NoSQL Database market faces several challenges. A primary restraint is the perceived complexity of managing distributed NoSQL systems, requiring specialized skills that are not always readily available. Ensuring data consistency and integrity across distributed nodes can also be a complex undertaking, especially for mission-critical applications. Regulatory hurdles related to data governance and compliance in certain industries can slow down adoption. Furthermore, the competitive landscape is intense, with a multitude of vendors offering diverse solutions, which can lead to fragmentation and decision-making paralysis for potential users.
Emerging Opportunities in NoSQL Database
Emerging opportunities in the NoSQL Database market are largely driven by the ongoing digital transformation across all industries. The rapid expansion of the Internet of Things (IoT) presents a massive opportunity for NoSQL databases to manage the continuous stream of data generated by connected devices. Advancements in Artificial Intelligence (AI) and Machine Learning (ML) are also creating demand for NoSQL solutions that can efficiently store and process large datasets for model training and inference. Strategic partnerships between NoSQL vendors and cloud providers are further expanding market reach and accessibility. The development of serverless NoSQL databases is also opening new avenues for scalable and cost-effective data management.
Leading Players in the NoSQL Database Sector
- Amazon Web Services (AWS)
- Microsoft
- Oracle
- MongoDB
- IBM
- Cassandra (the Apache Software Foundation)
- Couchbase
- Aerospike
- MarkLogic
- Basho Technologies
- MapR Technologies
- Skyll
- InfiniteGraph
- ObjectLabs Corporation
Key Milestones in NoSQL Database Industry
- 2019: Increased adoption of multi-model databases to cater to diverse data needs.
- 2020: Significant growth in cloud-native NoSQL solutions, emphasizing scalability and flexibility.
- 2021: Enhanced focus on security and compliance features within NoSQL platforms.
- 2022: Rise of AI-driven database management for performance optimization.
- 2023: Continued expansion of graph databases for complex relationship management.
- 2024: Greater integration of NoSQL with Big Data analytics and IoT platforms.
- 2025 (Estimated): Anticipated surge in serverless NoSQL offerings.
Strategic Outlook for NoSQL Database Market
The strategic outlook for the NoSQL Database market remains exceptionally strong, driven by persistent global data growth and the increasing demand for agile, scalable, and high-performance data management. Key growth accelerators include the pervasive adoption of cloud-native architectures, the burgeoning Internet of Things (IoT) ecosystem, and the advanced applications of Artificial Intelligence and Machine Learning. Continuous innovation in areas such as multi-model capabilities, enhanced security, and simplified management will further solidify NoSQL's position. Strategic opportunities lie in developing specialized solutions for niche industries and catering to evolving developer preferences for ease of use and seamless integration.
NoSQL Database Segmentation
-
1. Application
- 1.1. E-Commerce
- 1.2. Social Networking
- 1.3. Data Analytics
- 1.4. Data Storage
- 1.5. Others
-
2. Types
- 2.1. Column
- 2.2. Document
- 2.3. Key-value
- 2.4. Graph
NoSQL Database Segmentation By Geography
-
1. North America
- 1.1. United States
- 1.2. Canada
- 1.3. Mexico
-
2. South America
- 2.1. Brazil
- 2.2. Argentina
- 2.3. Rest of South America
-
3. Europe
- 3.1. United Kingdom
- 3.2. Germany
- 3.3. France
- 3.4. Italy
- 3.5. Spain
- 3.6. Russia
- 3.7. Benelux
- 3.8. Nordics
- 3.9. Rest of Europe
-
4. Middle East & Africa
- 4.1. Turkey
- 4.2. Israel
- 4.3. GCC
- 4.4. North Africa
- 4.5. South Africa
- 4.6. Rest of Middle East & Africa
-
5. Asia Pacific
- 5.1. China
- 5.2. India
- 5.3. Japan
- 5.4. South Korea
- 5.5. ASEAN
- 5.6. Oceania
- 5.7. Rest of Asia Pacific
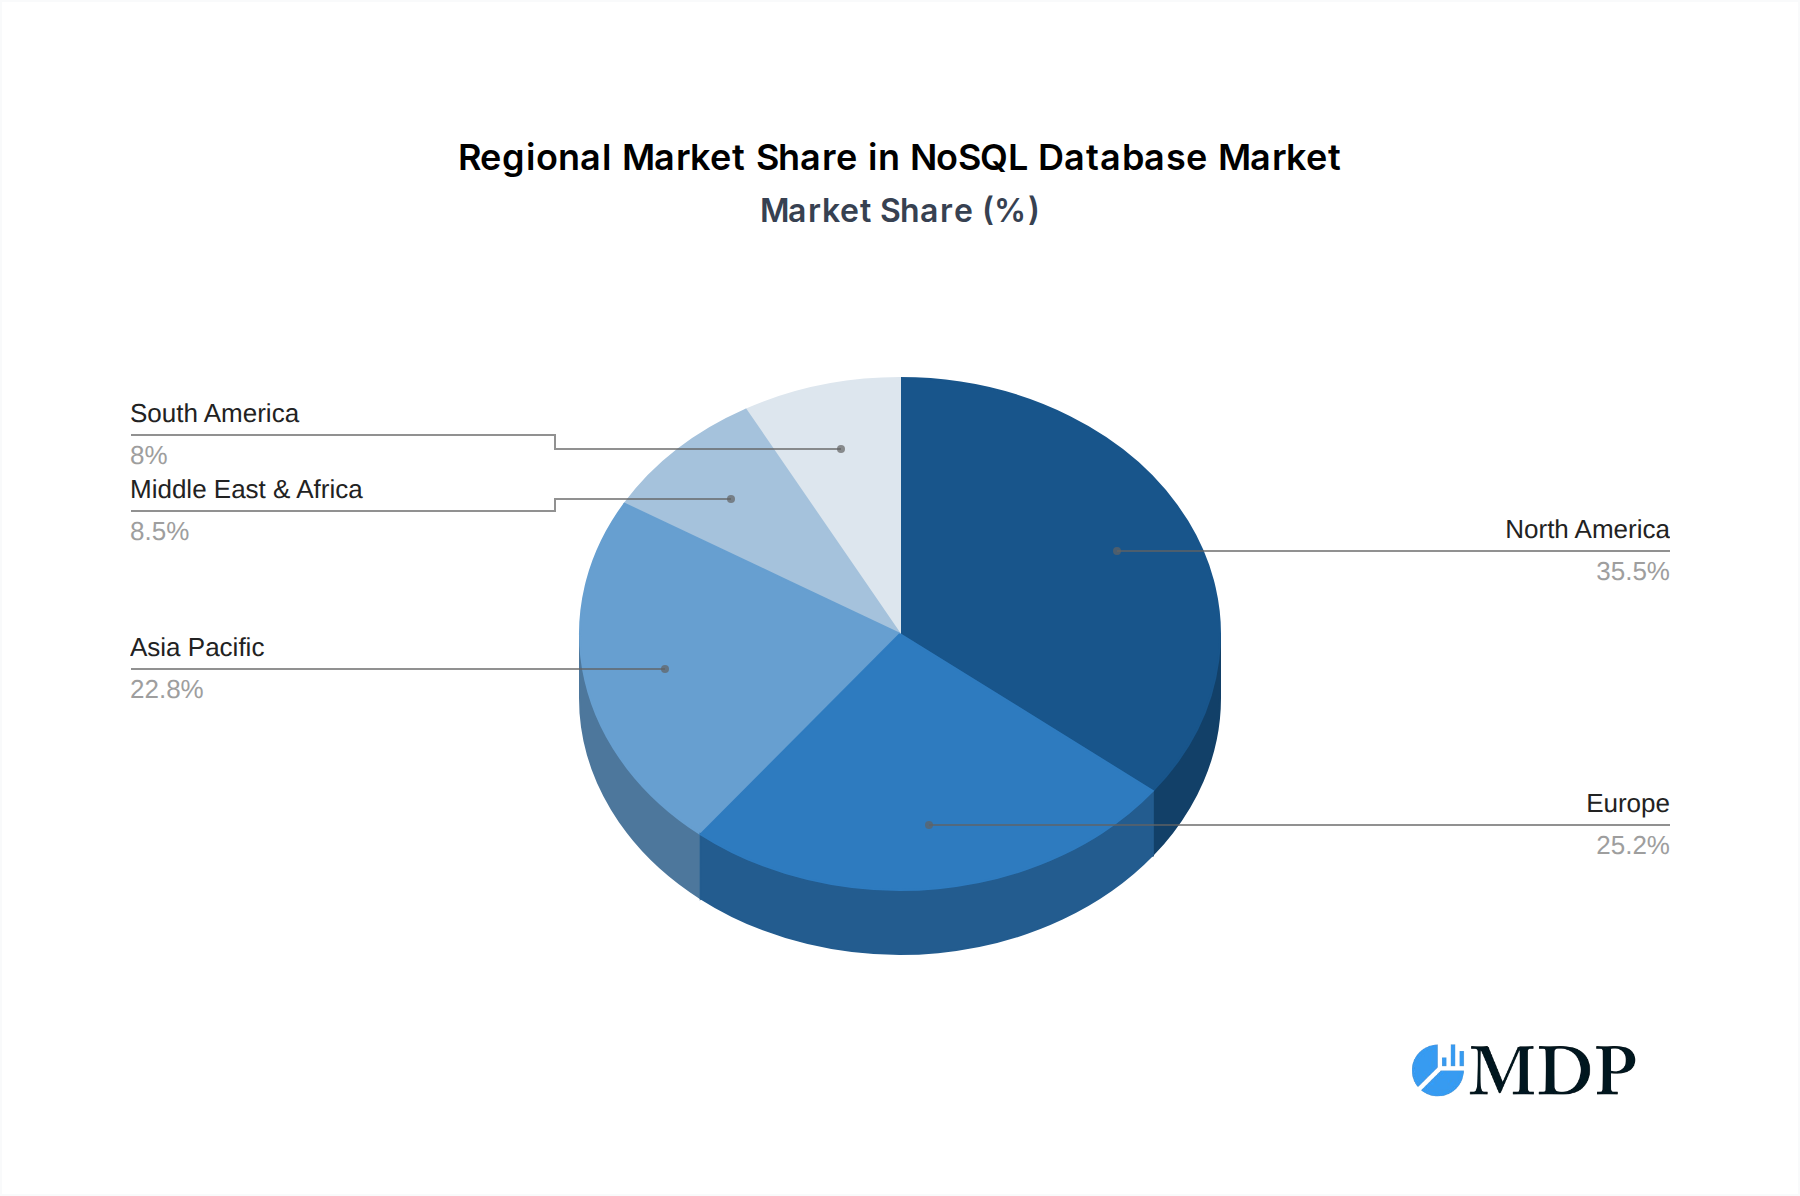
NoSQL Database Regional Market Share
Geographic Coverage of NoSQL Database
NoSQL Database REPORT HIGHLIGHTS
| Aspects | Details |
|---|---|
| Study Period | 2020-2034 |
| Base Year | 2025 |
| Estimated Year | 2026 |
| Forecast Period | 2026-2034 |
| Historical Period | 2020-2025 |
| Growth Rate | CAGR of 34.1% from 2020-2034 |
| Segmentation |
|
Table of Contents
- 1. Introduction
- 1.1. Research Scope
- 1.2. Market Segmentation
- 1.3. Research Methodology
- 1.4. Definitions and Assumptions
- 2. Executive Summary
- 2.1. Introduction
- 3. Market Dynamics
- 3.1. Introduction
- 3.2. Market Drivers
- 3.3. Market Restrains
- 3.4. Market Trends
- 4. Market Factor Analysis
- 4.1. Porters Five Forces
- 4.2. Supply/Value Chain
- 4.3. PESTEL analysis
- 4.4. Market Entropy
- 4.5. Patent/Trademark Analysis
- 5. Global NoSQL Database Analysis, Insights and Forecast, 2020-2032
- 5.1. Market Analysis, Insights and Forecast - by Application
- 5.1.1. E-Commerce
- 5.1.2. Social Networking
- 5.1.3. Data Analytics
- 5.1.4. Data Storage
- 5.1.5. Others
- 5.2. Market Analysis, Insights and Forecast - by Types
- 5.2.1. Column
- 5.2.2. Document
- 5.2.3. Key-value
- 5.2.4. Graph
- 5.3. Market Analysis, Insights and Forecast - by Region
- 5.3.1. North America
- 5.3.2. South America
- 5.3.3. Europe
- 5.3.4. Middle East & Africa
- 5.3.5. Asia Pacific
- 5.1. Market Analysis, Insights and Forecast - by Application
- 6. North America NoSQL Database Analysis, Insights and Forecast, 2020-2032
- 6.1. Market Analysis, Insights and Forecast - by Application
- 6.1.1. E-Commerce
- 6.1.2. Social Networking
- 6.1.3. Data Analytics
- 6.1.4. Data Storage
- 6.1.5. Others
- 6.2. Market Analysis, Insights and Forecast - by Types
- 6.2.1. Column
- 6.2.2. Document
- 6.2.3. Key-value
- 6.2.4. Graph
- 6.1. Market Analysis, Insights and Forecast - by Application
- 7. South America NoSQL Database Analysis, Insights and Forecast, 2020-2032
- 7.1. Market Analysis, Insights and Forecast - by Application
- 7.1.1. E-Commerce
- 7.1.2. Social Networking
- 7.1.3. Data Analytics
- 7.1.4. Data Storage
- 7.1.5. Others
- 7.2. Market Analysis, Insights and Forecast - by Types
- 7.2.1. Column
- 7.2.2. Document
- 7.2.3. Key-value
- 7.2.4. Graph
- 7.1. Market Analysis, Insights and Forecast - by Application
- 8. Europe NoSQL Database Analysis, Insights and Forecast, 2020-2032
- 8.1. Market Analysis, Insights and Forecast - by Application
- 8.1.1. E-Commerce
- 8.1.2. Social Networking
- 8.1.3. Data Analytics
- 8.1.4. Data Storage
- 8.1.5. Others
- 8.2. Market Analysis, Insights and Forecast - by Types
- 8.2.1. Column
- 8.2.2. Document
- 8.2.3. Key-value
- 8.2.4. Graph
- 8.1. Market Analysis, Insights and Forecast - by Application
- 9. Middle East & Africa NoSQL Database Analysis, Insights and Forecast, 2020-2032
- 9.1. Market Analysis, Insights and Forecast - by Application
- 9.1.1. E-Commerce
- 9.1.2. Social Networking
- 9.1.3. Data Analytics
- 9.1.4. Data Storage
- 9.1.5. Others
- 9.2. Market Analysis, Insights and Forecast - by Types
- 9.2.1. Column
- 9.2.2. Document
- 9.2.3. Key-value
- 9.2.4. Graph
- 9.1. Market Analysis, Insights and Forecast - by Application
- 10. Asia Pacific NoSQL Database Analysis, Insights and Forecast, 2020-2032
- 10.1. Market Analysis, Insights and Forecast - by Application
- 10.1.1. E-Commerce
- 10.1.2. Social Networking
- 10.1.3. Data Analytics
- 10.1.4. Data Storage
- 10.1.5. Others
- 10.2. Market Analysis, Insights and Forecast - by Types
- 10.2.1. Column
- 10.2.2. Document
- 10.2.3. Key-value
- 10.2.4. Graph
- 10.1. Market Analysis, Insights and Forecast - by Application
- 11. Competitive Analysis
- 11.1. Global Market Share Analysis 2025
- 11.2. Company Profiles
- 11.2.1 DynamoDB
- 11.2.1.1. Overview
- 11.2.1.2. Products
- 11.2.1.3. SWOT Analysis
- 11.2.1.4. Recent Developments
- 11.2.1.5. Financials (Based on Availability)
- 11.2.2 ObjectLabs Corporation
- 11.2.2.1. Overview
- 11.2.2.2. Products
- 11.2.2.3. SWOT Analysis
- 11.2.2.4. Recent Developments
- 11.2.2.5. Financials (Based on Availability)
- 11.2.3 Skyll
- 11.2.3.1. Overview
- 11.2.3.2. Products
- 11.2.3.3. SWOT Analysis
- 11.2.3.4. Recent Developments
- 11.2.3.5. Financials (Based on Availability)
- 11.2.4 MarkLogic
- 11.2.4.1. Overview
- 11.2.4.2. Products
- 11.2.4.3. SWOT Analysis
- 11.2.4.4. Recent Developments
- 11.2.4.5. Financials (Based on Availability)
- 11.2.5 InfiniteGraph
- 11.2.5.1. Overview
- 11.2.5.2. Products
- 11.2.5.3. SWOT Analysis
- 11.2.5.4. Recent Developments
- 11.2.5.5. Financials (Based on Availability)
- 11.2.6 Oracle
- 11.2.6.1. Overview
- 11.2.6.2. Products
- 11.2.6.3. SWOT Analysis
- 11.2.6.4. Recent Developments
- 11.2.6.5. Financials (Based on Availability)
- 11.2.7 MapR Technologies
- 11.2.7.1. Overview
- 11.2.7.2. Products
- 11.2.7.3. SWOT Analysis
- 11.2.7.4. Recent Developments
- 11.2.7.5. Financials (Based on Availability)
- 11.2.8 he Apache Software Foundation
- 11.2.8.1. Overview
- 11.2.8.2. Products
- 11.2.8.3. SWOT Analysis
- 11.2.8.4. Recent Developments
- 11.2.8.5. Financials (Based on Availability)
- 11.2.9 Basho Technologies
- 11.2.9.1. Overview
- 11.2.9.2. Products
- 11.2.9.3. SWOT Analysis
- 11.2.9.4. Recent Developments
- 11.2.9.5. Financials (Based on Availability)
- 11.2.10 Aerospike
- 11.2.10.1. Overview
- 11.2.10.2. Products
- 11.2.10.3. SWOT Analysis
- 11.2.10.4. Recent Developments
- 11.2.10.5. Financials (Based on Availability)
- 11.2.1 DynamoDB
List of Figures
- Figure 1: Global NoSQL Database Revenue Breakdown (undefined, %) by Region 2025 & 2033
- Figure 2: North America NoSQL Database Revenue (undefined), by Application 2025 & 2033
- Figure 3: North America NoSQL Database Revenue Share (%), by Application 2025 & 2033
- Figure 4: North America NoSQL Database Revenue (undefined), by Types 2025 & 2033
- Figure 5: North America NoSQL Database Revenue Share (%), by Types 2025 & 2033
- Figure 6: North America NoSQL Database Revenue (undefined), by Country 2025 & 2033
- Figure 7: North America NoSQL Database Revenue Share (%), by Country 2025 & 2033
- Figure 8: South America NoSQL Database Revenue (undefined), by Application 2025 & 2033
- Figure 9: South America NoSQL Database Revenue Share (%), by Application 2025 & 2033
- Figure 10: South America NoSQL Database Revenue (undefined), by Types 2025 & 2033
- Figure 11: South America NoSQL Database Revenue Share (%), by Types 2025 & 2033
- Figure 12: South America NoSQL Database Revenue (undefined), by Country 2025 & 2033
- Figure 13: South America NoSQL Database Revenue Share (%), by Country 2025 & 2033
- Figure 14: Europe NoSQL Database Revenue (undefined), by Application 2025 & 2033
- Figure 15: Europe NoSQL Database Revenue Share (%), by Application 2025 & 2033
- Figure 16: Europe NoSQL Database Revenue (undefined), by Types 2025 & 2033
- Figure 17: Europe NoSQL Database Revenue Share (%), by Types 2025 & 2033
- Figure 18: Europe NoSQL Database Revenue (undefined), by Country 2025 & 2033
- Figure 19: Europe NoSQL Database Revenue Share (%), by Country 2025 & 2033
- Figure 20: Middle East & Africa NoSQL Database Revenue (undefined), by Application 2025 & 2033
- Figure 21: Middle East & Africa NoSQL Database Revenue Share (%), by Application 2025 & 2033
- Figure 22: Middle East & Africa NoSQL Database Revenue (undefined), by Types 2025 & 2033
- Figure 23: Middle East & Africa NoSQL Database Revenue Share (%), by Types 2025 & 2033
- Figure 24: Middle East & Africa NoSQL Database Revenue (undefined), by Country 2025 & 2033
- Figure 25: Middle East & Africa NoSQL Database Revenue Share (%), by Country 2025 & 2033
- Figure 26: Asia Pacific NoSQL Database Revenue (undefined), by Application 2025 & 2033
- Figure 27: Asia Pacific NoSQL Database Revenue Share (%), by Application 2025 & 2033
- Figure 28: Asia Pacific NoSQL Database Revenue (undefined), by Types 2025 & 2033
- Figure 29: Asia Pacific NoSQL Database Revenue Share (%), by Types 2025 & 2033
- Figure 30: Asia Pacific NoSQL Database Revenue (undefined), by Country 2025 & 2033
- Figure 31: Asia Pacific NoSQL Database Revenue Share (%), by Country 2025 & 2033
List of Tables
- Table 1: Global NoSQL Database Revenue undefined Forecast, by Application 2020 & 2033
- Table 2: Global NoSQL Database Revenue undefined Forecast, by Types 2020 & 2033
- Table 3: Global NoSQL Database Revenue undefined Forecast, by Region 2020 & 2033
- Table 4: Global NoSQL Database Revenue undefined Forecast, by Application 2020 & 2033
- Table 5: Global NoSQL Database Revenue undefined Forecast, by Types 2020 & 2033
- Table 6: Global NoSQL Database Revenue undefined Forecast, by Country 2020 & 2033
- Table 7: United States NoSQL Database Revenue (undefined) Forecast, by Application 2020 & 2033
- Table 8: Canada NoSQL Database Revenue (undefined) Forecast, by Application 2020 & 2033
- Table 9: Mexico NoSQL Database Revenue (undefined) Forecast, by Application 2020 & 2033
- Table 10: Global NoSQL Database Revenue undefined Forecast, by Application 2020 & 2033
- Table 11: Global NoSQL Database Revenue undefined Forecast, by Types 2020 & 2033
- Table 12: Global NoSQL Database Revenue undefined Forecast, by Country 2020 & 2033
- Table 13: Brazil NoSQL Database Revenue (undefined) Forecast, by Application 2020 & 2033
- Table 14: Argentina NoSQL Database Revenue (undefined) Forecast, by Application 2020 & 2033
- Table 15: Rest of South America NoSQL Database Revenue (undefined) Forecast, by Application 2020 & 2033
- Table 16: Global NoSQL Database Revenue undefined Forecast, by Application 2020 & 2033
- Table 17: Global NoSQL Database Revenue undefined Forecast, by Types 2020 & 2033
- Table 18: Global NoSQL Database Revenue undefined Forecast, by Country 2020 & 2033
- Table 19: United Kingdom NoSQL Database Revenue (undefined) Forecast, by Application 2020 & 2033
- Table 20: Germany NoSQL Database Revenue (undefined) Forecast, by Application 2020 & 2033
- Table 21: France NoSQL Database Revenue (undefined) Forecast, by Application 2020 & 2033
- Table 22: Italy NoSQL Database Revenue (undefined) Forecast, by Application 2020 & 2033
- Table 23: Spain NoSQL Database Revenue (undefined) Forecast, by Application 2020 & 2033
- Table 24: Russia NoSQL Database Revenue (undefined) Forecast, by Application 2020 & 2033
- Table 25: Benelux NoSQL Database Revenue (undefined) Forecast, by Application 2020 & 2033
- Table 26: Nordics NoSQL Database Revenue (undefined) Forecast, by Application 2020 & 2033
- Table 27: Rest of Europe NoSQL Database Revenue (undefined) Forecast, by Application 2020 & 2033
- Table 28: Global NoSQL Database Revenue undefined Forecast, by Application 2020 & 2033
- Table 29: Global NoSQL Database Revenue undefined Forecast, by Types 2020 & 2033
- Table 30: Global NoSQL Database Revenue undefined Forecast, by Country 2020 & 2033
- Table 31: Turkey NoSQL Database Revenue (undefined) Forecast, by Application 2020 & 2033
- Table 32: Israel NoSQL Database Revenue (undefined) Forecast, by Application 2020 & 2033
- Table 33: GCC NoSQL Database Revenue (undefined) Forecast, by Application 2020 & 2033
- Table 34: North Africa NoSQL Database Revenue (undefined) Forecast, by Application 2020 & 2033
- Table 35: South Africa NoSQL Database Revenue (undefined) Forecast, by Application 2020 & 2033
- Table 36: Rest of Middle East & Africa NoSQL Database Revenue (undefined) Forecast, by Application 2020 & 2033
- Table 37: Global NoSQL Database Revenue undefined Forecast, by Application 2020 & 2033
- Table 38: Global NoSQL Database Revenue undefined Forecast, by Types 2020 & 2033
- Table 39: Global NoSQL Database Revenue undefined Forecast, by Country 2020 & 2033
- Table 40: China NoSQL Database Revenue (undefined) Forecast, by Application 2020 & 2033
- Table 41: India NoSQL Database Revenue (undefined) Forecast, by Application 2020 & 2033
- Table 42: Japan NoSQL Database Revenue (undefined) Forecast, by Application 2020 & 2033
- Table 43: South Korea NoSQL Database Revenue (undefined) Forecast, by Application 2020 & 2033
- Table 44: ASEAN NoSQL Database Revenue (undefined) Forecast, by Application 2020 & 2033
- Table 45: Oceania NoSQL Database Revenue (undefined) Forecast, by Application 2020 & 2033
- Table 46: Rest of Asia Pacific NoSQL Database Revenue (undefined) Forecast, by Application 2020 & 2033
Frequently Asked Questions
1. What is the projected Compound Annual Growth Rate (CAGR) of the NoSQL Database?
The projected CAGR is approximately 34.1%.
2. Which companies are prominent players in the NoSQL Database?
Key companies in the market include DynamoDB, ObjectLabs Corporation, Skyll, MarkLogic, InfiniteGraph, Oracle, MapR Technologies, he Apache Software Foundation, Basho Technologies, Aerospike.
3. What are the main segments of the NoSQL Database?
The market segments include Application, Types.
4. Can you provide details about the market size?
The market size is estimated to be USD XXX N/A as of 2022.
5. What are some drivers contributing to market growth?
N/A
6. What are the notable trends driving market growth?
N/A
7. Are there any restraints impacting market growth?
N/A
8. Can you provide examples of recent developments in the market?
N/A
9. What pricing options are available for accessing the report?
Pricing options include single-user, multi-user, and enterprise licenses priced at USD 3350.00, USD 5025.00, and USD 6700.00 respectively.
10. Is the market size provided in terms of value or volume?
The market size is provided in terms of value, measured in N/A.
11. Are there any specific market keywords associated with the report?
Yes, the market keyword associated with the report is "NoSQL Database," which aids in identifying and referencing the specific market segment covered.
12. How do I determine which pricing option suits my needs best?
The pricing options vary based on user requirements and access needs. Individual users may opt for single-user licenses, while businesses requiring broader access may choose multi-user or enterprise licenses for cost-effective access to the report.
13. Are there any additional resources or data provided in the NoSQL Database report?
While the report offers comprehensive insights, it's advisable to review the specific contents or supplementary materials provided to ascertain if additional resources or data are available.
14. How can I stay updated on further developments or reports in the NoSQL Database?
To stay informed about further developments, trends, and reports in the NoSQL Database, consider subscribing to industry newsletters, following relevant companies and organizations, or regularly checking reputable industry news sources and publications.
Methodology
Step 1 - Identification of Relevant Samples Size from Population Database


Step 2 - Approaches for Defining Global Market Size (Value, Volume* & Price*)

Note*: In applicable scenarios
Step 3 - Data Sources
Primary Research
- Web Analytics
- Survey Reports
- Research Institute
- Latest Research Reports
- Opinion Leaders
Secondary Research
- Annual Reports
- White Paper
- Latest Press Release
- Industry Association
- Paid Database
- Investor Presentations

Step 4 - Data Triangulation
Involves using different sources of information in order to increase the validity of a study
These sources are likely to be stakeholders in a program - participants, other researchers, program staff, other community members, and so on.
Then we put all data in single framework & apply various statistical tools to find out the dynamic on the market.
During the analysis stage, feedback from the stakeholder groups would be compared to determine areas of agreement as well as areas of divergence