

Key Insights
The global market for needle terminals is poised for robust expansion, projected to reach an estimated $8.1 billion in 2025 and grow at a Compound Annual Growth Rate (CAGR) of 6.1% through 2033. This substantial growth is fueled by an escalating demand across a diverse range of industries, most notably automotive electronics and consumer electronics, which are rapidly integrating advanced electrical components. The burgeoning new energy sector, encompassing electric vehicles and renewable energy infrastructure, is also a significant driver, necessitating reliable and high-performance terminal solutions for power transmission and management. Furthermore, the continuous innovation in home appliances and automation control systems, driven by the pursuit of enhanced efficiency, safety, and connectivity, further underpins the market's upward trajectory. The market benefits from ongoing technological advancements leading to the development of more durable, efficient, and miniaturized needle terminal solutions catering to increasingly sophisticated application requirements.
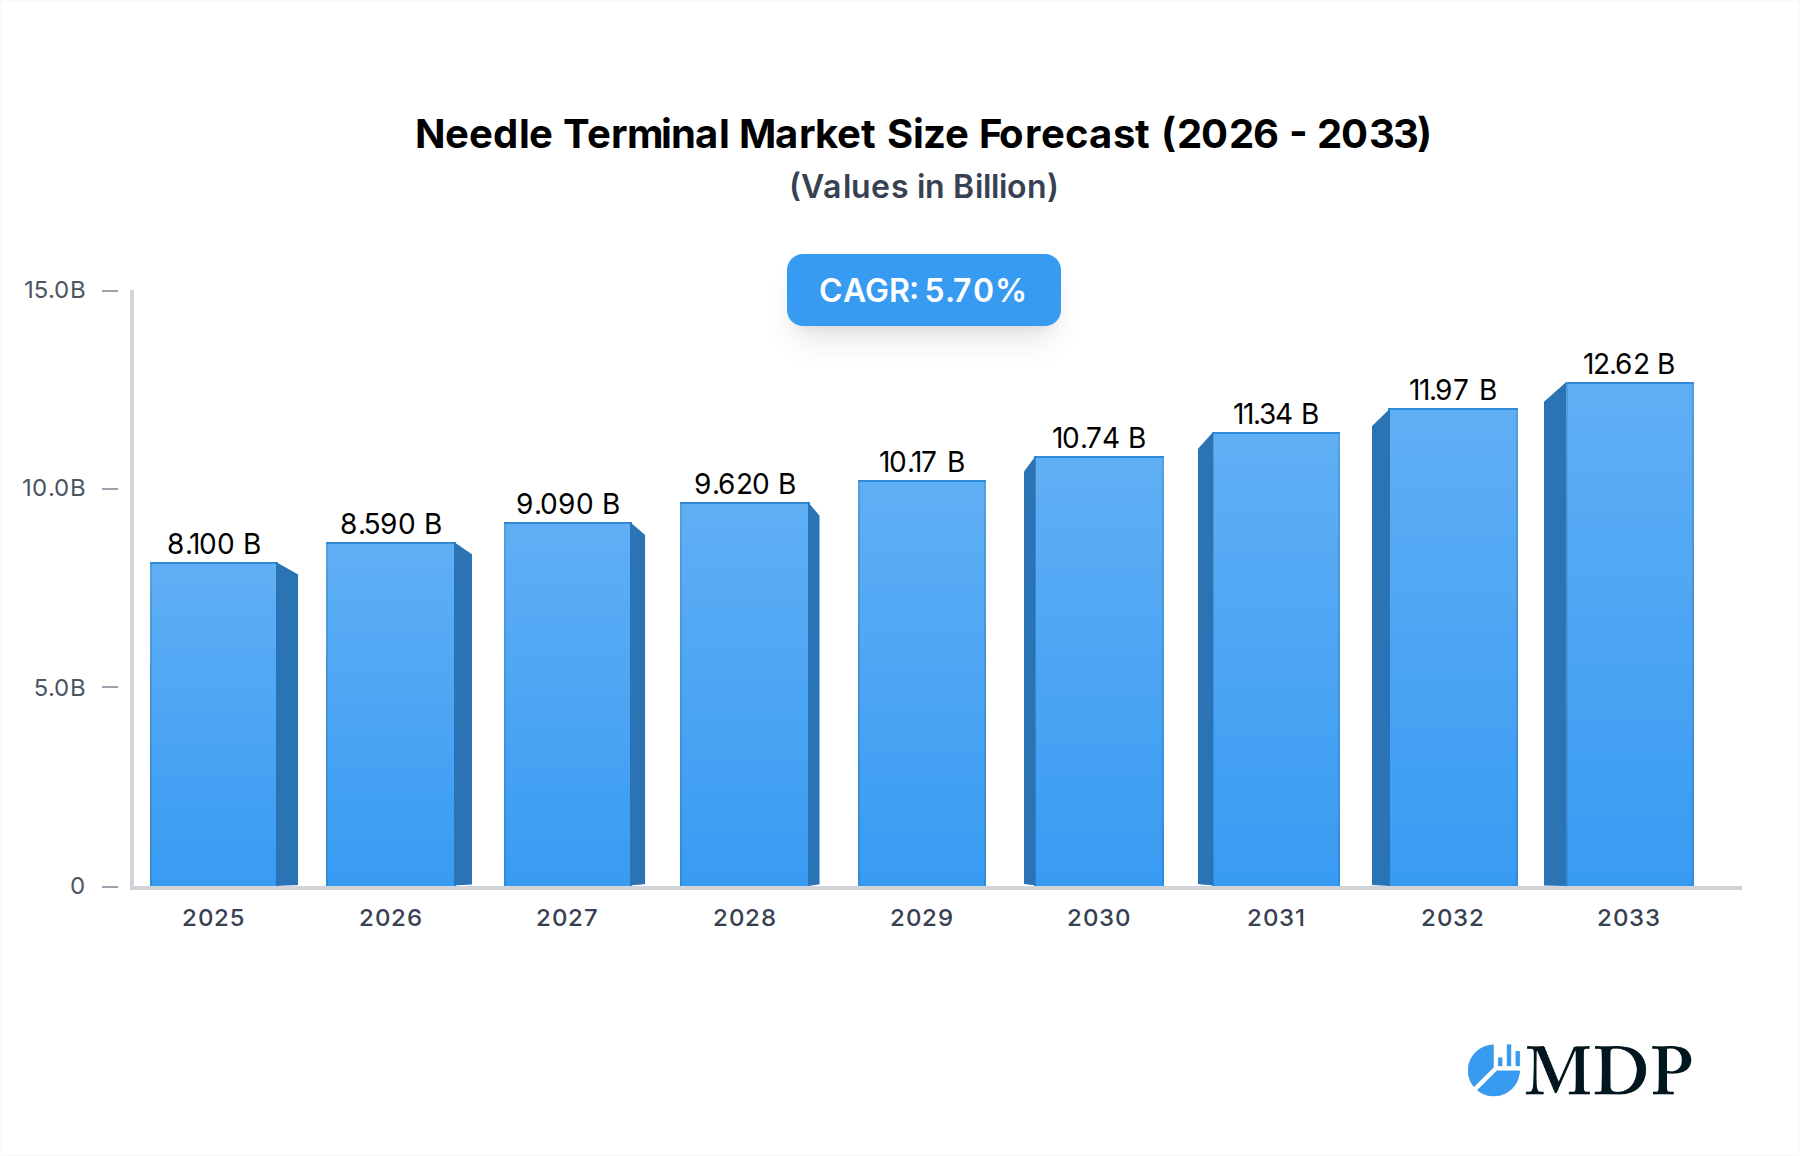
Needle Terminal Market Size (In Billion)
Key trends shaping the needle terminal market include the increasing adoption of high-density connectors and miniaturization, driven by the demand for smaller and lighter electronic devices. The growing emphasis on electric vehicles (EVs) and the expansion of charging infrastructure are creating substantial opportunities for specialized needle terminals designed for high-voltage and high-current applications. The automation control industry's demand for robust and reliable connectivity solutions, especially in harsh industrial environments, is another significant growth factor. However, the market faces certain restraints, including fluctuations in raw material prices, particularly copper and plastics, which can impact manufacturing costs and product pricing. Stringent regulatory requirements concerning electrical safety and environmental compliance across different regions also present a challenge for manufacturers to navigate. Despite these challenges, the market's inherent growth drivers, coupled with ongoing innovation and the expanding application landscape, suggest a promising outlook for needle terminals.

Needle Terminal Company Market Share
Needle Terminal Market: Comprehensive Analysis & Future Projections (2019–2033)
This in-depth report provides a definitive analysis of the global Needle Terminal market, meticulously examining its dynamics, trends, and future trajectory from 2019 to 2033. Leveraging extensive data and expert insights, this report is an indispensable resource for industry stakeholders seeking to understand market concentration, identify growth drivers, and navigate the competitive landscape. The Base Year is 2025, with the Forecast Period spanning 2025–2033, built upon a robust Study Period of 2019–2033 and a Historical Period of 2019–2024.
Needle Terminal Market Dynamics & Concentration
The global Needle Terminal market, valued at over 10 billion USD in 2025, exhibits a moderate to high concentration, with key players like TE Connectivity and Amphenol Industrial holding significant market share. The market is propelled by innovation drivers such as the increasing demand for miniaturized and high-performance connectors in the automotive and consumer electronics sectors. Regulatory frameworks, particularly those focusing on safety and environmental compliance, play a crucial role in shaping product development and market entry strategies. The threat of product substitutes, while present from alternative connector types, is mitigated by the unique advantages of needle terminals in specific applications requiring secure and reliable connections. End-user trends clearly indicate a strong preference for solutions that enhance electrical efficiency and signal integrity. Mergers and acquisitions (M&A) activity has been a notable feature, with an estimated over 10 significant M&A deals recorded in the historical period, aiming to consolidate market presence and expand technological capabilities.
Needle Terminal Industry Trends & Analysis
The Needle Terminal industry is experiencing robust growth, with an estimated Compound Annual Growth Rate (CAGR) of over 7% projected for the forecast period. This expansion is primarily driven by the relentless surge in demand from the automotive sector, fueled by the proliferation of electric vehicles (EVs) and advanced driver-assistance systems (ADAS). The home appliances and consumer electronics segments are also significant contributors, with consumers increasingly demanding more sophisticated and reliable electronic devices. Technological disruptions, such as advancements in material science leading to more durable and conductive needle terminals, are enhancing product performance and opening new application avenues. Consumer preferences are leaning towards compact, high-density connectors that facilitate space savings and improved aesthetics in end products. The competitive dynamics are characterized by a blend of established global players and emerging regional manufacturers, each vying for market share through product differentiation and cost-effectiveness. Market penetration is expected to deepen across diverse industries as the benefits of needle terminals become more widely recognized.
Leading Markets & Segments in Needle Terminal
The Automotive Electronics application segment stands as the dominant force in the global Needle Terminal market, projected to account for over 40% of the total market value in 2025. This dominance is underpinned by several key drivers. The burgeoning electric vehicle industry necessitates a vast array of high-reliability connectors for battery systems, charging infrastructure, and sophisticated electronic control units. Furthermore, the increasing integration of advanced driver-assistance systems (ADAS), infotainment systems, and connectivity features within modern vehicles drives the demand for a wide spectrum of needle terminals.
- Key Drivers for Automotive Electronics Dominance:
- Rapid Electrification: The global shift towards electric mobility is a primary catalyst, requiring specialized, high-voltage, and high-current handling needle terminals.
- ADAS and Autonomous Driving: The complexity of sensor integration and data processing in ADAS and future autonomous vehicles demands robust and reliable interconnections.
- Connectivity and Infotainment: The integration of advanced infotainment systems and vehicle-to-everything (V2X) communication requires numerous high-speed data connectors.
- Stringent Safety Regulations: The automotive industry's adherence to rigorous safety standards necessitates the use of highly dependable and certified connector solutions.
Within the Types classification, the 10-20 AWG segment is anticipated to lead the market, representing an estimated over 35% of market share in 2025. This segment caters to a broad spectrum of applications where a balance of current-carrying capacity and wire gauge is crucial.
- Key Drivers for 10-20 AWG Dominance:
- Versatility in Applications: This gauge is widely used in various applications across automotive, industrial automation, and consumer electronics, offering a versatile solution.
- Balance of Performance and Size: It provides sufficient conductivity for many applications without being overly bulky, fitting well into space-constrained designs.
- Cost-Effectiveness: Compared to larger gauge wires and terminals, the 10-20 AWG range often presents a more economical option for manufacturers.
The New Energy Industry is also emerging as a significant growth area, showcasing a rapid expansion rate driven by global initiatives for sustainable energy solutions and grid modernization.
Needle Terminal Product Developments
Product developments in the needle terminal market are characterized by a strong focus on enhanced conductivity, miniaturization, and improved durability. Manufacturers are innovating with advanced plating materials and unique terminal designs to reduce contact resistance and ensure superior signal integrity, crucial for high-frequency applications in consumer electronics and telecommunications. The trend towards smaller and more compact devices is driving the development of micro-needle terminals, allowing for higher connection densities. Furthermore, advancements in material science are leading to terminals with greater resistance to extreme temperatures and corrosive environments, expanding their applicability in harsh industrial settings and the new energy sector. These innovations provide competitive advantages by enabling more efficient, reliable, and space-saving electrical connections.
Key Drivers of Needle Terminal Growth
The global Needle Terminal market is propelled by several key drivers. Technologically, the increasing demand for higher data transfer speeds and signal integrity in consumer electronics and automotive applications necessitates the use of advanced needle terminal solutions. Economically, the sustained growth in the automotive industry, particularly the booming electric vehicle segment, and the expansion of smart home devices are creating substantial demand. Regulatory factors, such as stricter safety standards for electrical components across various industries, are also indirectly driving the adoption of high-quality and reliable needle terminals. Furthermore, the ongoing trend of miniaturization across all electronic devices necessitates smaller, more efficient interconnect solutions.
Challenges in the Needle Terminal Market
Despite the positive growth trajectory, the Needle Terminal market faces several challenges. Intense price competition among manufacturers, particularly from emerging economies, can put pressure on profit margins. Fluctuations in raw material prices, such as copper and precious metals used in plating, can impact production costs and lead to price volatility. Furthermore, the development and adoption of alternative interconnect technologies, although currently niche, pose a potential long-term threat. Supply chain disruptions, as witnessed in recent global events, can impact the availability of raw materials and finished goods, affecting production schedules and delivery times. Navigating complex and evolving international trade regulations and tariffs also presents a significant hurdle for global market expansion.
Emerging Opportunities in Needle Terminal
The Needle Terminal market is ripe with emerging opportunities. The rapid expansion of the Internet of Things (IoT) ecosystem presents a significant avenue for growth, as billions of connected devices will require reliable and compact interconnect solutions. The continuous innovation in the renewable energy sector, including solar power and wind energy infrastructure, demands robust and weather-resistant needle terminals for efficient power transmission. Strategic partnerships between needle terminal manufacturers and leading electronics OEMs can foster co-development of customized solutions for next-generation products. Furthermore, the increasing adoption of advanced manufacturing techniques, such as automation and AI-driven quality control, can lead to enhanced production efficiency and product reliability, creating a competitive edge.
Leading Players in the Needle Terminal Sector
- TE Connectivity
- Amphenol Industrial
- ABB
- Japan Solderless Terminals
- Molex
- Wurth Elektronik
- Hoffman Products
- Panduit
- Hongyun Hardware
- Lianfeng Electronics
Key Milestones in Needle Terminal Industry
- 2019: Launch of high-density, miniaturized needle terminals for 5G infrastructure development.
- 2020: Introduction of advanced plating technologies enhancing corrosion resistance for automotive applications.
- 2021: Significant investment in R&D for sustainable and eco-friendly terminal materials.
- 2022: Major acquisition by a leading connector manufacturer to expand global footprint in the automotive sector.
- 2023: Development of specialized needle terminals for high-voltage applications in the new energy industry.
Strategic Outlook for Needle Terminal Market
The strategic outlook for the Needle Terminal market remains exceptionally positive, driven by the relentless pace of technological advancement and the global push towards electrification and connectivity. Growth accelerators include the expanding electric vehicle market, the proliferation of IoT devices, and the continuous demand for higher performance in consumer electronics. Companies that focus on innovation, particularly in areas of miniaturization, enhanced conductivity, and environmental resilience, will be well-positioned for success. Strategic partnerships and targeted M&A activities will continue to play a vital role in market consolidation and expansion. The industry's ability to adapt to evolving regulatory landscapes and supply chain dynamics will be critical in capitalizing on the substantial future market potential.
Needle Terminal Segmentation
-
1. Application
- 1.1. Automotive Electronics
- 1.2. Home Appliances
- 1.3. Consumer Electronics
- 1.4. New Energy Industry
- 1.5. Automation Control Industry
-
2. Types
- 2.1. Below10 AWG
- 2.2. 10-20 AWG
- 2.3. Above20 AWG
Needle Terminal Segmentation By Geography
-
1. North America
- 1.1. United States
- 1.2. Canada
- 1.3. Mexico
-
2. South America
- 2.1. Brazil
- 2.2. Argentina
- 2.3. Rest of South America
-
3. Europe
- 3.1. United Kingdom
- 3.2. Germany
- 3.3. France
- 3.4. Italy
- 3.5. Spain
- 3.6. Russia
- 3.7. Benelux
- 3.8. Nordics
- 3.9. Rest of Europe
-
4. Middle East & Africa
- 4.1. Turkey
- 4.2. Israel
- 4.3. GCC
- 4.4. North Africa
- 4.5. South Africa
- 4.6. Rest of Middle East & Africa
-
5. Asia Pacific
- 5.1. China
- 5.2. India
- 5.3. Japan
- 5.4. South Korea
- 5.5. ASEAN
- 5.6. Oceania
- 5.7. Rest of Asia Pacific
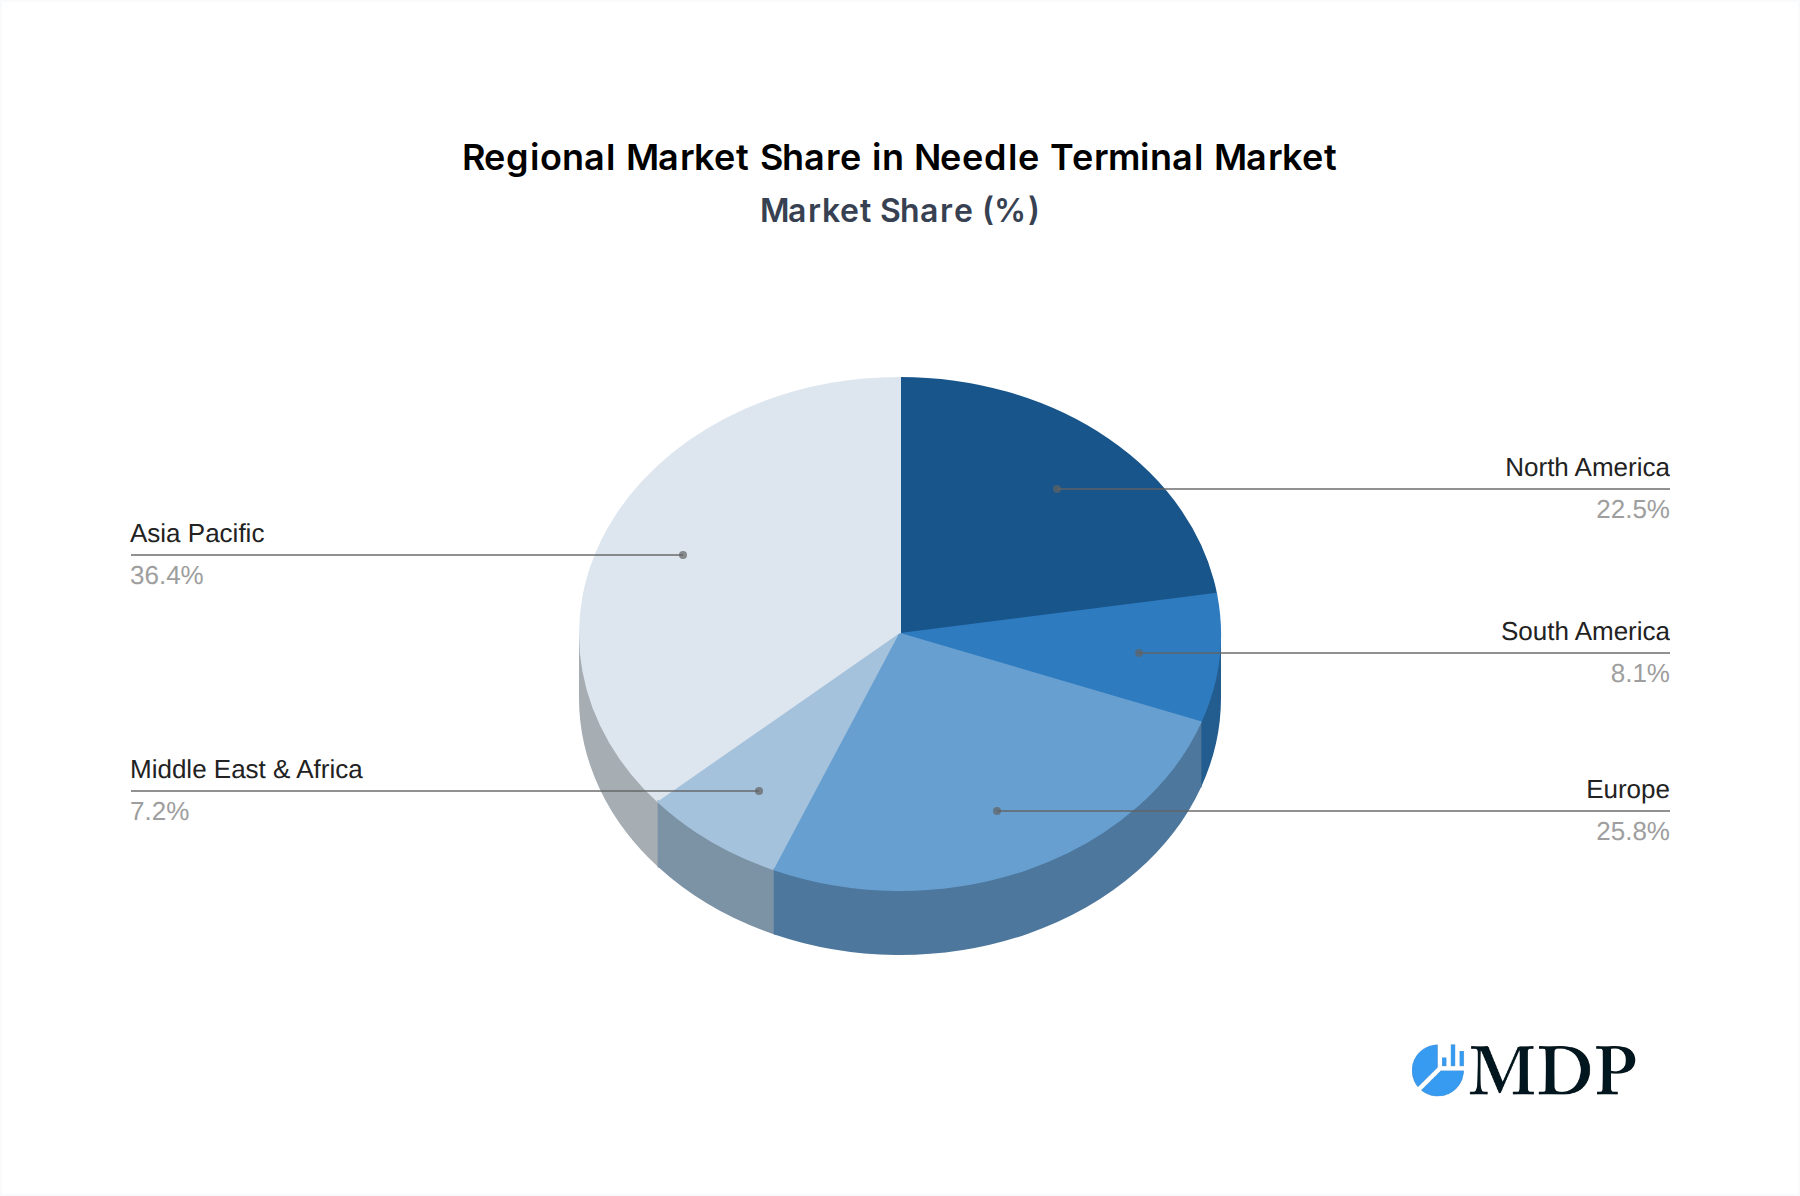
Needle Terminal Regional Market Share
Geographic Coverage of Needle Terminal
Needle Terminal REPORT HIGHLIGHTS
| Aspects | Details |
|---|---|
| Study Period | 2020-2034 |
| Base Year | 2025 |
| Estimated Year | 2026 |
| Forecast Period | 2026-2034 |
| Historical Period | 2020-2025 |
| Growth Rate | CAGR of 6.1% from 2020-2034 |
| Segmentation |
|
Table of Contents
- 1. Introduction
- 1.1. Research Scope
- 1.2. Market Segmentation
- 1.3. Research Methodology
- 1.4. Definitions and Assumptions
- 2. Executive Summary
- 2.1. Introduction
- 3. Market Dynamics
- 3.1. Introduction
- 3.2. Market Drivers
- 3.3. Market Restrains
- 3.4. Market Trends
- 4. Market Factor Analysis
- 4.1. Porters Five Forces
- 4.2. Supply/Value Chain
- 4.3. PESTEL analysis
- 4.4. Market Entropy
- 4.5. Patent/Trademark Analysis
- 5. Global Needle Terminal Analysis, Insights and Forecast, 2020-2032
- 5.1. Market Analysis, Insights and Forecast - by Application
- 5.1.1. Automotive Electronics
- 5.1.2. Home Appliances
- 5.1.3. Consumer Electronics
- 5.1.4. New Energy Industry
- 5.1.5. Automation Control Industry
- 5.2. Market Analysis, Insights and Forecast - by Types
- 5.2.1. Below10 AWG
- 5.2.2. 10-20 AWG
- 5.2.3. Above20 AWG
- 5.3. Market Analysis, Insights and Forecast - by Region
- 5.3.1. North America
- 5.3.2. South America
- 5.3.3. Europe
- 5.3.4. Middle East & Africa
- 5.3.5. Asia Pacific
- 5.1. Market Analysis, Insights and Forecast - by Application
- 6. North America Needle Terminal Analysis, Insights and Forecast, 2020-2032
- 6.1. Market Analysis, Insights and Forecast - by Application
- 6.1.1. Automotive Electronics
- 6.1.2. Home Appliances
- 6.1.3. Consumer Electronics
- 6.1.4. New Energy Industry
- 6.1.5. Automation Control Industry
- 6.2. Market Analysis, Insights and Forecast - by Types
- 6.2.1. Below10 AWG
- 6.2.2. 10-20 AWG
- 6.2.3. Above20 AWG
- 6.1. Market Analysis, Insights and Forecast - by Application
- 7. South America Needle Terminal Analysis, Insights and Forecast, 2020-2032
- 7.1. Market Analysis, Insights and Forecast - by Application
- 7.1.1. Automotive Electronics
- 7.1.2. Home Appliances
- 7.1.3. Consumer Electronics
- 7.1.4. New Energy Industry
- 7.1.5. Automation Control Industry
- 7.2. Market Analysis, Insights and Forecast - by Types
- 7.2.1. Below10 AWG
- 7.2.2. 10-20 AWG
- 7.2.3. Above20 AWG
- 7.1. Market Analysis, Insights and Forecast - by Application
- 8. Europe Needle Terminal Analysis, Insights and Forecast, 2020-2032
- 8.1. Market Analysis, Insights and Forecast - by Application
- 8.1.1. Automotive Electronics
- 8.1.2. Home Appliances
- 8.1.3. Consumer Electronics
- 8.1.4. New Energy Industry
- 8.1.5. Automation Control Industry
- 8.2. Market Analysis, Insights and Forecast - by Types
- 8.2.1. Below10 AWG
- 8.2.2. 10-20 AWG
- 8.2.3. Above20 AWG
- 8.1. Market Analysis, Insights and Forecast - by Application
- 9. Middle East & Africa Needle Terminal Analysis, Insights and Forecast, 2020-2032
- 9.1. Market Analysis, Insights and Forecast - by Application
- 9.1.1. Automotive Electronics
- 9.1.2. Home Appliances
- 9.1.3. Consumer Electronics
- 9.1.4. New Energy Industry
- 9.1.5. Automation Control Industry
- 9.2. Market Analysis, Insights and Forecast - by Types
- 9.2.1. Below10 AWG
- 9.2.2. 10-20 AWG
- 9.2.3. Above20 AWG
- 9.1. Market Analysis, Insights and Forecast - by Application
- 10. Asia Pacific Needle Terminal Analysis, Insights and Forecast, 2020-2032
- 10.1. Market Analysis, Insights and Forecast - by Application
- 10.1.1. Automotive Electronics
- 10.1.2. Home Appliances
- 10.1.3. Consumer Electronics
- 10.1.4. New Energy Industry
- 10.1.5. Automation Control Industry
- 10.2. Market Analysis, Insights and Forecast - by Types
- 10.2.1. Below10 AWG
- 10.2.2. 10-20 AWG
- 10.2.3. Above20 AWG
- 10.1. Market Analysis, Insights and Forecast - by Application
- 11. Competitive Analysis
- 11.1. Global Market Share Analysis 2025
- 11.2. Company Profiles
- 11.2.1 TE Connectivity
- 11.2.1.1. Overview
- 11.2.1.2. Products
- 11.2.1.3. SWOT Analysis
- 11.2.1.4. Recent Developments
- 11.2.1.5. Financials (Based on Availability)
- 11.2.2 Amphenol Industrial
- 11.2.2.1. Overview
- 11.2.2.2. Products
- 11.2.2.3. SWOT Analysis
- 11.2.2.4. Recent Developments
- 11.2.2.5. Financials (Based on Availability)
- 11.2.3 ABB
- 11.2.3.1. Overview
- 11.2.3.2. Products
- 11.2.3.3. SWOT Analysis
- 11.2.3.4. Recent Developments
- 11.2.3.5. Financials (Based on Availability)
- 11.2.4 Japan Solderless Terminals
- 11.2.4.1. Overview
- 11.2.4.2. Products
- 11.2.4.3. SWOT Analysis
- 11.2.4.4. Recent Developments
- 11.2.4.5. Financials (Based on Availability)
- 11.2.5 Molex
- 11.2.5.1. Overview
- 11.2.5.2. Products
- 11.2.5.3. SWOT Analysis
- 11.2.5.4. Recent Developments
- 11.2.5.5. Financials (Based on Availability)
- 11.2.6 Wurth Elektronik
- 11.2.6.1. Overview
- 11.2.6.2. Products
- 11.2.6.3. SWOT Analysis
- 11.2.6.4. Recent Developments
- 11.2.6.5. Financials (Based on Availability)
- 11.2.7 Hoffman Products
- 11.2.7.1. Overview
- 11.2.7.2. Products
- 11.2.7.3. SWOT Analysis
- 11.2.7.4. Recent Developments
- 11.2.7.5. Financials (Based on Availability)
- 11.2.8 Panduit
- 11.2.8.1. Overview
- 11.2.8.2. Products
- 11.2.8.3. SWOT Analysis
- 11.2.8.4. Recent Developments
- 11.2.8.5. Financials (Based on Availability)
- 11.2.9 Hongyun Hardware
- 11.2.9.1. Overview
- 11.2.9.2. Products
- 11.2.9.3. SWOT Analysis
- 11.2.9.4. Recent Developments
- 11.2.9.5. Financials (Based on Availability)
- 11.2.10 Lianfeng Electronics
- 11.2.10.1. Overview
- 11.2.10.2. Products
- 11.2.10.3. SWOT Analysis
- 11.2.10.4. Recent Developments
- 11.2.10.5. Financials (Based on Availability)
- 11.2.1 TE Connectivity
List of Figures
- Figure 1: Global Needle Terminal Revenue Breakdown (billion, %) by Region 2025 & 2033
- Figure 2: Global Needle Terminal Volume Breakdown (K, %) by Region 2025 & 2033
- Figure 3: North America Needle Terminal Revenue (billion), by Application 2025 & 2033
- Figure 4: North America Needle Terminal Volume (K), by Application 2025 & 2033
- Figure 5: North America Needle Terminal Revenue Share (%), by Application 2025 & 2033
- Figure 6: North America Needle Terminal Volume Share (%), by Application 2025 & 2033
- Figure 7: North America Needle Terminal Revenue (billion), by Types 2025 & 2033
- Figure 8: North America Needle Terminal Volume (K), by Types 2025 & 2033
- Figure 9: North America Needle Terminal Revenue Share (%), by Types 2025 & 2033
- Figure 10: North America Needle Terminal Volume Share (%), by Types 2025 & 2033
- Figure 11: North America Needle Terminal Revenue (billion), by Country 2025 & 2033
- Figure 12: North America Needle Terminal Volume (K), by Country 2025 & 2033
- Figure 13: North America Needle Terminal Revenue Share (%), by Country 2025 & 2033
- Figure 14: North America Needle Terminal Volume Share (%), by Country 2025 & 2033
- Figure 15: South America Needle Terminal Revenue (billion), by Application 2025 & 2033
- Figure 16: South America Needle Terminal Volume (K), by Application 2025 & 2033
- Figure 17: South America Needle Terminal Revenue Share (%), by Application 2025 & 2033
- Figure 18: South America Needle Terminal Volume Share (%), by Application 2025 & 2033
- Figure 19: South America Needle Terminal Revenue (billion), by Types 2025 & 2033
- Figure 20: South America Needle Terminal Volume (K), by Types 2025 & 2033
- Figure 21: South America Needle Terminal Revenue Share (%), by Types 2025 & 2033
- Figure 22: South America Needle Terminal Volume Share (%), by Types 2025 & 2033
- Figure 23: South America Needle Terminal Revenue (billion), by Country 2025 & 2033
- Figure 24: South America Needle Terminal Volume (K), by Country 2025 & 2033
- Figure 25: South America Needle Terminal Revenue Share (%), by Country 2025 & 2033
- Figure 26: South America Needle Terminal Volume Share (%), by Country 2025 & 2033
- Figure 27: Europe Needle Terminal Revenue (billion), by Application 2025 & 2033
- Figure 28: Europe Needle Terminal Volume (K), by Application 2025 & 2033
- Figure 29: Europe Needle Terminal Revenue Share (%), by Application 2025 & 2033
- Figure 30: Europe Needle Terminal Volume Share (%), by Application 2025 & 2033
- Figure 31: Europe Needle Terminal Revenue (billion), by Types 2025 & 2033
- Figure 32: Europe Needle Terminal Volume (K), by Types 2025 & 2033
- Figure 33: Europe Needle Terminal Revenue Share (%), by Types 2025 & 2033
- Figure 34: Europe Needle Terminal Volume Share (%), by Types 2025 & 2033
- Figure 35: Europe Needle Terminal Revenue (billion), by Country 2025 & 2033
- Figure 36: Europe Needle Terminal Volume (K), by Country 2025 & 2033
- Figure 37: Europe Needle Terminal Revenue Share (%), by Country 2025 & 2033
- Figure 38: Europe Needle Terminal Volume Share (%), by Country 2025 & 2033
- Figure 39: Middle East & Africa Needle Terminal Revenue (billion), by Application 2025 & 2033
- Figure 40: Middle East & Africa Needle Terminal Volume (K), by Application 2025 & 2033
- Figure 41: Middle East & Africa Needle Terminal Revenue Share (%), by Application 2025 & 2033
- Figure 42: Middle East & Africa Needle Terminal Volume Share (%), by Application 2025 & 2033
- Figure 43: Middle East & Africa Needle Terminal Revenue (billion), by Types 2025 & 2033
- Figure 44: Middle East & Africa Needle Terminal Volume (K), by Types 2025 & 2033
- Figure 45: Middle East & Africa Needle Terminal Revenue Share (%), by Types 2025 & 2033
- Figure 46: Middle East & Africa Needle Terminal Volume Share (%), by Types 2025 & 2033
- Figure 47: Middle East & Africa Needle Terminal Revenue (billion), by Country 2025 & 2033
- Figure 48: Middle East & Africa Needle Terminal Volume (K), by Country 2025 & 2033
- Figure 49: Middle East & Africa Needle Terminal Revenue Share (%), by Country 2025 & 2033
- Figure 50: Middle East & Africa Needle Terminal Volume Share (%), by Country 2025 & 2033
- Figure 51: Asia Pacific Needle Terminal Revenue (billion), by Application 2025 & 2033
- Figure 52: Asia Pacific Needle Terminal Volume (K), by Application 2025 & 2033
- Figure 53: Asia Pacific Needle Terminal Revenue Share (%), by Application 2025 & 2033
- Figure 54: Asia Pacific Needle Terminal Volume Share (%), by Application 2025 & 2033
- Figure 55: Asia Pacific Needle Terminal Revenue (billion), by Types 2025 & 2033
- Figure 56: Asia Pacific Needle Terminal Volume (K), by Types 2025 & 2033
- Figure 57: Asia Pacific Needle Terminal Revenue Share (%), by Types 2025 & 2033
- Figure 58: Asia Pacific Needle Terminal Volume Share (%), by Types 2025 & 2033
- Figure 59: Asia Pacific Needle Terminal Revenue (billion), by Country 2025 & 2033
- Figure 60: Asia Pacific Needle Terminal Volume (K), by Country 2025 & 2033
- Figure 61: Asia Pacific Needle Terminal Revenue Share (%), by Country 2025 & 2033
- Figure 62: Asia Pacific Needle Terminal Volume Share (%), by Country 2025 & 2033
List of Tables
- Table 1: Global Needle Terminal Revenue billion Forecast, by Application 2020 & 2033
- Table 2: Global Needle Terminal Volume K Forecast, by Application 2020 & 2033
- Table 3: Global Needle Terminal Revenue billion Forecast, by Types 2020 & 2033
- Table 4: Global Needle Terminal Volume K Forecast, by Types 2020 & 2033
- Table 5: Global Needle Terminal Revenue billion Forecast, by Region 2020 & 2033
- Table 6: Global Needle Terminal Volume K Forecast, by Region 2020 & 2033
- Table 7: Global Needle Terminal Revenue billion Forecast, by Application 2020 & 2033
- Table 8: Global Needle Terminal Volume K Forecast, by Application 2020 & 2033
- Table 9: Global Needle Terminal Revenue billion Forecast, by Types 2020 & 2033
- Table 10: Global Needle Terminal Volume K Forecast, by Types 2020 & 2033
- Table 11: Global Needle Terminal Revenue billion Forecast, by Country 2020 & 2033
- Table 12: Global Needle Terminal Volume K Forecast, by Country 2020 & 2033
- Table 13: United States Needle Terminal Revenue (billion) Forecast, by Application 2020 & 2033
- Table 14: United States Needle Terminal Volume (K) Forecast, by Application 2020 & 2033
- Table 15: Canada Needle Terminal Revenue (billion) Forecast, by Application 2020 & 2033
- Table 16: Canada Needle Terminal Volume (K) Forecast, by Application 2020 & 2033
- Table 17: Mexico Needle Terminal Revenue (billion) Forecast, by Application 2020 & 2033
- Table 18: Mexico Needle Terminal Volume (K) Forecast, by Application 2020 & 2033
- Table 19: Global Needle Terminal Revenue billion Forecast, by Application 2020 & 2033
- Table 20: Global Needle Terminal Volume K Forecast, by Application 2020 & 2033
- Table 21: Global Needle Terminal Revenue billion Forecast, by Types 2020 & 2033
- Table 22: Global Needle Terminal Volume K Forecast, by Types 2020 & 2033
- Table 23: Global Needle Terminal Revenue billion Forecast, by Country 2020 & 2033
- Table 24: Global Needle Terminal Volume K Forecast, by Country 2020 & 2033
- Table 25: Brazil Needle Terminal Revenue (billion) Forecast, by Application 2020 & 2033
- Table 26: Brazil Needle Terminal Volume (K) Forecast, by Application 2020 & 2033
- Table 27: Argentina Needle Terminal Revenue (billion) Forecast, by Application 2020 & 2033
- Table 28: Argentina Needle Terminal Volume (K) Forecast, by Application 2020 & 2033
- Table 29: Rest of South America Needle Terminal Revenue (billion) Forecast, by Application 2020 & 2033
- Table 30: Rest of South America Needle Terminal Volume (K) Forecast, by Application 2020 & 2033
- Table 31: Global Needle Terminal Revenue billion Forecast, by Application 2020 & 2033
- Table 32: Global Needle Terminal Volume K Forecast, by Application 2020 & 2033
- Table 33: Global Needle Terminal Revenue billion Forecast, by Types 2020 & 2033
- Table 34: Global Needle Terminal Volume K Forecast, by Types 2020 & 2033
- Table 35: Global Needle Terminal Revenue billion Forecast, by Country 2020 & 2033
- Table 36: Global Needle Terminal Volume K Forecast, by Country 2020 & 2033
- Table 37: United Kingdom Needle Terminal Revenue (billion) Forecast, by Application 2020 & 2033
- Table 38: United Kingdom Needle Terminal Volume (K) Forecast, by Application 2020 & 2033
- Table 39: Germany Needle Terminal Revenue (billion) Forecast, by Application 2020 & 2033
- Table 40: Germany Needle Terminal Volume (K) Forecast, by Application 2020 & 2033
- Table 41: France Needle Terminal Revenue (billion) Forecast, by Application 2020 & 2033
- Table 42: France Needle Terminal Volume (K) Forecast, by Application 2020 & 2033
- Table 43: Italy Needle Terminal Revenue (billion) Forecast, by Application 2020 & 2033
- Table 44: Italy Needle Terminal Volume (K) Forecast, by Application 2020 & 2033
- Table 45: Spain Needle Terminal Revenue (billion) Forecast, by Application 2020 & 2033
- Table 46: Spain Needle Terminal Volume (K) Forecast, by Application 2020 & 2033
- Table 47: Russia Needle Terminal Revenue (billion) Forecast, by Application 2020 & 2033
- Table 48: Russia Needle Terminal Volume (K) Forecast, by Application 2020 & 2033
- Table 49: Benelux Needle Terminal Revenue (billion) Forecast, by Application 2020 & 2033
- Table 50: Benelux Needle Terminal Volume (K) Forecast, by Application 2020 & 2033
- Table 51: Nordics Needle Terminal Revenue (billion) Forecast, by Application 2020 & 2033
- Table 52: Nordics Needle Terminal Volume (K) Forecast, by Application 2020 & 2033
- Table 53: Rest of Europe Needle Terminal Revenue (billion) Forecast, by Application 2020 & 2033
- Table 54: Rest of Europe Needle Terminal Volume (K) Forecast, by Application 2020 & 2033
- Table 55: Global Needle Terminal Revenue billion Forecast, by Application 2020 & 2033
- Table 56: Global Needle Terminal Volume K Forecast, by Application 2020 & 2033
- Table 57: Global Needle Terminal Revenue billion Forecast, by Types 2020 & 2033
- Table 58: Global Needle Terminal Volume K Forecast, by Types 2020 & 2033
- Table 59: Global Needle Terminal Revenue billion Forecast, by Country 2020 & 2033
- Table 60: Global Needle Terminal Volume K Forecast, by Country 2020 & 2033
- Table 61: Turkey Needle Terminal Revenue (billion) Forecast, by Application 2020 & 2033
- Table 62: Turkey Needle Terminal Volume (K) Forecast, by Application 2020 & 2033
- Table 63: Israel Needle Terminal Revenue (billion) Forecast, by Application 2020 & 2033
- Table 64: Israel Needle Terminal Volume (K) Forecast, by Application 2020 & 2033
- Table 65: GCC Needle Terminal Revenue (billion) Forecast, by Application 2020 & 2033
- Table 66: GCC Needle Terminal Volume (K) Forecast, by Application 2020 & 2033
- Table 67: North Africa Needle Terminal Revenue (billion) Forecast, by Application 2020 & 2033
- Table 68: North Africa Needle Terminal Volume (K) Forecast, by Application 2020 & 2033
- Table 69: South Africa Needle Terminal Revenue (billion) Forecast, by Application 2020 & 2033
- Table 70: South Africa Needle Terminal Volume (K) Forecast, by Application 2020 & 2033
- Table 71: Rest of Middle East & Africa Needle Terminal Revenue (billion) Forecast, by Application 2020 & 2033
- Table 72: Rest of Middle East & Africa Needle Terminal Volume (K) Forecast, by Application 2020 & 2033
- Table 73: Global Needle Terminal Revenue billion Forecast, by Application 2020 & 2033
- Table 74: Global Needle Terminal Volume K Forecast, by Application 2020 & 2033
- Table 75: Global Needle Terminal Revenue billion Forecast, by Types 2020 & 2033
- Table 76: Global Needle Terminal Volume K Forecast, by Types 2020 & 2033
- Table 77: Global Needle Terminal Revenue billion Forecast, by Country 2020 & 2033
- Table 78: Global Needle Terminal Volume K Forecast, by Country 2020 & 2033
- Table 79: China Needle Terminal Revenue (billion) Forecast, by Application 2020 & 2033
- Table 80: China Needle Terminal Volume (K) Forecast, by Application 2020 & 2033
- Table 81: India Needle Terminal Revenue (billion) Forecast, by Application 2020 & 2033
- Table 82: India Needle Terminal Volume (K) Forecast, by Application 2020 & 2033
- Table 83: Japan Needle Terminal Revenue (billion) Forecast, by Application 2020 & 2033
- Table 84: Japan Needle Terminal Volume (K) Forecast, by Application 2020 & 2033
- Table 85: South Korea Needle Terminal Revenue (billion) Forecast, by Application 2020 & 2033
- Table 86: South Korea Needle Terminal Volume (K) Forecast, by Application 2020 & 2033
- Table 87: ASEAN Needle Terminal Revenue (billion) Forecast, by Application 2020 & 2033
- Table 88: ASEAN Needle Terminal Volume (K) Forecast, by Application 2020 & 2033
- Table 89: Oceania Needle Terminal Revenue (billion) Forecast, by Application 2020 & 2033
- Table 90: Oceania Needle Terminal Volume (K) Forecast, by Application 2020 & 2033
- Table 91: Rest of Asia Pacific Needle Terminal Revenue (billion) Forecast, by Application 2020 & 2033
- Table 92: Rest of Asia Pacific Needle Terminal Volume (K) Forecast, by Application 2020 & 2033
Frequently Asked Questions
1. What is the projected Compound Annual Growth Rate (CAGR) of the Needle Terminal?
The projected CAGR is approximately 6.1%.
2. Which companies are prominent players in the Needle Terminal?
Key companies in the market include TE Connectivity, Amphenol Industrial, ABB, Japan Solderless Terminals, Molex, Wurth Elektronik, Hoffman Products, Panduit, Hongyun Hardware, Lianfeng Electronics.
3. What are the main segments of the Needle Terminal?
The market segments include Application, Types.
4. Can you provide details about the market size?
The market size is estimated to be USD 8.1 billion as of 2022.
5. What are some drivers contributing to market growth?
N/A
6. What are the notable trends driving market growth?
N/A
7. Are there any restraints impacting market growth?
N/A
8. Can you provide examples of recent developments in the market?
N/A
9. What pricing options are available for accessing the report?
Pricing options include single-user, multi-user, and enterprise licenses priced at USD 3350.00, USD 5025.00, and USD 6700.00 respectively.
10. Is the market size provided in terms of value or volume?
The market size is provided in terms of value, measured in billion and volume, measured in K.
11. Are there any specific market keywords associated with the report?
Yes, the market keyword associated with the report is "Needle Terminal," which aids in identifying and referencing the specific market segment covered.
12. How do I determine which pricing option suits my needs best?
The pricing options vary based on user requirements and access needs. Individual users may opt for single-user licenses, while businesses requiring broader access may choose multi-user or enterprise licenses for cost-effective access to the report.
13. Are there any additional resources or data provided in the Needle Terminal report?
While the report offers comprehensive insights, it's advisable to review the specific contents or supplementary materials provided to ascertain if additional resources or data are available.
14. How can I stay updated on further developments or reports in the Needle Terminal?
To stay informed about further developments, trends, and reports in the Needle Terminal, consider subscribing to industry newsletters, following relevant companies and organizations, or regularly checking reputable industry news sources and publications.
Methodology
Step 1 - Identification of Relevant Samples Size from Population Database


Step 2 - Approaches for Defining Global Market Size (Value, Volume* & Price*)

Note*: In applicable scenarios
Step 3 - Data Sources
Primary Research
- Web Analytics
- Survey Reports
- Research Institute
- Latest Research Reports
- Opinion Leaders
Secondary Research
- Annual Reports
- White Paper
- Latest Press Release
- Industry Association
- Paid Database
- Investor Presentations

Step 4 - Data Triangulation
Involves using different sources of information in order to increase the validity of a study
These sources are likely to be stakeholders in a program - participants, other researchers, program staff, other community members, and so on.
Then we put all data in single framework & apply various statistical tools to find out the dynamic on the market.
During the analysis stage, feedback from the stakeholder groups would be compared to determine areas of agreement as well as areas of divergence