

Key Insights
The global mobile display market is poised for significant expansion, projected to reach an estimated $55.68 billion in 2025. This growth trajectory is driven by a robust compound annual growth rate (CAGR) of 5.4% from 2019 to 2033. The insatiable consumer demand for sophisticated smartphones and an increasing array of smart mobile devices continues to fuel this expansion. Innovations in display technology, such as the widespread adoption of OLED and the continuous refinement of LCD and LED technologies, are central to this market's dynamism. These advancements not only enhance visual experiences but also contribute to improved energy efficiency and device durability, aligning with broader consumer and industry trends towards sustainability and premium product features. The market's expansion is further bolstered by the proliferation of digital cameras, gaming equipment, and media players, all of which rely heavily on high-quality, responsive displays.
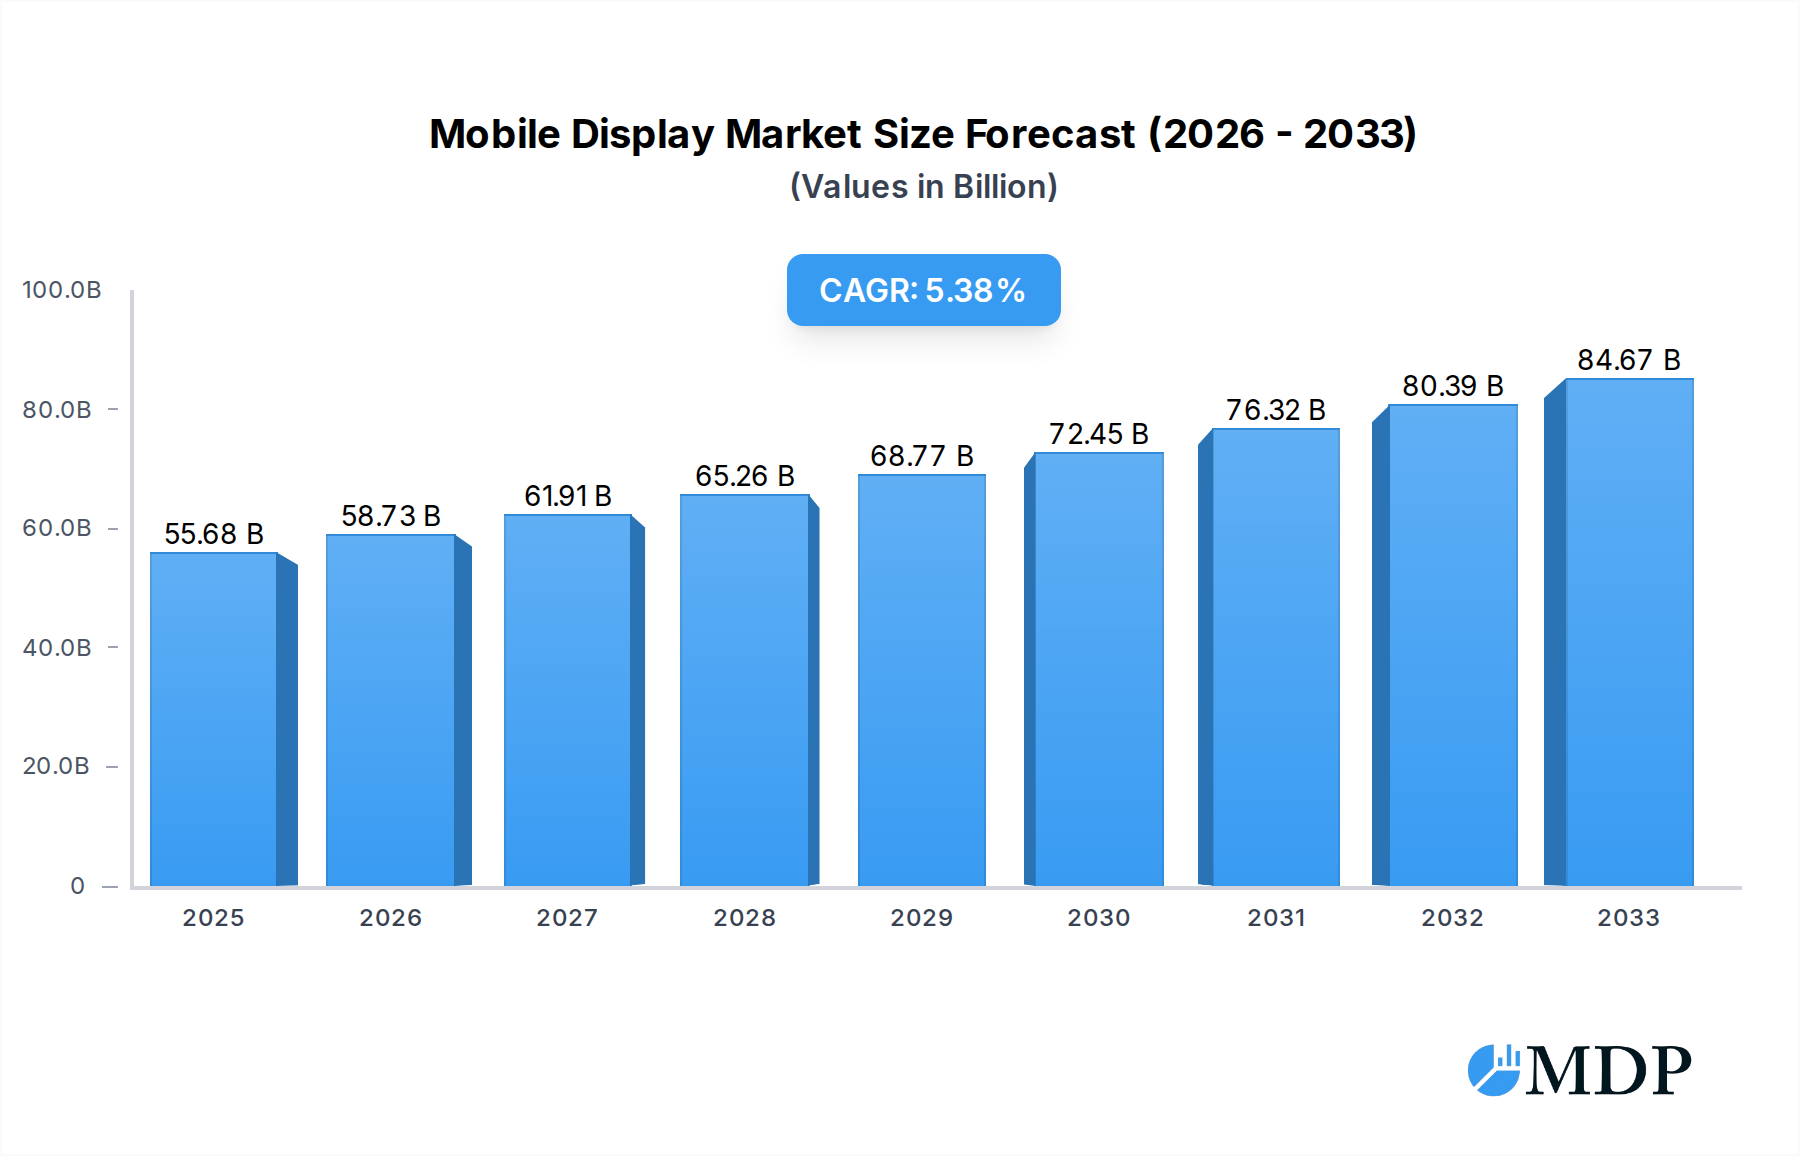
Mobile Display Market Size (In Billion)
Key market drivers include the relentless pace of technological innovation, leading to thinner, brighter, and more power-efficient displays with higher resolutions and refresh rates. The growing integration of advanced features like foldable displays and under-display cameras is creating new avenues for growth and differentiation. However, the market also faces challenges, including intense price competition among manufacturers and the high research and development costs associated with cutting-edge display technologies. Geopolitical factors and supply chain disruptions can also introduce volatility. Despite these restraints, the pervasive integration of display technology across numerous consumer electronics segments, coupled with the ongoing demand for immersive visual experiences, ensures a strong and sustained growth outlook for the mobile display market in the coming years. The forecast period from 2025 to 2033 is expected to witness consistent advancements and market penetration.

Mobile Display Company Market Share
Unveiling the Future: Mobile Display Market Analysis (2019–2033) – A Comprehensive Report
Unlock critical insights into the dynamic mobile display market with this in-depth report, essential for stakeholders including Huawei, Samsung Electronics, Lenovo, Dell, Apple, Microsoft, HP, LG Electronics, Sharp, TCL, AOC, Samsung, Sony, Toshiba, and LG Display. This comprehensive study delves into market dynamics, industry trends, leading segments, product innovations, growth drivers, challenges, emerging opportunities, and strategic outlooks, providing a roadmap for success in a market projected to reach billions in value. With a focus on actionable intelligence, this report equips you with the data and analysis needed to navigate the evolving landscape of smart mobile phone, digital camera, game equipment, media player, and other applications, and the diverse display types including LCD displays, OLED displays, and LED displays.
Mobile Display Market Dynamics & Concentration
The global mobile display market exhibits a moderate to high concentration, with key players like Samsung Display, LG Display, and BOE Technology dominating a significant portion of the market share. In 2025, the market share of the top three players is estimated to be approximately 70 billion. Innovation remains a primary driver, fueled by relentless R&D investments from industry giants such as Apple, Samsung Electronics, and Huawei, pushing the boundaries of display technology with advancements in resolution, refresh rates, and power efficiency. Regulatory frameworks, particularly concerning environmental standards and display material sourcing, are becoming increasingly stringent, influencing manufacturing processes and material choices. The threat of product substitutes, while present from emerging display technologies, is currently mitigated by the established performance and cost-effectiveness of LCD and OLED displays in mobile applications. End-user trends are heavily influenced by the demand for immersive viewing experiences, larger screen sizes, and enhanced durability, directly impacting product development cycles. Merger and acquisition (M&A) activities are a significant indicator of market consolidation, with an estimated 5 major M&A deals in the historical period (2019-2024) valued at over 10 billion. The forecast period (2025-2033) is anticipated to see continued strategic acquisitions aimed at securing intellectual property, expanding market reach, and vertical integration.
Mobile Display Industry Trends & Analysis
The mobile display industry is poised for significant expansion, driven by a confluence of technological advancements, evolving consumer preferences, and robust market demand across diverse applications. The Compound Annual Growth Rate (CAGR) for the mobile display market is projected to be an impressive 8.5% from the base year of 2025 through to 2033. This growth is underpinned by the ubiquitous adoption of smartphones, which continue to be the primary demand driver, with an estimated market penetration of 95% globally by 2025. Beyond smartphones, the burgeoning demand for high-quality displays in wearable technology, augmented reality (AR) and virtual reality (VR) devices, and advanced automotive infotainment systems presents substantial growth opportunities. Technological disruptions are a constant feature, with OLED displays steadily gaining traction due to their superior color accuracy, contrast ratios, and flexibility, challenging the dominance of traditional LCD displays. The development of micro-LED technology also shows immense promise for future iterations of high-performance mobile displays. Consumer preferences are increasingly skewed towards larger, more immersive, and power-efficient displays. This has led manufacturers like Samsung Electronics and Apple to invest heavily in foldable and rollable display technologies, catering to the demand for versatile and portable devices. The competitive landscape is characterized by intense innovation and price competition, with companies like LG Display, TCL, and Sharp vying for market share through continuous product improvement and strategic partnerships. The increasing complexity of display manufacturing, particularly for advanced OLED and micro-LED technologies, necessitates significant capital investment and specialized expertise, creating a barrier to entry for new players. The study period, 2019–2033, will witness a significant shift towards more sustainable display manufacturing practices, driven by both consumer awareness and regulatory mandates, influencing material sourcing and energy consumption throughout the production lifecycle. The estimated market size in 2025 is projected to be over 150 billion.
Leading Markets & Segments in Mobile Display
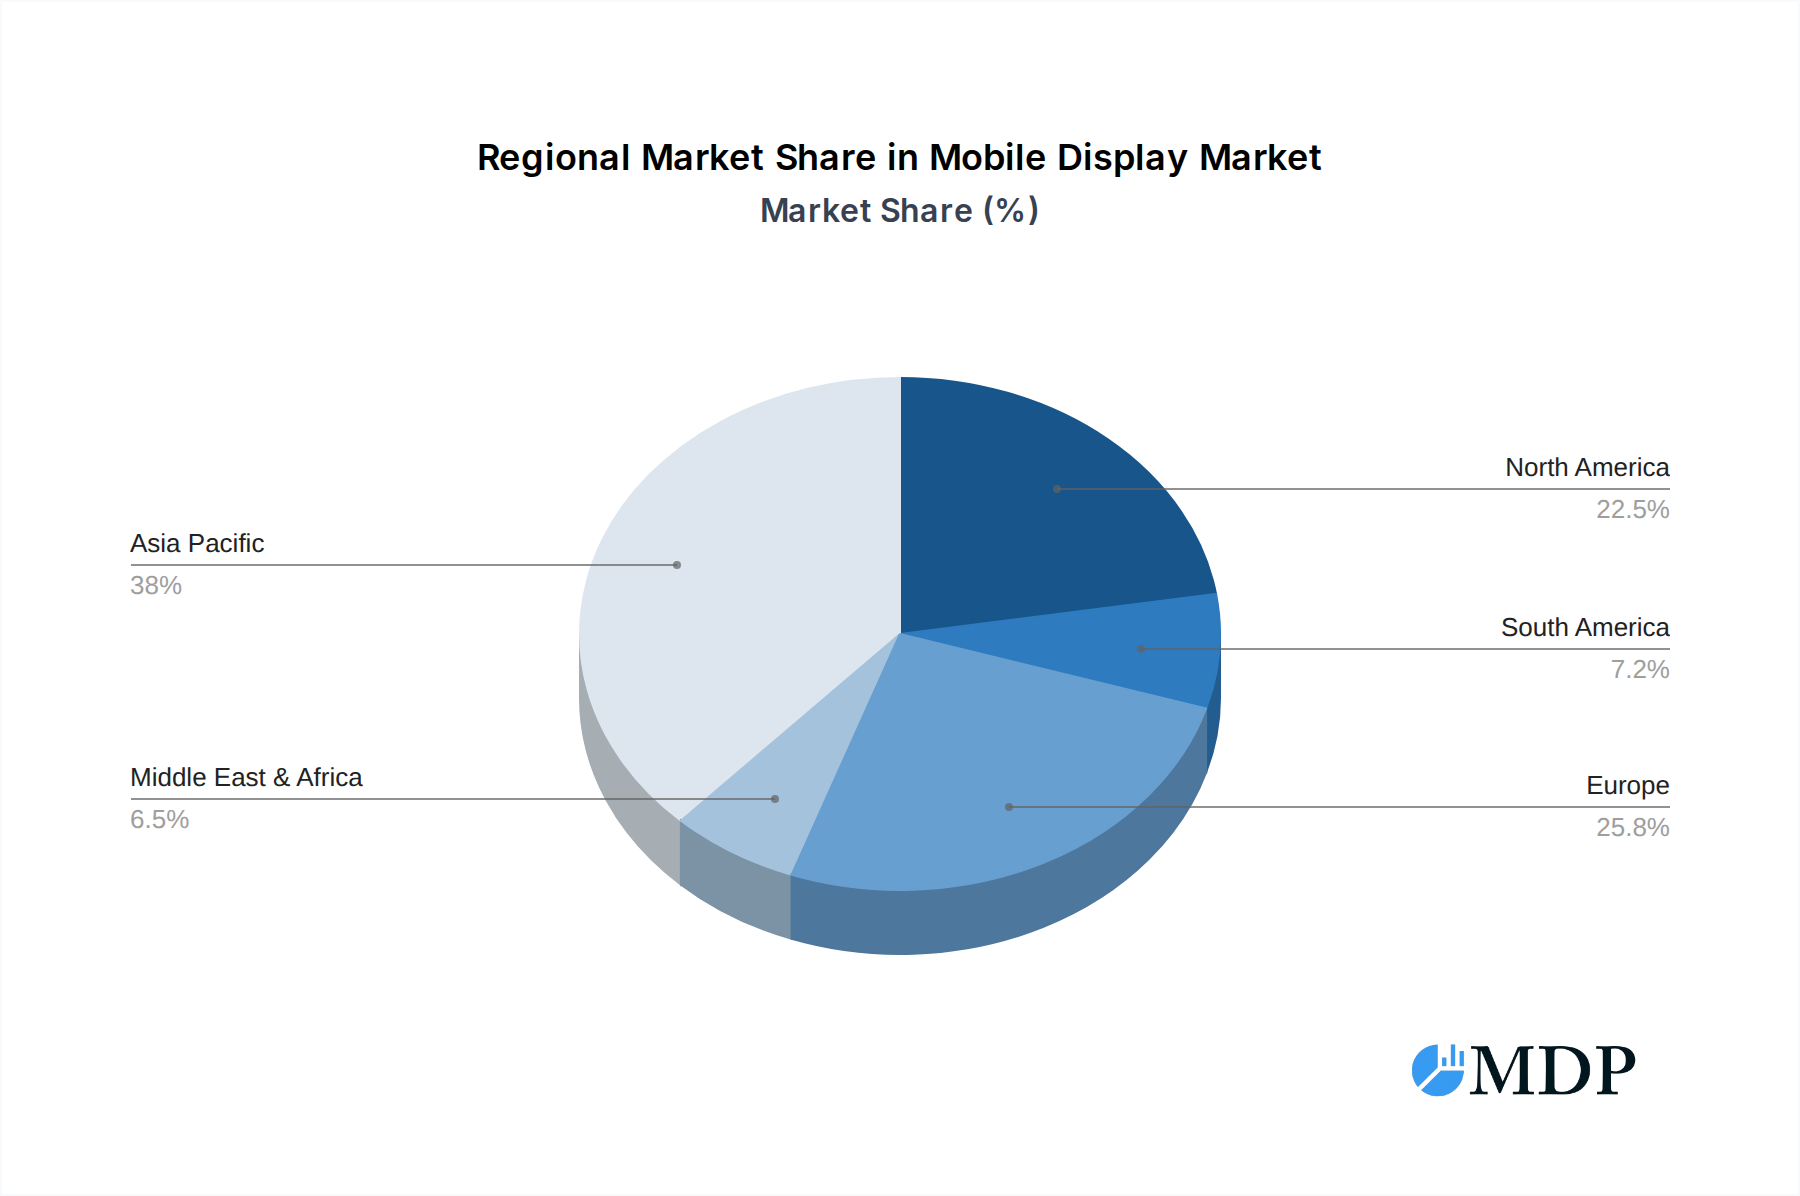
The Smart Mobile Phone segment is unequivocally the dominant force in the mobile display market, accounting for an estimated 75 billion in revenue by 2025. This dominance is fueled by the sheer volume of smartphone production and the continuous consumer demand for upgraded devices with superior display capabilities. The projected market penetration of smartphones is expected to reach 95% globally by 2025, solidifying its position as the primary application. Within display types, OLED displays are experiencing rapid growth, projected to capture 45 billion in market value by 2025, driven by their superior visual performance and energy efficiency, which are highly sought after in premium smartphones. LCD displays, while still a significant segment, are expected to hold approximately 55 billion in market value by 2025, particularly in mid-range and budget smartphone segments. The Asia-Pacific region, spearheaded by China and South Korea, stands as the leading market for mobile displays, driven by the presence of major smartphone manufacturers like Huawei, Samsung Electronics, and TCL, and a vast consumer base. Economic policies in these regions have consistently supported the growth of the electronics manufacturing sector, creating a robust supply chain and fostering innovation. Infrastructure development, including advanced manufacturing facilities and logistics networks, further bolsters their market leadership.
Dominant Application: Smart Mobile Phone:
- Key Drivers: Ubiquitous global adoption, demand for higher resolutions and refresh rates, integration of advanced features like foldable displays, and continuous device upgrade cycles.
- Market Penetration: Expected to reach 95% globally by 2025.
- Estimated Market Value (2025): 75 billion.
Dominant Display Type (Growth Trajectory): OLED Displays:
- Key Drivers: Superior color reproduction, infinite contrast ratios, power efficiency, flexibility for innovative form factors (foldable, rollable), and premium user experience.
- Estimated Market Value (2025): 45 billion.
Leading Region: Asia-Pacific:
- Key Drivers: Presence of major manufacturers (Samsung Electronics, LG Display, Huawei, TCL, Sharp), massive consumer base, government support for electronics industry, advanced manufacturing capabilities, and strong R&D investments.
- Dominance Analysis: The concentration of manufacturing powerhouses in countries like South Korea and China, coupled with their substantial domestic markets, makes the Asia-Pacific region the epicenter of mobile display production and consumption.
Mobile Display Product Developments
Product innovation in the mobile display market is fiercely competitive, with companies like Samsung Display, LG Display, and BOE at the forefront of technological advancements. Key developments include the widespread adoption of high refresh rate OLED panels (120Hz and above) for smoother visuals in smartphones, and the miniaturization of micro-LED technology for potential use in future compact devices. Foldable and rollable displays, pioneered by companies like Samsung Electronics and LG Electronics, are moving from niche to mainstream, offering enhanced portability and versatility. These innovations provide significant competitive advantages by enabling unique form factors and delivering unparalleled viewing experiences, differentiating products in a crowded market. The focus remains on enhancing color accuracy, brightness, energy efficiency, and durability, while also exploring sustainable material sourcing and manufacturing processes.
Key Drivers of Mobile Display Growth
The mobile display market's growth is propelled by several intertwined factors. Technologically, advancements in OLED and micro-LED technologies are enabling more immersive and power-efficient displays, driving upgrades and new device adoption. The increasing demand for high-resolution content and gaming on mobile devices necessitates superior display performance. Economically, the rising disposable incomes in emerging economies are fueling consumer spending on mobile devices, particularly premium smartphones equipped with advanced displays. Regulatory bodies are also playing a role, with evolving environmental standards encouraging the development of more sustainable display manufacturing processes. Furthermore, the expanding use of mobile devices in sectors like automotive and healthcare is opening up new avenues for display integration.
Challenges in the Mobile Display Market
Despite robust growth, the mobile display market faces significant challenges. Supply chain disruptions, particularly for critical raw materials and advanced components, can impact production volumes and increase costs. The intense price competition among manufacturers, especially in the LCD segment, squeezes profit margins. Evolving regulatory landscapes, including stringent environmental protection laws and trade restrictions, can create compliance hurdles and necessitate costly process adjustments. Furthermore, the rapid pace of technological innovation requires substantial R&D investment, posing a financial strain, particularly for smaller players. The significant capital expenditure required for advanced manufacturing facilities, such as those for micro-LED production, also presents a substantial barrier to entry.
Emerging Opportunities in Mobile Display
Emerging opportunities in the mobile display market are largely driven by technological breakthroughs and strategic market expansion. The continued development and commercialization of micro-LED technology present a significant long-term opportunity, promising unparalleled brightness, contrast, and lifespan for future mobile displays. The growing market for foldable and rollable devices is creating demand for flexible and durable display solutions. Strategic partnerships between display manufacturers and device makers, like those between LG Display and Apple, or Samsung Display and Samsung Electronics, are crucial for co-development and market penetration. Expansion into emerging markets and the development of specialized displays for burgeoning sectors like in-car infotainment and augmented reality devices represent further catalysts for sustained growth.
Leading Players in the Mobile Display Sector
- Huawei
- Samsung Electronics
- Lenovo
- Dell
- Apple
- Microsoft
- HP
- LG Electronics
- Sharp
- TCL
- AOC
- Samsung
- Sony
- Toshiba
- LG Display
Key Milestones in Mobile Display Industry
- 2019: Introduction of 5G-enabled smartphones with advanced HDR display capabilities, boosting demand for higher-quality visual experiences.
- 2020: Samsung Display launches the first mass-produced foldable smartphone display, marking a significant shift in device form factors.
- 2021: Significant advancements in OLED pixel density and energy efficiency, leading to brighter and more power-conscious mobile devices.
- 2022: Increased focus on sustainable manufacturing practices and the exploration of recycled materials in display production.
- 2023: Growing interest and initial R&D in micro-LED technology for future high-performance mobile applications.
- 2024: Emergence of rollable display prototypes, hinting at the next wave of flexible display innovation.
Strategic Outlook for Mobile Display Market
The strategic outlook for the mobile display market is exceptionally positive, driven by continuous innovation and expanding application frontiers. The forecast period (2025–2033) is set to witness the maturation of foldable and rollable display technologies, leading to wider adoption across various consumer electronics. The ongoing advancement of micro-LED technology promises to revolutionize display performance, offering unprecedented visual fidelity and durability. Strategic investments in R&D for next-generation display materials and manufacturing processes will be crucial for maintaining a competitive edge. Furthermore, the increasing integration of displays in emerging technologies like augmented reality and advanced driver-assistance systems (ADAS) will unlock significant new market potential, ensuring sustained growth and market expansion for leading players.
Mobile Display Segmentation
-
1. Application
- 1.1. Smart Mobile Phone
- 1.2. Digital Camera
- 1.3. Game Equipment
- 1.4. Media Player
- 1.5. Other
-
2. Type
- 2.1. LCD Displays
- 2.2. OLED Displays
- 2.3. LED Displays
Mobile Display Segmentation By Geography
-
1. North America
- 1.1. United States
- 1.2. Canada
- 1.3. Mexico
-
2. South America
- 2.1. Brazil
- 2.2. Argentina
- 2.3. Rest of South America
-
3. Europe
- 3.1. United Kingdom
- 3.2. Germany
- 3.3. France
- 3.4. Italy
- 3.5. Spain
- 3.6. Russia
- 3.7. Benelux
- 3.8. Nordics
- 3.9. Rest of Europe
-
4. Middle East & Africa
- 4.1. Turkey
- 4.2. Israel
- 4.3. GCC
- 4.4. North Africa
- 4.5. South Africa
- 4.6. Rest of Middle East & Africa
-
5. Asia Pacific
- 5.1. China
- 5.2. India
- 5.3. Japan
- 5.4. South Korea
- 5.5. ASEAN
- 5.6. Oceania
- 5.7. Rest of Asia Pacific
Mobile Display Regional Market Share
Geographic Coverage of Mobile Display
Mobile Display REPORT HIGHLIGHTS
| Aspects | Details |
|---|---|
| Study Period | 2020-2034 |
| Base Year | 2025 |
| Estimated Year | 2026 |
| Forecast Period | 2026-2034 |
| Historical Period | 2020-2025 |
| Growth Rate | CAGR of 8.1% from 2020-2034 |
| Segmentation |
|
Table of Contents
- 1. Introduction
- 1.1. Research Scope
- 1.2. Market Segmentation
- 1.3. Research Methodology
- 1.4. Definitions and Assumptions
- 2. Executive Summary
- 2.1. Introduction
- 3. Market Dynamics
- 3.1. Introduction
- 3.2. Market Drivers
- 3.3. Market Restrains
- 3.4. Market Trends
- 4. Market Factor Analysis
- 4.1. Porters Five Forces
- 4.2. Supply/Value Chain
- 4.3. PESTEL analysis
- 4.4. Market Entropy
- 4.5. Patent/Trademark Analysis
- 5. Global Mobile Display Analysis, Insights and Forecast, 2020-2032
- 5.1. Market Analysis, Insights and Forecast - by Application
- 5.1.1. Smart Mobile Phone
- 5.1.2. Digital Camera
- 5.1.3. Game Equipment
- 5.1.4. Media Player
- 5.1.5. Other
- 5.2. Market Analysis, Insights and Forecast - by Type
- 5.2.1. LCD Displays
- 5.2.2. OLED Displays
- 5.2.3. LED Displays
- 5.3. Market Analysis, Insights and Forecast - by Region
- 5.3.1. North America
- 5.3.2. South America
- 5.3.3. Europe
- 5.3.4. Middle East & Africa
- 5.3.5. Asia Pacific
- 5.1. Market Analysis, Insights and Forecast - by Application
- 6. North America Mobile Display Analysis, Insights and Forecast, 2020-2032
- 6.1. Market Analysis, Insights and Forecast - by Application
- 6.1.1. Smart Mobile Phone
- 6.1.2. Digital Camera
- 6.1.3. Game Equipment
- 6.1.4. Media Player
- 6.1.5. Other
- 6.2. Market Analysis, Insights and Forecast - by Type
- 6.2.1. LCD Displays
- 6.2.2. OLED Displays
- 6.2.3. LED Displays
- 6.1. Market Analysis, Insights and Forecast - by Application
- 7. South America Mobile Display Analysis, Insights and Forecast, 2020-2032
- 7.1. Market Analysis, Insights and Forecast - by Application
- 7.1.1. Smart Mobile Phone
- 7.1.2. Digital Camera
- 7.1.3. Game Equipment
- 7.1.4. Media Player
- 7.1.5. Other
- 7.2. Market Analysis, Insights and Forecast - by Type
- 7.2.1. LCD Displays
- 7.2.2. OLED Displays
- 7.2.3. LED Displays
- 7.1. Market Analysis, Insights and Forecast - by Application
- 8. Europe Mobile Display Analysis, Insights and Forecast, 2020-2032
- 8.1. Market Analysis, Insights and Forecast - by Application
- 8.1.1. Smart Mobile Phone
- 8.1.2. Digital Camera
- 8.1.3. Game Equipment
- 8.1.4. Media Player
- 8.1.5. Other
- 8.2. Market Analysis, Insights and Forecast - by Type
- 8.2.1. LCD Displays
- 8.2.2. OLED Displays
- 8.2.3. LED Displays
- 8.1. Market Analysis, Insights and Forecast - by Application
- 9. Middle East & Africa Mobile Display Analysis, Insights and Forecast, 2020-2032
- 9.1. Market Analysis, Insights and Forecast - by Application
- 9.1.1. Smart Mobile Phone
- 9.1.2. Digital Camera
- 9.1.3. Game Equipment
- 9.1.4. Media Player
- 9.1.5. Other
- 9.2. Market Analysis, Insights and Forecast - by Type
- 9.2.1. LCD Displays
- 9.2.2. OLED Displays
- 9.2.3. LED Displays
- 9.1. Market Analysis, Insights and Forecast - by Application
- 10. Asia Pacific Mobile Display Analysis, Insights and Forecast, 2020-2032
- 10.1. Market Analysis, Insights and Forecast - by Application
- 10.1.1. Smart Mobile Phone
- 10.1.2. Digital Camera
- 10.1.3. Game Equipment
- 10.1.4. Media Player
- 10.1.5. Other
- 10.2. Market Analysis, Insights and Forecast - by Type
- 10.2.1. LCD Displays
- 10.2.2. OLED Displays
- 10.2.3. LED Displays
- 10.1. Market Analysis, Insights and Forecast - by Application
- 11. Competitive Analysis
- 11.1. Global Market Share Analysis 2025
- 11.2. Company Profiles
- 11.2.1 Huawei
- 11.2.1.1. Overview
- 11.2.1.2. Products
- 11.2.1.3. SWOT Analysis
- 11.2.1.4. Recent Developments
- 11.2.1.5. Financials (Based on Availability)
- 11.2.2 Samsung Electronics
- 11.2.2.1. Overview
- 11.2.2.2. Products
- 11.2.2.3. SWOT Analysis
- 11.2.2.4. Recent Developments
- 11.2.2.5. Financials (Based on Availability)
- 11.2.3 Lenovo
- 11.2.3.1. Overview
- 11.2.3.2. Products
- 11.2.3.3. SWOT Analysis
- 11.2.3.4. Recent Developments
- 11.2.3.5. Financials (Based on Availability)
- 11.2.4 Dell
- 11.2.4.1. Overview
- 11.2.4.2. Products
- 11.2.4.3. SWOT Analysis
- 11.2.4.4. Recent Developments
- 11.2.4.5. Financials (Based on Availability)
- 11.2.5 Apple
- 11.2.5.1. Overview
- 11.2.5.2. Products
- 11.2.5.3. SWOT Analysis
- 11.2.5.4. Recent Developments
- 11.2.5.5. Financials (Based on Availability)
- 11.2.6 Microsoft
- 11.2.6.1. Overview
- 11.2.6.2. Products
- 11.2.6.3. SWOT Analysis
- 11.2.6.4. Recent Developments
- 11.2.6.5. Financials (Based on Availability)
- 11.2.7 HP
- 11.2.7.1. Overview
- 11.2.7.2. Products
- 11.2.7.3. SWOT Analysis
- 11.2.7.4. Recent Developments
- 11.2.7.5. Financials (Based on Availability)
- 11.2.8 LG Electronics
- 11.2.8.1. Overview
- 11.2.8.2. Products
- 11.2.8.3. SWOT Analysis
- 11.2.8.4. Recent Developments
- 11.2.8.5. Financials (Based on Availability)
- 11.2.9 Sharp
- 11.2.9.1. Overview
- 11.2.9.2. Products
- 11.2.9.3. SWOT Analysis
- 11.2.9.4. Recent Developments
- 11.2.9.5. Financials (Based on Availability)
- 11.2.10 TCL
- 11.2.10.1. Overview
- 11.2.10.2. Products
- 11.2.10.3. SWOT Analysis
- 11.2.10.4. Recent Developments
- 11.2.10.5. Financials (Based on Availability)
- 11.2.11 AOC
- 11.2.11.1. Overview
- 11.2.11.2. Products
- 11.2.11.3. SWOT Analysis
- 11.2.11.4. Recent Developments
- 11.2.11.5. Financials (Based on Availability)
- 11.2.12 Samsung
- 11.2.12.1. Overview
- 11.2.12.2. Products
- 11.2.12.3. SWOT Analysis
- 11.2.12.4. Recent Developments
- 11.2.12.5. Financials (Based on Availability)
- 11.2.13 Sony
- 11.2.13.1. Overview
- 11.2.13.2. Products
- 11.2.13.3. SWOT Analysis
- 11.2.13.4. Recent Developments
- 11.2.13.5. Financials (Based on Availability)
- 11.2.14 Toshiba
- 11.2.14.1. Overview
- 11.2.14.2. Products
- 11.2.14.3. SWOT Analysis
- 11.2.14.4. Recent Developments
- 11.2.14.5. Financials (Based on Availability)
- 11.2.15 LG Display
- 11.2.15.1. Overview
- 11.2.15.2. Products
- 11.2.15.3. SWOT Analysis
- 11.2.15.4. Recent Developments
- 11.2.15.5. Financials (Based on Availability)
- 11.2.1 Huawei
List of Figures
- Figure 1: Global Mobile Display Revenue Breakdown (undefined, %) by Region 2025 & 2033
- Figure 2: North America Mobile Display Revenue (undefined), by Application 2025 & 2033
- Figure 3: North America Mobile Display Revenue Share (%), by Application 2025 & 2033
- Figure 4: North America Mobile Display Revenue (undefined), by Type 2025 & 2033
- Figure 5: North America Mobile Display Revenue Share (%), by Type 2025 & 2033
- Figure 6: North America Mobile Display Revenue (undefined), by Country 2025 & 2033
- Figure 7: North America Mobile Display Revenue Share (%), by Country 2025 & 2033
- Figure 8: South America Mobile Display Revenue (undefined), by Application 2025 & 2033
- Figure 9: South America Mobile Display Revenue Share (%), by Application 2025 & 2033
- Figure 10: South America Mobile Display Revenue (undefined), by Type 2025 & 2033
- Figure 11: South America Mobile Display Revenue Share (%), by Type 2025 & 2033
- Figure 12: South America Mobile Display Revenue (undefined), by Country 2025 & 2033
- Figure 13: South America Mobile Display Revenue Share (%), by Country 2025 & 2033
- Figure 14: Europe Mobile Display Revenue (undefined), by Application 2025 & 2033
- Figure 15: Europe Mobile Display Revenue Share (%), by Application 2025 & 2033
- Figure 16: Europe Mobile Display Revenue (undefined), by Type 2025 & 2033
- Figure 17: Europe Mobile Display Revenue Share (%), by Type 2025 & 2033
- Figure 18: Europe Mobile Display Revenue (undefined), by Country 2025 & 2033
- Figure 19: Europe Mobile Display Revenue Share (%), by Country 2025 & 2033
- Figure 20: Middle East & Africa Mobile Display Revenue (undefined), by Application 2025 & 2033
- Figure 21: Middle East & Africa Mobile Display Revenue Share (%), by Application 2025 & 2033
- Figure 22: Middle East & Africa Mobile Display Revenue (undefined), by Type 2025 & 2033
- Figure 23: Middle East & Africa Mobile Display Revenue Share (%), by Type 2025 & 2033
- Figure 24: Middle East & Africa Mobile Display Revenue (undefined), by Country 2025 & 2033
- Figure 25: Middle East & Africa Mobile Display Revenue Share (%), by Country 2025 & 2033
- Figure 26: Asia Pacific Mobile Display Revenue (undefined), by Application 2025 & 2033
- Figure 27: Asia Pacific Mobile Display Revenue Share (%), by Application 2025 & 2033
- Figure 28: Asia Pacific Mobile Display Revenue (undefined), by Type 2025 & 2033
- Figure 29: Asia Pacific Mobile Display Revenue Share (%), by Type 2025 & 2033
- Figure 30: Asia Pacific Mobile Display Revenue (undefined), by Country 2025 & 2033
- Figure 31: Asia Pacific Mobile Display Revenue Share (%), by Country 2025 & 2033
List of Tables
- Table 1: Global Mobile Display Revenue undefined Forecast, by Application 2020 & 2033
- Table 2: Global Mobile Display Revenue undefined Forecast, by Type 2020 & 2033
- Table 3: Global Mobile Display Revenue undefined Forecast, by Region 2020 & 2033
- Table 4: Global Mobile Display Revenue undefined Forecast, by Application 2020 & 2033
- Table 5: Global Mobile Display Revenue undefined Forecast, by Type 2020 & 2033
- Table 6: Global Mobile Display Revenue undefined Forecast, by Country 2020 & 2033
- Table 7: United States Mobile Display Revenue (undefined) Forecast, by Application 2020 & 2033
- Table 8: Canada Mobile Display Revenue (undefined) Forecast, by Application 2020 & 2033
- Table 9: Mexico Mobile Display Revenue (undefined) Forecast, by Application 2020 & 2033
- Table 10: Global Mobile Display Revenue undefined Forecast, by Application 2020 & 2033
- Table 11: Global Mobile Display Revenue undefined Forecast, by Type 2020 & 2033
- Table 12: Global Mobile Display Revenue undefined Forecast, by Country 2020 & 2033
- Table 13: Brazil Mobile Display Revenue (undefined) Forecast, by Application 2020 & 2033
- Table 14: Argentina Mobile Display Revenue (undefined) Forecast, by Application 2020 & 2033
- Table 15: Rest of South America Mobile Display Revenue (undefined) Forecast, by Application 2020 & 2033
- Table 16: Global Mobile Display Revenue undefined Forecast, by Application 2020 & 2033
- Table 17: Global Mobile Display Revenue undefined Forecast, by Type 2020 & 2033
- Table 18: Global Mobile Display Revenue undefined Forecast, by Country 2020 & 2033
- Table 19: United Kingdom Mobile Display Revenue (undefined) Forecast, by Application 2020 & 2033
- Table 20: Germany Mobile Display Revenue (undefined) Forecast, by Application 2020 & 2033
- Table 21: France Mobile Display Revenue (undefined) Forecast, by Application 2020 & 2033
- Table 22: Italy Mobile Display Revenue (undefined) Forecast, by Application 2020 & 2033
- Table 23: Spain Mobile Display Revenue (undefined) Forecast, by Application 2020 & 2033
- Table 24: Russia Mobile Display Revenue (undefined) Forecast, by Application 2020 & 2033
- Table 25: Benelux Mobile Display Revenue (undefined) Forecast, by Application 2020 & 2033
- Table 26: Nordics Mobile Display Revenue (undefined) Forecast, by Application 2020 & 2033
- Table 27: Rest of Europe Mobile Display Revenue (undefined) Forecast, by Application 2020 & 2033
- Table 28: Global Mobile Display Revenue undefined Forecast, by Application 2020 & 2033
- Table 29: Global Mobile Display Revenue undefined Forecast, by Type 2020 & 2033
- Table 30: Global Mobile Display Revenue undefined Forecast, by Country 2020 & 2033
- Table 31: Turkey Mobile Display Revenue (undefined) Forecast, by Application 2020 & 2033
- Table 32: Israel Mobile Display Revenue (undefined) Forecast, by Application 2020 & 2033
- Table 33: GCC Mobile Display Revenue (undefined) Forecast, by Application 2020 & 2033
- Table 34: North Africa Mobile Display Revenue (undefined) Forecast, by Application 2020 & 2033
- Table 35: South Africa Mobile Display Revenue (undefined) Forecast, by Application 2020 & 2033
- Table 36: Rest of Middle East & Africa Mobile Display Revenue (undefined) Forecast, by Application 2020 & 2033
- Table 37: Global Mobile Display Revenue undefined Forecast, by Application 2020 & 2033
- Table 38: Global Mobile Display Revenue undefined Forecast, by Type 2020 & 2033
- Table 39: Global Mobile Display Revenue undefined Forecast, by Country 2020 & 2033
- Table 40: China Mobile Display Revenue (undefined) Forecast, by Application 2020 & 2033
- Table 41: India Mobile Display Revenue (undefined) Forecast, by Application 2020 & 2033
- Table 42: Japan Mobile Display Revenue (undefined) Forecast, by Application 2020 & 2033
- Table 43: South Korea Mobile Display Revenue (undefined) Forecast, by Application 2020 & 2033
- Table 44: ASEAN Mobile Display Revenue (undefined) Forecast, by Application 2020 & 2033
- Table 45: Oceania Mobile Display Revenue (undefined) Forecast, by Application 2020 & 2033
- Table 46: Rest of Asia Pacific Mobile Display Revenue (undefined) Forecast, by Application 2020 & 2033
Frequently Asked Questions
1. What is the projected Compound Annual Growth Rate (CAGR) of the Mobile Display?
The projected CAGR is approximately 8.1%.
2. Which companies are prominent players in the Mobile Display?
Key companies in the market include Huawei, Samsung Electronics, Lenovo, Dell, Apple, Microsoft, HP, LG Electronics, Sharp, TCL, AOC, Samsung, Sony, Toshiba, LG Display.
3. What are the main segments of the Mobile Display?
The market segments include Application, Type.
4. Can you provide details about the market size?
The market size is estimated to be USD XXX N/A as of 2022.
5. What are some drivers contributing to market growth?
N/A
6. What are the notable trends driving market growth?
N/A
7. Are there any restraints impacting market growth?
N/A
8. Can you provide examples of recent developments in the market?
N/A
9. What pricing options are available for accessing the report?
Pricing options include single-user, multi-user, and enterprise licenses priced at USD 2900.00, USD 4350.00, and USD 5800.00 respectively.
10. Is the market size provided in terms of value or volume?
The market size is provided in terms of value, measured in N/A.
11. Are there any specific market keywords associated with the report?
Yes, the market keyword associated with the report is "Mobile Display," which aids in identifying and referencing the specific market segment covered.
12. How do I determine which pricing option suits my needs best?
The pricing options vary based on user requirements and access needs. Individual users may opt for single-user licenses, while businesses requiring broader access may choose multi-user or enterprise licenses for cost-effective access to the report.
13. Are there any additional resources or data provided in the Mobile Display report?
While the report offers comprehensive insights, it's advisable to review the specific contents or supplementary materials provided to ascertain if additional resources or data are available.
14. How can I stay updated on further developments or reports in the Mobile Display?
To stay informed about further developments, trends, and reports in the Mobile Display, consider subscribing to industry newsletters, following relevant companies and organizations, or regularly checking reputable industry news sources and publications.
Methodology
Step 1 - Identification of Relevant Samples Size from Population Database


Step 2 - Approaches for Defining Global Market Size (Value, Volume* & Price*)

Note*: In applicable scenarios
Step 3 - Data Sources
Primary Research
- Web Analytics
- Survey Reports
- Research Institute
- Latest Research Reports
- Opinion Leaders
Secondary Research
- Annual Reports
- White Paper
- Latest Press Release
- Industry Association
- Paid Database
- Investor Presentations

Step 4 - Data Triangulation
Involves using different sources of information in order to increase the validity of a study
These sources are likely to be stakeholders in a program - participants, other researchers, program staff, other community members, and so on.
Then we put all data in single framework & apply various statistical tools to find out the dynamic on the market.
During the analysis stage, feedback from the stakeholder groups would be compared to determine areas of agreement as well as areas of divergence