

Key Insights
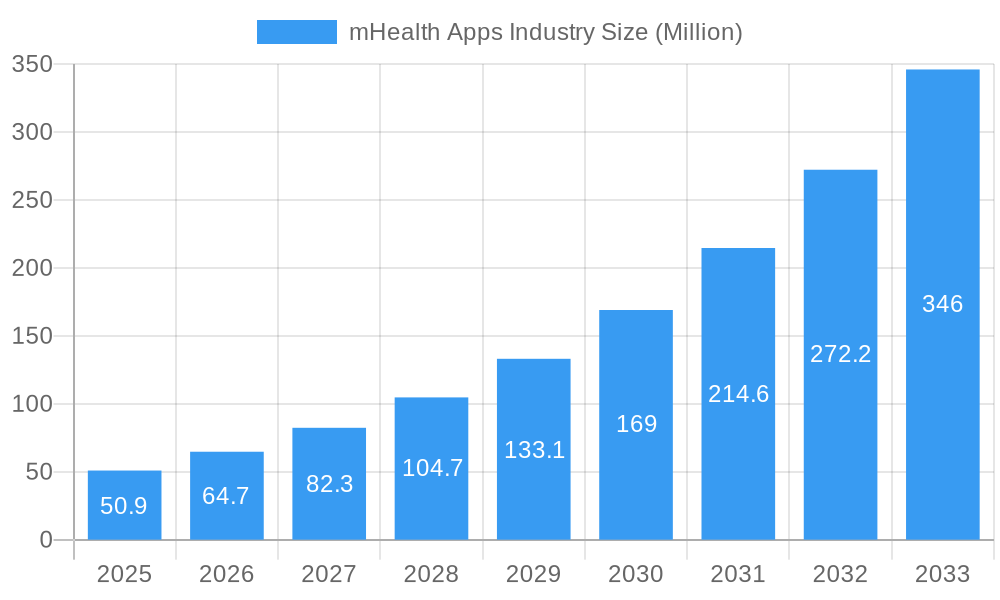
The mHealth app market, valued at $50.9 million in 2025, is experiencing robust growth, projected to expand at a Compound Annual Growth Rate (CAGR) of 27.30% from 2025 to 2033. This explosive growth is driven by several key factors. The increasing prevalence of chronic diseases necessitates remote patient monitoring, fueling demand for applications offering diagnostic services, treatment support, and teleconsultation. Furthermore, the rising adoption of smartphones and improved internet accessibility, particularly in developing economies, is significantly broadening the market reach. Technological advancements, such as the development of sophisticated wearable sensors and improved data analytics capabilities, are further enhancing the efficacy and appeal of mHealth apps. The integration of artificial intelligence (AI) and machine learning (ML) in these apps promises personalized healthcare experiences and improved diagnostic accuracy, further bolstering market expansion. Major stakeholders, including mobile operators, healthcare providers, and application/content developers, are actively contributing to this growth through strategic partnerships and investments.
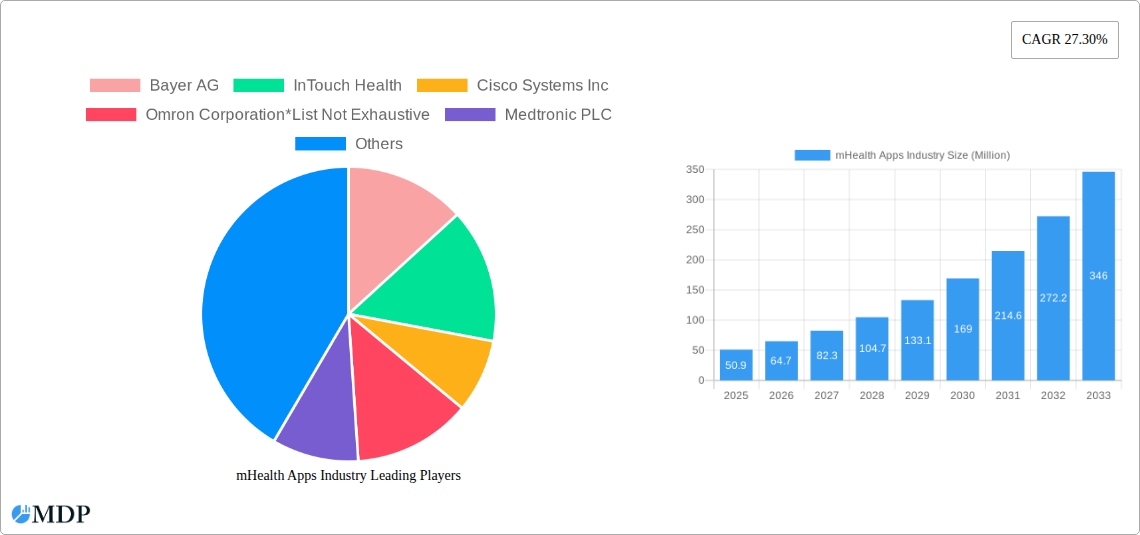
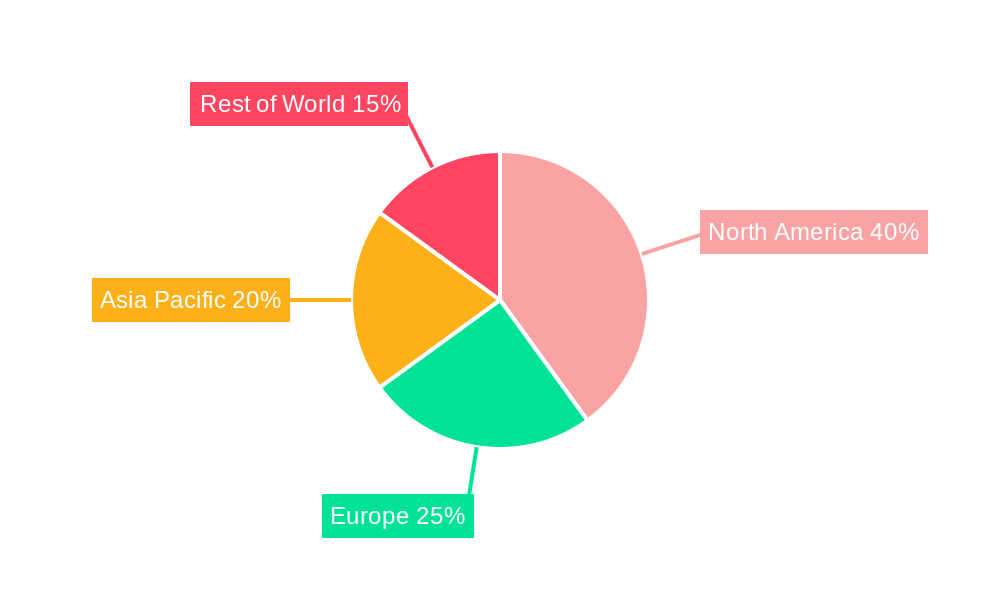
mHealth Apps Industry Market Size (In Million)
The market segmentation reveals diverse opportunities. Monitoring services, encompassing applications for blood glucose, cardiac, and other vital sign tracking, represent a significant segment. Post-acute care services, designed to support recovery and rehabilitation after hospitalization, are also experiencing considerable growth. The expansion is not geographically confined; North America, with its established healthcare infrastructure and technological prowess, currently holds a large market share. However, rapid growth is expected in Asia-Pacific and other emerging regions driven by increasing smartphone penetration and government initiatives promoting telehealth. While challenges remain, such as data security and privacy concerns and the need for regulatory frameworks, the overall market outlook for mHealth apps remains extremely positive, positioning it for substantial expansion throughout the forecast period.
mHealth Apps Industry Company Market Share
mHealth Apps Industry: A Comprehensive Market Report (2019-2033)
This comprehensive report provides an in-depth analysis of the mHealth apps industry, offering invaluable insights for stakeholders including healthcare providers, mobile operators, application developers, and investors. The report covers market dynamics, leading players, emerging trends, and future growth opportunities, using data spanning the period 2019-2033, with a focus on 2025. The global mHealth apps market is projected to reach a value of xx Million by 2033.
mHealth Apps Industry Market Dynamics & Concentration
The mHealth apps market exhibits a dynamic landscape shaped by continuous innovation, evolving regulatory frameworks, and increasing competition. Market concentration is moderate, with several key players holding significant market share, but a large number of smaller niche players also exist. The industry is characterized by a high rate of mergers and acquisitions (M&A) activity, with an estimated xx number of deals recorded between 2019 and 2024. This consolidation trend is driven by the desire for larger companies to expand their product portfolios and gain access to new technologies and markets.
- Market Share: The top 5 players collectively hold an estimated xx% market share in 2025.
- Innovation Drivers: Advancements in mobile technology, artificial intelligence (AI), and big data analytics are driving innovation and creating new opportunities for mHealth app development.
- Regulatory Frameworks: Varying regulatory landscapes across different countries present both challenges and opportunities, influencing market growth and adoption rates.
- Product Substitutes: Traditional healthcare services remain a primary substitute for mHealth apps, though the increasing convenience and affordability of mHealth are driving substitution.
- End-User Trends: Growing consumer awareness of health and wellness, coupled with increasing smartphone penetration, is fueling demand for mHealth apps.
- M&A Activity: The number of M&A deals in the sector is expected to increase to xx by 2033, driven by the need for consolidation and expansion.
mHealth Apps Industry Industry Trends & Analysis
The mHealth apps industry is experiencing robust growth, driven by several key factors. The compound annual growth rate (CAGR) during the forecast period (2025-2033) is estimated at xx%, reflecting the increasing adoption of mobile health solutions. Technological advancements, particularly in areas such as AI and wearables, are creating new opportunities for personalized and proactive healthcare. Changing consumer preferences are also playing a role, with individuals increasingly seeking convenient and accessible healthcare options. However, competitive dynamics remain intense, with established players and new entrants vying for market share. Market penetration is projected to reach xx% by 2033.
Leading Markets & Segments in mHealth Apps Industry
The North American market currently dominates the global mHealth apps industry, driven by factors such as high healthcare spending, advanced technological infrastructure, and strong regulatory support. However, other regions, particularly in Asia-Pacific, are showing significant growth potential.
Dominant Segments:
- Service Type: Monitoring Services (particularly Remote Patient Monitoring) and Teleconsultation are leading segments due to their cost-effectiveness and convenience.
- Stakeholder: Healthcare providers are the primary adopters, followed by mobile operators and application/content players.
- Device Type: Remote Patient Monitoring Devices (RPMDs) and Blood Glucose Monitors are leading the device segment, driven by the increasing prevalence of chronic diseases.
Key Drivers by Region:
- North America: Strong regulatory support, advanced healthcare infrastructure, high per capita healthcare expenditure.
- Europe: Growing adoption of telehealth and remote patient monitoring solutions.
- Asia-Pacific: Rapidly increasing smartphone penetration and rising healthcare awareness.
mHealth Apps Industry Product Developments
Recent product innovations focus on integrating AI and machine learning to improve diagnostic accuracy, personalized treatment plans, and predictive analytics. The integration of wearables and IoT devices enhances data collection and real-time monitoring capabilities, creating personalized and proactive healthcare solutions that improve patient outcomes and reduce healthcare costs. Competitive advantages are increasingly driven by superior data analytics capabilities and user-friendly interfaces.
Key Drivers of mHealth Apps Industry Growth
Several factors contribute to the growth of the mHealth apps industry. Technological advancements, such as the development of more sophisticated mobile devices and sensors, are enabling the creation of more effective and user-friendly apps. Favorable economic conditions and government support for digital health initiatives are providing further impetus. Increased regulatory clarity in certain markets is also boosting industry growth.
Challenges in the mHealth Apps Industry Market
Despite the considerable growth potential, the mHealth apps market faces several challenges. Regulatory hurdles, particularly concerning data privacy and security, pose significant barriers to market entry and expansion. Supply chain disruptions and fluctuations in raw material prices can impact product availability and costs. Intense competition, both from established players and new entrants, puts downward pressure on prices and margins. These factors contribute to an overall competitive landscape with various entry barriers. The estimated impact of these challenges on market growth is a reduction of xx Million in revenue by 2033.
Emerging Opportunities in mHealth Apps Industry
The mHealth apps industry is poised for continued expansion due to several significant opportunities. Technological breakthroughs, such as advancements in AI, machine learning, and cloud computing, offer potential for greater personalization and predictive capabilities in healthcare. Strategic partnerships between technology companies, healthcare providers, and insurers can expand access to care and create integrated solutions. Expansion into underserved markets, especially in developing countries, presents a huge potential for growth and improved healthcare accessibility.
Leading Players in the mHealth Apps Industry Sector
- Bayer AG
- InTouch Health
- Cisco Systems Inc
- Omron Corporation
- Medtronic PLC
- Cerner Corporation
- Koninklijke Philips NV
- Johnson & Johnson
- AT&T Inc
- Athenahealth Inc
Key Milestones in mHealth Apps Industry Industry
- 2020: Increased adoption of telehealth platforms due to the COVID-19 pandemic.
- 2021: Significant investments in AI-powered diagnostic tools for mHealth apps.
- 2022: Launch of several new wearable devices with integrated health monitoring capabilities.
- 2023: Increased regulatory scrutiny of data privacy and security in mHealth apps.
- 2024: Several key mergers and acquisitions in the mHealth app market.
Strategic Outlook for mHealth Apps Industry Market
The future of the mHealth apps market is bright, with significant growth potential driven by technological innovation, increasing consumer demand, and favorable regulatory developments. Strategic opportunities lie in leveraging AI and machine learning to personalize healthcare delivery, expanding into new markets, and forging strategic partnerships to create integrated healthcare solutions. The market is poised for continued expansion, with a projected value exceeding xx Million by 2033, contributing significantly to the overall improvement in healthcare delivery and patient outcomes.
mHealth Apps Industry Segmentation
-
1. Service Type
-
1.1. Monitoring Services
- 1.1.1. Independent Aging Solutions
- 1.1.2. Chronic Disease Management
- 1.1.3. Post-acute Care Services
-
1.2. Diagnostic Services
- 1.2.1. Self Diagnosis
- 1.2.2. Telemedicine Solutions
- 1.2.3. Medical
-
1.3. Treatment Services
- 1.3.1. Remote Patient Monitoring Services
- 1.3.2. Teleconsultation
- 1.4. Wellness and Fitness Solutions
- 1.5. Other Se
-
1.1. Monitoring Services
-
2. Device Type
- 2.1. Blood Glucose Monitors
- 2.2. Cardiac Monitors
- 2.3. Hemodynamic Monitors
- 2.4. Neurological Monitors
- 2.5. Respiratory Monitors
- 2.6. Body and Temperature Monitors
- 2.7. Remote Patient Monitoring Devices
- 2.8. Other Device Types
-
3. Stake Holder
- 3.1. Mobile Operators
- 3.2. Healthcare Providers
- 3.3. Application/Content Players
- 3.4. Other Stake Holders
mHealth Apps Industry Segmentation By Geography
-
1. North America
- 1.1. United States
- 1.2. Canada
- 1.3. Mexico
-
2. South America
- 2.1. Brazil
- 2.2. Argentina
- 2.3. Rest of South America
-
3. Europe
- 3.1. United Kingdom
- 3.2. Germany
- 3.3. France
- 3.4. Italy
- 3.5. Spain
- 3.6. Russia
- 3.7. Benelux
- 3.8. Nordics
- 3.9. Rest of Europe
-
4. Middle East & Africa
- 4.1. Turkey
- 4.2. Israel
- 4.3. GCC
- 4.4. North Africa
- 4.5. South Africa
- 4.6. Rest of Middle East & Africa
-
5. Asia Pacific
- 5.1. China
- 5.2. India
- 5.3. Japan
- 5.4. South Korea
- 5.5. ASEAN
- 5.6. Oceania
- 5.7. Rest of Asia Pacific
mHealth Apps Industry Regional Market Share
Geographic Coverage of mHealth Apps Industry
mHealth Apps Industry REPORT HIGHLIGHTS
| Aspects | Details |
|---|---|
| Study Period | 2020-2034 |
| Base Year | 2025 |
| Estimated Year | 2026 |
| Forecast Period | 2026-2034 |
| Historical Period | 2020-2025 |
| Growth Rate | CAGR of 27.30% from 2020-2034 |
| Segmentation |
|
Table of Contents
- 1. Introduction
- 1.1. Research Scope
- 1.2. Market Segmentation
- 1.3. Research Objective
- 1.4. Definitions and Assumptions
- 2. Executive Summary
- 2.1. Market Snapshot
- 3. Market Dynamics
- 3.1. Market Drivers
- 3.2. Market Restrains
- 3.3. Market Trends
- 3.4. Market Opportunities
- 4. Market Factor Analysis
- 4.1. Porters Five Forces
- 4.1.1. Bargaining Power of Suppliers
- 4.1.2. Bargaining Power of Buyers
- 4.1.3. Threat of New Entrants
- 4.1.4. Threat of Substitutes
- 4.1.5. Competitive Rivalry
- 4.2. PESTEL analysis
- 4.3. BCG Analysis
- 4.3.1. Stars (High Growth, High Market Share)
- 4.3.2. Cash Cows (Low Growth, High Market Share)
- 4.3.3. Question Mark (High Growth, Low Market Share)
- 4.3.4. Dogs (Low Growth, Low Market Share)
- 4.4. Ansoff Matrix Analysis
- 4.5. Supply Chain Analysis
- 4.6. Regulatory Landscape
- 4.7. Current Market Potential and Opportunity Assessment (TAM–SAM–SOM Framework)
- 4.8. MDP Analyst Note
- 4.1. Porters Five Forces
- 5. Market Analysis, Insights and Forecast 2021-2033
- 5.1. Market Analysis, Insights and Forecast - by Service Type
- 5.1.1. Monitoring Services
- 5.1.1.1. Independent Aging Solutions
- 5.1.1.2. Chronic Disease Management
- 5.1.1.3. Post-acute Care Services
- 5.1.2. Diagnostic Services
- 5.1.2.1. Self Diagnosis
- 5.1.2.2. Telemedicine Solutions
- 5.1.2.3. Medical
- 5.1.3. Treatment Services
- 5.1.3.1. Remote Patient Monitoring Services
- 5.1.3.2. Teleconsultation
- 5.1.4. Wellness and Fitness Solutions
- 5.1.5. Other Se
- 5.1.1. Monitoring Services
- 5.2. Market Analysis, Insights and Forecast - by Device Type
- 5.2.1. Blood Glucose Monitors
- 5.2.2. Cardiac Monitors
- 5.2.3. Hemodynamic Monitors
- 5.2.4. Neurological Monitors
- 5.2.5. Respiratory Monitors
- 5.2.6. Body and Temperature Monitors
- 5.2.7. Remote Patient Monitoring Devices
- 5.2.8. Other Device Types
- 5.3. Market Analysis, Insights and Forecast - by Stake Holder
- 5.3.1. Mobile Operators
- 5.3.2. Healthcare Providers
- 5.3.3. Application/Content Players
- 5.3.4. Other Stake Holders
- 5.4. Market Analysis, Insights and Forecast - by Region
- 5.4.1. North America
- 5.4.2. South America
- 5.4.3. Europe
- 5.4.4. Middle East & Africa
- 5.4.5. Asia Pacific
- 5.1. Market Analysis, Insights and Forecast - by Service Type
- 6. Global mHealth Apps Industry Analysis, Insights and Forecast, 2021-2033
- 6.1. Market Analysis, Insights and Forecast - by Service Type
- 6.1.1. Monitoring Services
- 6.1.1.1. Independent Aging Solutions
- 6.1.1.2. Chronic Disease Management
- 6.1.1.3. Post-acute Care Services
- 6.1.2. Diagnostic Services
- 6.1.2.1. Self Diagnosis
- 6.1.2.2. Telemedicine Solutions
- 6.1.2.3. Medical
- 6.1.3. Treatment Services
- 6.1.3.1. Remote Patient Monitoring Services
- 6.1.3.2. Teleconsultation
- 6.1.4. Wellness and Fitness Solutions
- 6.1.5. Other Se
- 6.1.1. Monitoring Services
- 6.2. Market Analysis, Insights and Forecast - by Device Type
- 6.2.1. Blood Glucose Monitors
- 6.2.2. Cardiac Monitors
- 6.2.3. Hemodynamic Monitors
- 6.2.4. Neurological Monitors
- 6.2.5. Respiratory Monitors
- 6.2.6. Body and Temperature Monitors
- 6.2.7. Remote Patient Monitoring Devices
- 6.2.8. Other Device Types
- 6.3. Market Analysis, Insights and Forecast - by Stake Holder
- 6.3.1. Mobile Operators
- 6.3.2. Healthcare Providers
- 6.3.3. Application/Content Players
- 6.3.4. Other Stake Holders
- 6.1. Market Analysis, Insights and Forecast - by Service Type
- 7. North America mHealth Apps Industry Analysis, Insights and Forecast, 2020-2032
- 7.1. Market Analysis, Insights and Forecast - by Service Type
- 7.1.1. Monitoring Services
- 7.1.1.1. Independent Aging Solutions
- 7.1.1.2. Chronic Disease Management
- 7.1.1.3. Post-acute Care Services
- 7.1.2. Diagnostic Services
- 7.1.2.1. Self Diagnosis
- 7.1.2.2. Telemedicine Solutions
- 7.1.2.3. Medical
- 7.1.3. Treatment Services
- 7.1.3.1. Remote Patient Monitoring Services
- 7.1.3.2. Teleconsultation
- 7.1.4. Wellness and Fitness Solutions
- 7.1.5. Other Se
- 7.1.1. Monitoring Services
- 7.2. Market Analysis, Insights and Forecast - by Device Type
- 7.2.1. Blood Glucose Monitors
- 7.2.2. Cardiac Monitors
- 7.2.3. Hemodynamic Monitors
- 7.2.4. Neurological Monitors
- 7.2.5. Respiratory Monitors
- 7.2.6. Body and Temperature Monitors
- 7.2.7. Remote Patient Monitoring Devices
- 7.2.8. Other Device Types
- 7.3. Market Analysis, Insights and Forecast - by Stake Holder
- 7.3.1. Mobile Operators
- 7.3.2. Healthcare Providers
- 7.3.3. Application/Content Players
- 7.3.4. Other Stake Holders
- 7.1. Market Analysis, Insights and Forecast - by Service Type
- 8. South America mHealth Apps Industry Analysis, Insights and Forecast, 2020-2032
- 8.1. Market Analysis, Insights and Forecast - by Service Type
- 8.1.1. Monitoring Services
- 8.1.1.1. Independent Aging Solutions
- 8.1.1.2. Chronic Disease Management
- 8.1.1.3. Post-acute Care Services
- 8.1.2. Diagnostic Services
- 8.1.2.1. Self Diagnosis
- 8.1.2.2. Telemedicine Solutions
- 8.1.2.3. Medical
- 8.1.3. Treatment Services
- 8.1.3.1. Remote Patient Monitoring Services
- 8.1.3.2. Teleconsultation
- 8.1.4. Wellness and Fitness Solutions
- 8.1.5. Other Se
- 8.1.1. Monitoring Services
- 8.2. Market Analysis, Insights and Forecast - by Device Type
- 8.2.1. Blood Glucose Monitors
- 8.2.2. Cardiac Monitors
- 8.2.3. Hemodynamic Monitors
- 8.2.4. Neurological Monitors
- 8.2.5. Respiratory Monitors
- 8.2.6. Body and Temperature Monitors
- 8.2.7. Remote Patient Monitoring Devices
- 8.2.8. Other Device Types
- 8.3. Market Analysis, Insights and Forecast - by Stake Holder
- 8.3.1. Mobile Operators
- 8.3.2. Healthcare Providers
- 8.3.3. Application/Content Players
- 8.3.4. Other Stake Holders
- 8.1. Market Analysis, Insights and Forecast - by Service Type
- 9. Europe mHealth Apps Industry Analysis, Insights and Forecast, 2020-2032
- 9.1. Market Analysis, Insights and Forecast - by Service Type
- 9.1.1. Monitoring Services
- 9.1.1.1. Independent Aging Solutions
- 9.1.1.2. Chronic Disease Management
- 9.1.1.3. Post-acute Care Services
- 9.1.2. Diagnostic Services
- 9.1.2.1. Self Diagnosis
- 9.1.2.2. Telemedicine Solutions
- 9.1.2.3. Medical
- 9.1.3. Treatment Services
- 9.1.3.1. Remote Patient Monitoring Services
- 9.1.3.2. Teleconsultation
- 9.1.4. Wellness and Fitness Solutions
- 9.1.5. Other Se
- 9.1.1. Monitoring Services
- 9.2. Market Analysis, Insights and Forecast - by Device Type
- 9.2.1. Blood Glucose Monitors
- 9.2.2. Cardiac Monitors
- 9.2.3. Hemodynamic Monitors
- 9.2.4. Neurological Monitors
- 9.2.5. Respiratory Monitors
- 9.2.6. Body and Temperature Monitors
- 9.2.7. Remote Patient Monitoring Devices
- 9.2.8. Other Device Types
- 9.3. Market Analysis, Insights and Forecast - by Stake Holder
- 9.3.1. Mobile Operators
- 9.3.2. Healthcare Providers
- 9.3.3. Application/Content Players
- 9.3.4. Other Stake Holders
- 9.1. Market Analysis, Insights and Forecast - by Service Type
- 10. Middle East & Africa mHealth Apps Industry Analysis, Insights and Forecast, 2020-2032
- 10.1. Market Analysis, Insights and Forecast - by Service Type
- 10.1.1. Monitoring Services
- 10.1.1.1. Independent Aging Solutions
- 10.1.1.2. Chronic Disease Management
- 10.1.1.3. Post-acute Care Services
- 10.1.2. Diagnostic Services
- 10.1.2.1. Self Diagnosis
- 10.1.2.2. Telemedicine Solutions
- 10.1.2.3. Medical
- 10.1.3. Treatment Services
- 10.1.3.1. Remote Patient Monitoring Services
- 10.1.3.2. Teleconsultation
- 10.1.4. Wellness and Fitness Solutions
- 10.1.5. Other Se
- 10.1.1. Monitoring Services
- 10.2. Market Analysis, Insights and Forecast - by Device Type
- 10.2.1. Blood Glucose Monitors
- 10.2.2. Cardiac Monitors
- 10.2.3. Hemodynamic Monitors
- 10.2.4. Neurological Monitors
- 10.2.5. Respiratory Monitors
- 10.2.6. Body and Temperature Monitors
- 10.2.7. Remote Patient Monitoring Devices
- 10.2.8. Other Device Types
- 10.3. Market Analysis, Insights and Forecast - by Stake Holder
- 10.3.1. Mobile Operators
- 10.3.2. Healthcare Providers
- 10.3.3. Application/Content Players
- 10.3.4. Other Stake Holders
- 10.1. Market Analysis, Insights and Forecast - by Service Type
- 11. Asia Pacific mHealth Apps Industry Analysis, Insights and Forecast, 2020-2032
- 11.1. Market Analysis, Insights and Forecast - by Service Type
- 11.1.1. Monitoring Services
- 11.1.1.1. Independent Aging Solutions
- 11.1.1.2. Chronic Disease Management
- 11.1.1.3. Post-acute Care Services
- 11.1.2. Diagnostic Services
- 11.1.2.1. Self Diagnosis
- 11.1.2.2. Telemedicine Solutions
- 11.1.2.3. Medical
- 11.1.3. Treatment Services
- 11.1.3.1. Remote Patient Monitoring Services
- 11.1.3.2. Teleconsultation
- 11.1.4. Wellness and Fitness Solutions
- 11.1.5. Other Se
- 11.1.1. Monitoring Services
- 11.2. Market Analysis, Insights and Forecast - by Device Type
- 11.2.1. Blood Glucose Monitors
- 11.2.2. Cardiac Monitors
- 11.2.3. Hemodynamic Monitors
- 11.2.4. Neurological Monitors
- 11.2.5. Respiratory Monitors
- 11.2.6. Body and Temperature Monitors
- 11.2.7. Remote Patient Monitoring Devices
- 11.2.8. Other Device Types
- 11.3. Market Analysis, Insights and Forecast - by Stake Holder
- 11.3.1. Mobile Operators
- 11.3.2. Healthcare Providers
- 11.3.3. Application/Content Players
- 11.3.4. Other Stake Holders
- 11.1. Market Analysis, Insights and Forecast - by Service Type
- 12. Competitive Analysis
- 12.1. Company Profiles
- 12.1.1 Bayer AG
- 12.1.1.1. Company Overview
- 12.1.1.2. Products
- 12.1.1.3. Company Financials
- 12.1.1.4. SWOT Analysis
- 12.1.2 InTouch Health
- 12.1.2.1. Company Overview
- 12.1.2.2. Products
- 12.1.2.3. Company Financials
- 12.1.2.4. SWOT Analysis
- 12.1.3 Cisco Systems Inc
- 12.1.3.1. Company Overview
- 12.1.3.2. Products
- 12.1.3.3. Company Financials
- 12.1.3.4. SWOT Analysis
- 12.1.4 Omron Corporation*List Not Exhaustive
- 12.1.4.1. Company Overview
- 12.1.4.2. Products
- 12.1.4.3. Company Financials
- 12.1.4.4. SWOT Analysis
- 12.1.5 Medtronic PLC
- 12.1.5.1. Company Overview
- 12.1.5.2. Products
- 12.1.5.3. Company Financials
- 12.1.5.4. SWOT Analysis
- 12.1.6 Cerner Corporation
- 12.1.6.1. Company Overview
- 12.1.6.2. Products
- 12.1.6.3. Company Financials
- 12.1.6.4. SWOT Analysis
- 12.1.7 Koninklijke Philips NV
- 12.1.7.1. Company Overview
- 12.1.7.2. Products
- 12.1.7.3. Company Financials
- 12.1.7.4. SWOT Analysis
- 12.1.8 Johnson & Johnson
- 12.1.8.1. Company Overview
- 12.1.8.2. Products
- 12.1.8.3. Company Financials
- 12.1.8.4. SWOT Analysis
- 12.1.9 AT&T Inc
- 12.1.9.1. Company Overview
- 12.1.9.2. Products
- 12.1.9.3. Company Financials
- 12.1.9.4. SWOT Analysis
- 12.1.10 Athenahealth Inc
- 12.1.10.1. Company Overview
- 12.1.10.2. Products
- 12.1.10.3. Company Financials
- 12.1.10.4. SWOT Analysis
- 12.1.1 Bayer AG
- 12.2. Market Entropy
- 12.2.1 Company's Key Areas Served
- 12.2.2 Recent Developments
- 12.3. Company Market Share Analysis 2025
- 12.3.1 Top 5 Companies Market Share Analysis
- 12.3.2 Top 3 Companies Market Share Analysis
- 12.4. List of Potential Customers
- 13. Research Methodology
List of Figures
- Figure 1: Global mHealth Apps Industry Revenue Breakdown (Million, %) by Region 2025 & 2033
- Figure 2: North America mHealth Apps Industry Revenue (Million), by Service Type 2025 & 2033
- Figure 3: North America mHealth Apps Industry Revenue Share (%), by Service Type 2025 & 2033
- Figure 4: North America mHealth Apps Industry Revenue (Million), by Device Type 2025 & 2033
- Figure 5: North America mHealth Apps Industry Revenue Share (%), by Device Type 2025 & 2033
- Figure 6: North America mHealth Apps Industry Revenue (Million), by Stake Holder 2025 & 2033
- Figure 7: North America mHealth Apps Industry Revenue Share (%), by Stake Holder 2025 & 2033
- Figure 8: North America mHealth Apps Industry Revenue (Million), by Country 2025 & 2033
- Figure 9: North America mHealth Apps Industry Revenue Share (%), by Country 2025 & 2033
- Figure 10: South America mHealth Apps Industry Revenue (Million), by Service Type 2025 & 2033
- Figure 11: South America mHealth Apps Industry Revenue Share (%), by Service Type 2025 & 2033
- Figure 12: South America mHealth Apps Industry Revenue (Million), by Device Type 2025 & 2033
- Figure 13: South America mHealth Apps Industry Revenue Share (%), by Device Type 2025 & 2033
- Figure 14: South America mHealth Apps Industry Revenue (Million), by Stake Holder 2025 & 2033
- Figure 15: South America mHealth Apps Industry Revenue Share (%), by Stake Holder 2025 & 2033
- Figure 16: South America mHealth Apps Industry Revenue (Million), by Country 2025 & 2033
- Figure 17: South America mHealth Apps Industry Revenue Share (%), by Country 2025 & 2033
- Figure 18: Europe mHealth Apps Industry Revenue (Million), by Service Type 2025 & 2033
- Figure 19: Europe mHealth Apps Industry Revenue Share (%), by Service Type 2025 & 2033
- Figure 20: Europe mHealth Apps Industry Revenue (Million), by Device Type 2025 & 2033
- Figure 21: Europe mHealth Apps Industry Revenue Share (%), by Device Type 2025 & 2033
- Figure 22: Europe mHealth Apps Industry Revenue (Million), by Stake Holder 2025 & 2033
- Figure 23: Europe mHealth Apps Industry Revenue Share (%), by Stake Holder 2025 & 2033
- Figure 24: Europe mHealth Apps Industry Revenue (Million), by Country 2025 & 2033
- Figure 25: Europe mHealth Apps Industry Revenue Share (%), by Country 2025 & 2033
- Figure 26: Middle East & Africa mHealth Apps Industry Revenue (Million), by Service Type 2025 & 2033
- Figure 27: Middle East & Africa mHealth Apps Industry Revenue Share (%), by Service Type 2025 & 2033
- Figure 28: Middle East & Africa mHealth Apps Industry Revenue (Million), by Device Type 2025 & 2033
- Figure 29: Middle East & Africa mHealth Apps Industry Revenue Share (%), by Device Type 2025 & 2033
- Figure 30: Middle East & Africa mHealth Apps Industry Revenue (Million), by Stake Holder 2025 & 2033
- Figure 31: Middle East & Africa mHealth Apps Industry Revenue Share (%), by Stake Holder 2025 & 2033
- Figure 32: Middle East & Africa mHealth Apps Industry Revenue (Million), by Country 2025 & 2033
- Figure 33: Middle East & Africa mHealth Apps Industry Revenue Share (%), by Country 2025 & 2033
- Figure 34: Asia Pacific mHealth Apps Industry Revenue (Million), by Service Type 2025 & 2033
- Figure 35: Asia Pacific mHealth Apps Industry Revenue Share (%), by Service Type 2025 & 2033
- Figure 36: Asia Pacific mHealth Apps Industry Revenue (Million), by Device Type 2025 & 2033
- Figure 37: Asia Pacific mHealth Apps Industry Revenue Share (%), by Device Type 2025 & 2033
- Figure 38: Asia Pacific mHealth Apps Industry Revenue (Million), by Stake Holder 2025 & 2033
- Figure 39: Asia Pacific mHealth Apps Industry Revenue Share (%), by Stake Holder 2025 & 2033
- Figure 40: Asia Pacific mHealth Apps Industry Revenue (Million), by Country 2025 & 2033
- Figure 41: Asia Pacific mHealth Apps Industry Revenue Share (%), by Country 2025 & 2033
List of Tables
- Table 1: Global mHealth Apps Industry Revenue Million Forecast, by Service Type 2020 & 2033
- Table 2: Global mHealth Apps Industry Revenue Million Forecast, by Device Type 2020 & 2033
- Table 3: Global mHealth Apps Industry Revenue Million Forecast, by Stake Holder 2020 & 2033
- Table 4: Global mHealth Apps Industry Revenue Million Forecast, by Region 2020 & 2033
- Table 5: Global mHealth Apps Industry Revenue Million Forecast, by Service Type 2020 & 2033
- Table 6: Global mHealth Apps Industry Revenue Million Forecast, by Device Type 2020 & 2033
- Table 7: Global mHealth Apps Industry Revenue Million Forecast, by Stake Holder 2020 & 2033
- Table 8: Global mHealth Apps Industry Revenue Million Forecast, by Country 2020 & 2033
- Table 9: United States mHealth Apps Industry Revenue (Million) Forecast, by Application 2020 & 2033
- Table 10: Canada mHealth Apps Industry Revenue (Million) Forecast, by Application 2020 & 2033
- Table 11: Mexico mHealth Apps Industry Revenue (Million) Forecast, by Application 2020 & 2033
- Table 12: Global mHealth Apps Industry Revenue Million Forecast, by Service Type 2020 & 2033
- Table 13: Global mHealth Apps Industry Revenue Million Forecast, by Device Type 2020 & 2033
- Table 14: Global mHealth Apps Industry Revenue Million Forecast, by Stake Holder 2020 & 2033
- Table 15: Global mHealth Apps Industry Revenue Million Forecast, by Country 2020 & 2033
- Table 16: Brazil mHealth Apps Industry Revenue (Million) Forecast, by Application 2020 & 2033
- Table 17: Argentina mHealth Apps Industry Revenue (Million) Forecast, by Application 2020 & 2033
- Table 18: Rest of South America mHealth Apps Industry Revenue (Million) Forecast, by Application 2020 & 2033
- Table 19: Global mHealth Apps Industry Revenue Million Forecast, by Service Type 2020 & 2033
- Table 20: Global mHealth Apps Industry Revenue Million Forecast, by Device Type 2020 & 2033
- Table 21: Global mHealth Apps Industry Revenue Million Forecast, by Stake Holder 2020 & 2033
- Table 22: Global mHealth Apps Industry Revenue Million Forecast, by Country 2020 & 2033
- Table 23: United Kingdom mHealth Apps Industry Revenue (Million) Forecast, by Application 2020 & 2033
- Table 24: Germany mHealth Apps Industry Revenue (Million) Forecast, by Application 2020 & 2033
- Table 25: France mHealth Apps Industry Revenue (Million) Forecast, by Application 2020 & 2033
- Table 26: Italy mHealth Apps Industry Revenue (Million) Forecast, by Application 2020 & 2033
- Table 27: Spain mHealth Apps Industry Revenue (Million) Forecast, by Application 2020 & 2033
- Table 28: Russia mHealth Apps Industry Revenue (Million) Forecast, by Application 2020 & 2033
- Table 29: Benelux mHealth Apps Industry Revenue (Million) Forecast, by Application 2020 & 2033
- Table 30: Nordics mHealth Apps Industry Revenue (Million) Forecast, by Application 2020 & 2033
- Table 31: Rest of Europe mHealth Apps Industry Revenue (Million) Forecast, by Application 2020 & 2033
- Table 32: Global mHealth Apps Industry Revenue Million Forecast, by Service Type 2020 & 2033
- Table 33: Global mHealth Apps Industry Revenue Million Forecast, by Device Type 2020 & 2033
- Table 34: Global mHealth Apps Industry Revenue Million Forecast, by Stake Holder 2020 & 2033
- Table 35: Global mHealth Apps Industry Revenue Million Forecast, by Country 2020 & 2033
- Table 36: Turkey mHealth Apps Industry Revenue (Million) Forecast, by Application 2020 & 2033
- Table 37: Israel mHealth Apps Industry Revenue (Million) Forecast, by Application 2020 & 2033
- Table 38: GCC mHealth Apps Industry Revenue (Million) Forecast, by Application 2020 & 2033
- Table 39: North Africa mHealth Apps Industry Revenue (Million) Forecast, by Application 2020 & 2033
- Table 40: South Africa mHealth Apps Industry Revenue (Million) Forecast, by Application 2020 & 2033
- Table 41: Rest of Middle East & Africa mHealth Apps Industry Revenue (Million) Forecast, by Application 2020 & 2033
- Table 42: Global mHealth Apps Industry Revenue Million Forecast, by Service Type 2020 & 2033
- Table 43: Global mHealth Apps Industry Revenue Million Forecast, by Device Type 2020 & 2033
- Table 44: Global mHealth Apps Industry Revenue Million Forecast, by Stake Holder 2020 & 2033
- Table 45: Global mHealth Apps Industry Revenue Million Forecast, by Country 2020 & 2033
- Table 46: China mHealth Apps Industry Revenue (Million) Forecast, by Application 2020 & 2033
- Table 47: India mHealth Apps Industry Revenue (Million) Forecast, by Application 2020 & 2033
- Table 48: Japan mHealth Apps Industry Revenue (Million) Forecast, by Application 2020 & 2033
- Table 49: South Korea mHealth Apps Industry Revenue (Million) Forecast, by Application 2020 & 2033
- Table 50: ASEAN mHealth Apps Industry Revenue (Million) Forecast, by Application 2020 & 2033
- Table 51: Oceania mHealth Apps Industry Revenue (Million) Forecast, by Application 2020 & 2033
- Table 52: Rest of Asia Pacific mHealth Apps Industry Revenue (Million) Forecast, by Application 2020 & 2033
Frequently Asked Questions
1. What is the projected Compound Annual Growth Rate (CAGR) of the mHealth Apps Industry?
The projected CAGR is approximately 27.30%.
2. Which companies are prominent players in the mHealth Apps Industry?
Key companies in the market include Bayer AG, InTouch Health, Cisco Systems Inc, Omron Corporation*List Not Exhaustive, Medtronic PLC, Cerner Corporation, Koninklijke Philips NV, Johnson & Johnson, AT&T Inc, Athenahealth Inc.
3. What are the main segments of the mHealth Apps Industry?
The market segments include Service Type, Device Type, Stake Holder.
4. Can you provide details about the market size?
The market size is estimated to be USD 50.9 Million as of 2022.
5. What are some drivers contributing to market growth?
; Growing usage of Smartphones. Tablets. and Mobile Technology in Healthcare; Increasing Awareness of People for Chronic Diseases; Increasing Focus on Personalized Medicine and Patient-centered Approach; Increased Usage of Mobile Health App.
6. What are the notable trends driving market growth?
Remote Patient Monitoring Devices is the Leading Segment Under Devices Type that is Expected to Grow During the Forecast Period.
7. Are there any restraints impacting market growth?
; Data Insecurity; Provider Liability Concerns; Lower Adoption in Rural Areas.
8. Can you provide examples of recent developments in the market?
N/A
9. What pricing options are available for accessing the report?
Pricing options include single-user, multi-user, and enterprise licenses priced at USD 3800, USD 4500, and USD 5800 respectively.
10. Is the market size provided in terms of value or volume?
The market size is provided in terms of value, measured in Million.
11. Are there any specific market keywords associated with the report?
Yes, the market keyword associated with the report is "mHealth Apps Industry," which aids in identifying and referencing the specific market segment covered.
12. How do I determine which pricing option suits my needs best?
The pricing options vary based on user requirements and access needs. Individual users may opt for single-user licenses, while businesses requiring broader access may choose multi-user or enterprise licenses for cost-effective access to the report.
13. Are there any additional resources or data provided in the mHealth Apps Industry report?
While the report offers comprehensive insights, it's advisable to review the specific contents or supplementary materials provided to ascertain if additional resources or data are available.
14. How can I stay updated on further developments or reports in the mHealth Apps Industry?
To stay informed about further developments, trends, and reports in the mHealth Apps Industry, consider subscribing to industry newsletters, following relevant companies and organizations, or regularly checking reputable industry news sources and publications.
Methodology
Step 1 - Identification of Relevant Samples Size from Population Database


Step 2 - Approaches for Defining Global Market Size (Value, Volume* & Price*)

Note*: In applicable scenarios
Step 3 - Data Sources
Primary Research
- Web Analytics
- Survey Reports
- Research Institute
- Latest Research Reports
- Opinion Leaders
Secondary Research
- Annual Reports
- White Paper
- Latest Press Release
- Industry Association
- Paid Database
- Investor Presentations

Step 4 - Data Triangulation
Involves using different sources of information in order to increase the validity of a study
These sources are likely to be stakeholders in a program - participants, other researchers, program staff, other community members, and so on.
Then we put all data in single framework & apply various statistical tools to find out the dynamic on the market.
During the analysis stage, feedback from the stakeholder groups would be compared to determine areas of agreement as well as areas of divergence