

Key Insights
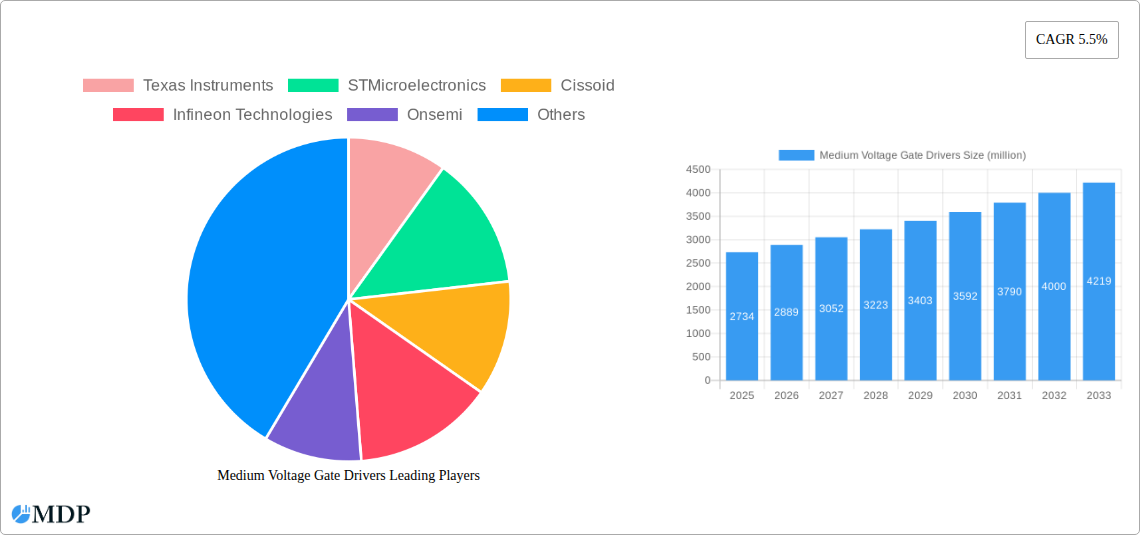
The medium-voltage gate driver market, currently valued at $2734 million in 2025, is projected to experience robust growth, driven by the increasing adoption of renewable energy sources, the expansion of electric vehicle infrastructure, and the growing demand for advanced industrial automation. The 5.5% CAGR indicates a steady expansion throughout the forecast period (2025-2033). Key application segments like power and energy industries are experiencing significant growth due to the rising need for efficient power conversion and grid modernization. The medical industry also contributes substantially, fueled by the increasing use of advanced medical equipment requiring precise and reliable gate drivers. Technological advancements in power semiconductor devices, leading to higher switching frequencies and power densities, further stimulate market growth. The market is segmented by type, with full-bridge gate drivers gaining traction due to their versatility in handling higher power applications compared to half-bridge counterparts. Major players like Texas Instruments, STMicroelectronics, and Infineon Technologies are actively innovating and expanding their product portfolios to cater to the rising demand. Geographic distribution shows strong growth in North America and Asia Pacific, driven by robust industrialization and the adoption of smart grids.
Medium Voltage Gate Drivers Market Size (In Billion)
Growth is expected to be particularly strong in emerging economies within Asia Pacific and certain regions in Africa, driven by infrastructure development and industrial expansion. Restraints include the relatively high cost of advanced gate driver technology and the need for specialized expertise in design and implementation. However, ongoing technological advancements are expected to mitigate these challenges, leading to increased affordability and ease of integration. The competitive landscape is characterized by strong players vying for market share through product innovation, strategic partnerships, and acquisitions. The market's future trajectory is significantly positive, underpinned by global trends toward sustainable energy and automation.

Medium Voltage Gate Drivers Company Market Share
Medium Voltage Gate Drivers Market Report: A Comprehensive Analysis (2019-2033)
Unlocking the potential of a multi-million dollar market: This in-depth report provides a comprehensive analysis of the Medium Voltage Gate Drivers market, offering crucial insights for stakeholders across the power, energy, medical, and industrial sectors. With a forecast period extending to 2033, this report leverages data from 2019-2024 (historical period) and includes an estimated view for 2025 (base and estimated year), projecting growth trends up to 2033 (forecast period). The report unveils key market dynamics, competitive landscapes, and lucrative opportunities, empowering informed decision-making for businesses operating in this rapidly evolving sector. The market is valued at $XX million in 2025 and is projected to reach $XX million by 2033, with a Compound Annual Growth Rate (CAGR) of XX%.
Medium Voltage Gate Drivers Market Dynamics & Concentration
This section delves into the competitive dynamics of the medium voltage gate driver market, evaluating concentration levels, innovation trends, regulatory landscapes, and market influences. The global market is moderately concentrated with key players holding significant market share. The top 5 players (Texas Instruments, STMicroelectronics, Infineon Technologies, Onsemi, and NXP Semiconductors) collectively account for approximately 60% of the market share in 2025.
- Market Concentration: A Herfindahl-Hirschman Index (HHI) of XX indicates a moderately concentrated market.
- Innovation Drivers: Miniaturization, higher efficiency, improved thermal management, and integration of smart features are key innovation drivers.
- Regulatory Frameworks: Stringent safety and efficiency standards across various industries significantly impact market growth.
- Product Substitutes: Limited viable substitutes exist, reinforcing market growth.
- End-User Trends: Rising demand for automation, renewable energy, and advanced healthcare solutions fuels market expansion.
- M&A Activities: In the period 2019-2024, approximately xx M&A deals were recorded in this sector, with a focus on expanding product portfolios and geographical reach.
Medium Voltage Gate Drivers Industry Trends & Analysis
This section presents a detailed analysis of prevailing market trends, including growth drivers, technological advancements, and competitive dynamics. The market is experiencing robust growth, driven by increasing demand from various end-use industries.
- The rising adoption of renewable energy sources such as solar and wind power is a major growth driver, with an estimated penetration rate of XX% in 2025.
- The continuous improvement in the efficiency of power electronics and increasing demand for energy-efficient solutions is also driving the market's growth.
- Technological disruptions, such as the development of wide bandgap semiconductors, are significantly enhancing the capabilities of medium voltage gate drivers.
- The industry is witnessing intensified competition, with companies focusing on innovation and cost optimization to maintain their market positions.
- The global CAGR for the period 2025-2033 is projected to be XX%.
Leading Markets & Segments in Medium Voltage Gate Drivers
This section highlights the dominant regions, countries, and segments within the Medium Voltage Gate Drivers market.
Dominant Segments:
- Application: The power industry currently holds the largest market share (approximately 40% in 2025), fueled by the expansion of power grids and the increasing adoption of smart grids.
- Type: Full-bridge gate drivers dominate the market, representing approximately 65% of the market share in 2025, due to their versatility and applicability in diverse industrial applications.
Key Drivers:
- Power Industry: Expansion of power grids, increasing adoption of renewable energy, and stringent environmental regulations are key drivers.
- Energy Industry: Growth in oil and gas extraction, coupled with the rising adoption of energy storage systems, is driving demand.
- Medical Industry: Advancements in medical imaging and diagnostic equipment are fueling market growth.
- Industrial: Automation, industrial robotics, and smart manufacturing initiatives drive demand for these drivers.
Medium Voltage Gate Drivers Product Developments
Recent advancements in Medium Voltage Gate Drivers include the introduction of devices with improved switching speeds, higher efficiency, and enhanced thermal management capabilities. This has led to the development of smaller, more efficient power systems. These improvements are critical for various applications, including power conversion, motor control, and renewable energy systems. Furthermore, integrated gate drivers with protection features are gaining traction, enhancing reliability and safety.
Key Drivers of Medium Voltage Gate Drivers Growth
Several factors are contributing to the growth of the Medium Voltage Gate Drivers market. These include:
- Technological advancements: Improved efficiency, faster switching speeds, and increased integration of functionalities within the drivers.
- Economic growth: Increasing industrialization and infrastructure development in developing economies are bolstering demand.
- Government regulations: Stringent environmental regulations promoting energy efficiency and renewable energy sources.
Challenges in the Medium Voltage Gate Drivers Market
Despite the positive outlook, several challenges hinder market growth:
- Supply chain disruptions: Global supply chain volatility impacts availability and pricing.
- High initial investment costs: The cost of adopting new technologies can be a barrier to entry for some industries.
- Intense competition: Existing players face pressure from new entrants. Price wars and continuous innovation are key aspects of the competitive landscape.
Emerging Opportunities in Medium Voltage Gate Drivers
Significant opportunities exist for growth within the Medium Voltage Gate Drivers market:
- Technological breakthroughs: Wide bandgap semiconductor technology promises improved efficiency and higher operating voltages.
- Strategic partnerships: Collaborations between manufacturers and end-users to develop customized solutions.
- Market expansion: Expansion into emerging markets with rapidly growing industrial and infrastructure sectors.
Leading Players in the Medium Voltage Gate Drivers Sector
Key Milestones in Medium Voltage Gate Drivers Industry
- 2020: Introduction of xx-kV gate driver with integrated protection features by Texas Instruments.
- 2021: STMicroelectronics launched a new line of high-efficiency gate drivers for renewable energy applications.
- 2022: Infineon Technologies acquired a smaller company specializing in SiC based gate drivers.
- 2023: Onsemi released a new generation of high-voltage gate drivers with improved thermal performance.
- 2024: Significant investments in R&D from key players focused on increasing the efficiency of gate drivers.
Strategic Outlook for Medium Voltage Gate Drivers Market
The Medium Voltage Gate Drivers market presents substantial long-term growth potential. Technological advancements, coupled with increasing demand from key industrial segments, are expected to drive market expansion. Strategic partnerships and focused investments in R&D will further enhance competitiveness and accelerate market growth. The focus on energy efficiency and sustainability will continue to be a major driver in this dynamic sector.
Medium Voltage Gate Drivers Segmentation
-
1. Application
- 1.1. Power Industry
- 1.2. Energy Industry
- 1.3. Medical Industry
- 1.4. Industrial
- 1.5. Other
-
2. Type
- 2.1. Half-bridge Gate Drivers
- 2.2. Full Bridge Gate Drivers
Medium Voltage Gate Drivers Segmentation By Geography
-
1. North America
- 1.1. United States
- 1.2. Canada
- 1.3. Mexico
-
2. South America
- 2.1. Brazil
- 2.2. Argentina
- 2.3. Rest of South America
-
3. Europe
- 3.1. United Kingdom
- 3.2. Germany
- 3.3. France
- 3.4. Italy
- 3.5. Spain
- 3.6. Russia
- 3.7. Benelux
- 3.8. Nordics
- 3.9. Rest of Europe
-
4. Middle East & Africa
- 4.1. Turkey
- 4.2. Israel
- 4.3. GCC
- 4.4. North Africa
- 4.5. South Africa
- 4.6. Rest of Middle East & Africa
-
5. Asia Pacific
- 5.1. China
- 5.2. India
- 5.3. Japan
- 5.4. South Korea
- 5.5. ASEAN
- 5.6. Oceania
- 5.7. Rest of Asia Pacific
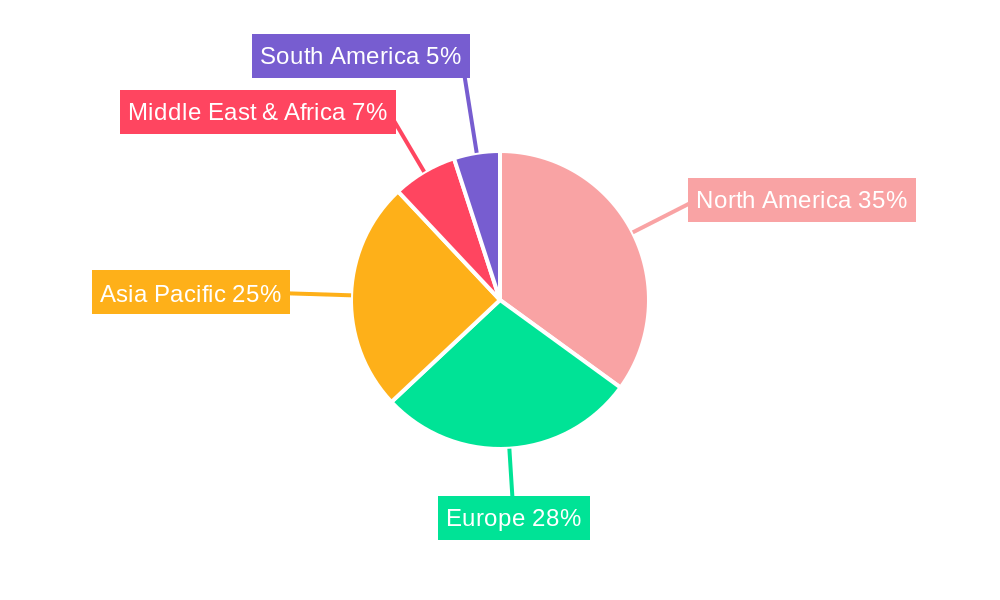
Medium Voltage Gate Drivers Regional Market Share
Geographic Coverage of Medium Voltage Gate Drivers
Medium Voltage Gate Drivers REPORT HIGHLIGHTS
| Aspects | Details |
|---|---|
| Study Period | 2020-2034 |
| Base Year | 2025 |
| Estimated Year | 2026 |
| Forecast Period | 2026-2034 |
| Historical Period | 2020-2025 |
| Growth Rate | CAGR of 5.5% from 2020-2034 |
| Segmentation |
|
Table of Contents
- 1. Introduction
- 1.1. Research Scope
- 1.2. Market Segmentation
- 1.3. Research Methodology
- 1.4. Definitions and Assumptions
- 2. Executive Summary
- 2.1. Introduction
- 3. Market Dynamics
- 3.1. Introduction
- 3.2. Market Drivers
- 3.3. Market Restrains
- 3.4. Market Trends
- 4. Market Factor Analysis
- 4.1. Porters Five Forces
- 4.2. Supply/Value Chain
- 4.3. PESTEL analysis
- 4.4. Market Entropy
- 4.5. Patent/Trademark Analysis
- 5. Global Medium Voltage Gate Drivers Analysis, Insights and Forecast, 2020-2032
- 5.1. Market Analysis, Insights and Forecast - by Application
- 5.1.1. Power Industry
- 5.1.2. Energy Industry
- 5.1.3. Medical Industry
- 5.1.4. Industrial
- 5.1.5. Other
- 5.2. Market Analysis, Insights and Forecast - by Type
- 5.2.1. Half-bridge Gate Drivers
- 5.2.2. Full Bridge Gate Drivers
- 5.3. Market Analysis, Insights and Forecast - by Region
- 5.3.1. North America
- 5.3.2. South America
- 5.3.3. Europe
- 5.3.4. Middle East & Africa
- 5.3.5. Asia Pacific
- 5.1. Market Analysis, Insights and Forecast - by Application
- 6. North America Medium Voltage Gate Drivers Analysis, Insights and Forecast, 2020-2032
- 6.1. Market Analysis, Insights and Forecast - by Application
- 6.1.1. Power Industry
- 6.1.2. Energy Industry
- 6.1.3. Medical Industry
- 6.1.4. Industrial
- 6.1.5. Other
- 6.2. Market Analysis, Insights and Forecast - by Type
- 6.2.1. Half-bridge Gate Drivers
- 6.2.2. Full Bridge Gate Drivers
- 6.1. Market Analysis, Insights and Forecast - by Application
- 7. South America Medium Voltage Gate Drivers Analysis, Insights and Forecast, 2020-2032
- 7.1. Market Analysis, Insights and Forecast - by Application
- 7.1.1. Power Industry
- 7.1.2. Energy Industry
- 7.1.3. Medical Industry
- 7.1.4. Industrial
- 7.1.5. Other
- 7.2. Market Analysis, Insights and Forecast - by Type
- 7.2.1. Half-bridge Gate Drivers
- 7.2.2. Full Bridge Gate Drivers
- 7.1. Market Analysis, Insights and Forecast - by Application
- 8. Europe Medium Voltage Gate Drivers Analysis, Insights and Forecast, 2020-2032
- 8.1. Market Analysis, Insights and Forecast - by Application
- 8.1.1. Power Industry
- 8.1.2. Energy Industry
- 8.1.3. Medical Industry
- 8.1.4. Industrial
- 8.1.5. Other
- 8.2. Market Analysis, Insights and Forecast - by Type
- 8.2.1. Half-bridge Gate Drivers
- 8.2.2. Full Bridge Gate Drivers
- 8.1. Market Analysis, Insights and Forecast - by Application
- 9. Middle East & Africa Medium Voltage Gate Drivers Analysis, Insights and Forecast, 2020-2032
- 9.1. Market Analysis, Insights and Forecast - by Application
- 9.1.1. Power Industry
- 9.1.2. Energy Industry
- 9.1.3. Medical Industry
- 9.1.4. Industrial
- 9.1.5. Other
- 9.2. Market Analysis, Insights and Forecast - by Type
- 9.2.1. Half-bridge Gate Drivers
- 9.2.2. Full Bridge Gate Drivers
- 9.1. Market Analysis, Insights and Forecast - by Application
- 10. Asia Pacific Medium Voltage Gate Drivers Analysis, Insights and Forecast, 2020-2032
- 10.1. Market Analysis, Insights and Forecast - by Application
- 10.1.1. Power Industry
- 10.1.2. Energy Industry
- 10.1.3. Medical Industry
- 10.1.4. Industrial
- 10.1.5. Other
- 10.2. Market Analysis, Insights and Forecast - by Type
- 10.2.1. Half-bridge Gate Drivers
- 10.2.2. Full Bridge Gate Drivers
- 10.1. Market Analysis, Insights and Forecast - by Application
- 11. Competitive Analysis
- 11.1. Global Market Share Analysis 2025
- 11.2. Company Profiles
- 11.2.1 Texas Instruments
- 11.2.1.1. Overview
- 11.2.1.2. Products
- 11.2.1.3. SWOT Analysis
- 11.2.1.4. Recent Developments
- 11.2.1.5. Financials (Based on Availability)
- 11.2.2 STMicroelectronics
- 11.2.2.1. Overview
- 11.2.2.2. Products
- 11.2.2.3. SWOT Analysis
- 11.2.2.4. Recent Developments
- 11.2.2.5. Financials (Based on Availability)
- 11.2.3 Cissoid
- 11.2.3.1. Overview
- 11.2.3.2. Products
- 11.2.3.3. SWOT Analysis
- 11.2.3.4. Recent Developments
- 11.2.3.5. Financials (Based on Availability)
- 11.2.4 Infineon Technologies
- 11.2.4.1. Overview
- 11.2.4.2. Products
- 11.2.4.3. SWOT Analysis
- 11.2.4.4. Recent Developments
- 11.2.4.5. Financials (Based on Availability)
- 11.2.5 Onsemi
- 11.2.5.1. Overview
- 11.2.5.2. Products
- 11.2.5.3. SWOT Analysis
- 11.2.5.4. Recent Developments
- 11.2.5.5. Financials (Based on Availability)
- 11.2.6 NXP Semiconductors
- 11.2.6.1. Overview
- 11.2.6.2. Products
- 11.2.6.3. SWOT Analysis
- 11.2.6.4. Recent Developments
- 11.2.6.5. Financials (Based on Availability)
- 11.2.7 Diodes
- 11.2.7.1. Overview
- 11.2.7.2. Products
- 11.2.7.3. SWOT Analysis
- 11.2.7.4. Recent Developments
- 11.2.7.5. Financials (Based on Availability)
- 11.2.8 Renesas Electronics
- 11.2.8.1. Overview
- 11.2.8.2. Products
- 11.2.8.3. SWOT Analysis
- 11.2.8.4. Recent Developments
- 11.2.8.5. Financials (Based on Availability)
- 11.2.9 HITACHI
- 11.2.9.1. Overview
- 11.2.9.2. Products
- 11.2.9.3. SWOT Analysis
- 11.2.9.4. Recent Developments
- 11.2.9.5. Financials (Based on Availability)
- 11.2.1 Texas Instruments
List of Figures
- Figure 1: Global Medium Voltage Gate Drivers Revenue Breakdown (million, %) by Region 2025 & 2033
- Figure 2: Global Medium Voltage Gate Drivers Volume Breakdown (K, %) by Region 2025 & 2033
- Figure 3: North America Medium Voltage Gate Drivers Revenue (million), by Application 2025 & 2033
- Figure 4: North America Medium Voltage Gate Drivers Volume (K), by Application 2025 & 2033
- Figure 5: North America Medium Voltage Gate Drivers Revenue Share (%), by Application 2025 & 2033
- Figure 6: North America Medium Voltage Gate Drivers Volume Share (%), by Application 2025 & 2033
- Figure 7: North America Medium Voltage Gate Drivers Revenue (million), by Type 2025 & 2033
- Figure 8: North America Medium Voltage Gate Drivers Volume (K), by Type 2025 & 2033
- Figure 9: North America Medium Voltage Gate Drivers Revenue Share (%), by Type 2025 & 2033
- Figure 10: North America Medium Voltage Gate Drivers Volume Share (%), by Type 2025 & 2033
- Figure 11: North America Medium Voltage Gate Drivers Revenue (million), by Country 2025 & 2033
- Figure 12: North America Medium Voltage Gate Drivers Volume (K), by Country 2025 & 2033
- Figure 13: North America Medium Voltage Gate Drivers Revenue Share (%), by Country 2025 & 2033
- Figure 14: North America Medium Voltage Gate Drivers Volume Share (%), by Country 2025 & 2033
- Figure 15: South America Medium Voltage Gate Drivers Revenue (million), by Application 2025 & 2033
- Figure 16: South America Medium Voltage Gate Drivers Volume (K), by Application 2025 & 2033
- Figure 17: South America Medium Voltage Gate Drivers Revenue Share (%), by Application 2025 & 2033
- Figure 18: South America Medium Voltage Gate Drivers Volume Share (%), by Application 2025 & 2033
- Figure 19: South America Medium Voltage Gate Drivers Revenue (million), by Type 2025 & 2033
- Figure 20: South America Medium Voltage Gate Drivers Volume (K), by Type 2025 & 2033
- Figure 21: South America Medium Voltage Gate Drivers Revenue Share (%), by Type 2025 & 2033
- Figure 22: South America Medium Voltage Gate Drivers Volume Share (%), by Type 2025 & 2033
- Figure 23: South America Medium Voltage Gate Drivers Revenue (million), by Country 2025 & 2033
- Figure 24: South America Medium Voltage Gate Drivers Volume (K), by Country 2025 & 2033
- Figure 25: South America Medium Voltage Gate Drivers Revenue Share (%), by Country 2025 & 2033
- Figure 26: South America Medium Voltage Gate Drivers Volume Share (%), by Country 2025 & 2033
- Figure 27: Europe Medium Voltage Gate Drivers Revenue (million), by Application 2025 & 2033
- Figure 28: Europe Medium Voltage Gate Drivers Volume (K), by Application 2025 & 2033
- Figure 29: Europe Medium Voltage Gate Drivers Revenue Share (%), by Application 2025 & 2033
- Figure 30: Europe Medium Voltage Gate Drivers Volume Share (%), by Application 2025 & 2033
- Figure 31: Europe Medium Voltage Gate Drivers Revenue (million), by Type 2025 & 2033
- Figure 32: Europe Medium Voltage Gate Drivers Volume (K), by Type 2025 & 2033
- Figure 33: Europe Medium Voltage Gate Drivers Revenue Share (%), by Type 2025 & 2033
- Figure 34: Europe Medium Voltage Gate Drivers Volume Share (%), by Type 2025 & 2033
- Figure 35: Europe Medium Voltage Gate Drivers Revenue (million), by Country 2025 & 2033
- Figure 36: Europe Medium Voltage Gate Drivers Volume (K), by Country 2025 & 2033
- Figure 37: Europe Medium Voltage Gate Drivers Revenue Share (%), by Country 2025 & 2033
- Figure 38: Europe Medium Voltage Gate Drivers Volume Share (%), by Country 2025 & 2033
- Figure 39: Middle East & Africa Medium Voltage Gate Drivers Revenue (million), by Application 2025 & 2033
- Figure 40: Middle East & Africa Medium Voltage Gate Drivers Volume (K), by Application 2025 & 2033
- Figure 41: Middle East & Africa Medium Voltage Gate Drivers Revenue Share (%), by Application 2025 & 2033
- Figure 42: Middle East & Africa Medium Voltage Gate Drivers Volume Share (%), by Application 2025 & 2033
- Figure 43: Middle East & Africa Medium Voltage Gate Drivers Revenue (million), by Type 2025 & 2033
- Figure 44: Middle East & Africa Medium Voltage Gate Drivers Volume (K), by Type 2025 & 2033
- Figure 45: Middle East & Africa Medium Voltage Gate Drivers Revenue Share (%), by Type 2025 & 2033
- Figure 46: Middle East & Africa Medium Voltage Gate Drivers Volume Share (%), by Type 2025 & 2033
- Figure 47: Middle East & Africa Medium Voltage Gate Drivers Revenue (million), by Country 2025 & 2033
- Figure 48: Middle East & Africa Medium Voltage Gate Drivers Volume (K), by Country 2025 & 2033
- Figure 49: Middle East & Africa Medium Voltage Gate Drivers Revenue Share (%), by Country 2025 & 2033
- Figure 50: Middle East & Africa Medium Voltage Gate Drivers Volume Share (%), by Country 2025 & 2033
- Figure 51: Asia Pacific Medium Voltage Gate Drivers Revenue (million), by Application 2025 & 2033
- Figure 52: Asia Pacific Medium Voltage Gate Drivers Volume (K), by Application 2025 & 2033
- Figure 53: Asia Pacific Medium Voltage Gate Drivers Revenue Share (%), by Application 2025 & 2033
- Figure 54: Asia Pacific Medium Voltage Gate Drivers Volume Share (%), by Application 2025 & 2033
- Figure 55: Asia Pacific Medium Voltage Gate Drivers Revenue (million), by Type 2025 & 2033
- Figure 56: Asia Pacific Medium Voltage Gate Drivers Volume (K), by Type 2025 & 2033
- Figure 57: Asia Pacific Medium Voltage Gate Drivers Revenue Share (%), by Type 2025 & 2033
- Figure 58: Asia Pacific Medium Voltage Gate Drivers Volume Share (%), by Type 2025 & 2033
- Figure 59: Asia Pacific Medium Voltage Gate Drivers Revenue (million), by Country 2025 & 2033
- Figure 60: Asia Pacific Medium Voltage Gate Drivers Volume (K), by Country 2025 & 2033
- Figure 61: Asia Pacific Medium Voltage Gate Drivers Revenue Share (%), by Country 2025 & 2033
- Figure 62: Asia Pacific Medium Voltage Gate Drivers Volume Share (%), by Country 2025 & 2033
List of Tables
- Table 1: Global Medium Voltage Gate Drivers Revenue million Forecast, by Application 2020 & 2033
- Table 2: Global Medium Voltage Gate Drivers Volume K Forecast, by Application 2020 & 2033
- Table 3: Global Medium Voltage Gate Drivers Revenue million Forecast, by Type 2020 & 2033
- Table 4: Global Medium Voltage Gate Drivers Volume K Forecast, by Type 2020 & 2033
- Table 5: Global Medium Voltage Gate Drivers Revenue million Forecast, by Region 2020 & 2033
- Table 6: Global Medium Voltage Gate Drivers Volume K Forecast, by Region 2020 & 2033
- Table 7: Global Medium Voltage Gate Drivers Revenue million Forecast, by Application 2020 & 2033
- Table 8: Global Medium Voltage Gate Drivers Volume K Forecast, by Application 2020 & 2033
- Table 9: Global Medium Voltage Gate Drivers Revenue million Forecast, by Type 2020 & 2033
- Table 10: Global Medium Voltage Gate Drivers Volume K Forecast, by Type 2020 & 2033
- Table 11: Global Medium Voltage Gate Drivers Revenue million Forecast, by Country 2020 & 2033
- Table 12: Global Medium Voltage Gate Drivers Volume K Forecast, by Country 2020 & 2033
- Table 13: United States Medium Voltage Gate Drivers Revenue (million) Forecast, by Application 2020 & 2033
- Table 14: United States Medium Voltage Gate Drivers Volume (K) Forecast, by Application 2020 & 2033
- Table 15: Canada Medium Voltage Gate Drivers Revenue (million) Forecast, by Application 2020 & 2033
- Table 16: Canada Medium Voltage Gate Drivers Volume (K) Forecast, by Application 2020 & 2033
- Table 17: Mexico Medium Voltage Gate Drivers Revenue (million) Forecast, by Application 2020 & 2033
- Table 18: Mexico Medium Voltage Gate Drivers Volume (K) Forecast, by Application 2020 & 2033
- Table 19: Global Medium Voltage Gate Drivers Revenue million Forecast, by Application 2020 & 2033
- Table 20: Global Medium Voltage Gate Drivers Volume K Forecast, by Application 2020 & 2033
- Table 21: Global Medium Voltage Gate Drivers Revenue million Forecast, by Type 2020 & 2033
- Table 22: Global Medium Voltage Gate Drivers Volume K Forecast, by Type 2020 & 2033
- Table 23: Global Medium Voltage Gate Drivers Revenue million Forecast, by Country 2020 & 2033
- Table 24: Global Medium Voltage Gate Drivers Volume K Forecast, by Country 2020 & 2033
- Table 25: Brazil Medium Voltage Gate Drivers Revenue (million) Forecast, by Application 2020 & 2033
- Table 26: Brazil Medium Voltage Gate Drivers Volume (K) Forecast, by Application 2020 & 2033
- Table 27: Argentina Medium Voltage Gate Drivers Revenue (million) Forecast, by Application 2020 & 2033
- Table 28: Argentina Medium Voltage Gate Drivers Volume (K) Forecast, by Application 2020 & 2033
- Table 29: Rest of South America Medium Voltage Gate Drivers Revenue (million) Forecast, by Application 2020 & 2033
- Table 30: Rest of South America Medium Voltage Gate Drivers Volume (K) Forecast, by Application 2020 & 2033
- Table 31: Global Medium Voltage Gate Drivers Revenue million Forecast, by Application 2020 & 2033
- Table 32: Global Medium Voltage Gate Drivers Volume K Forecast, by Application 2020 & 2033
- Table 33: Global Medium Voltage Gate Drivers Revenue million Forecast, by Type 2020 & 2033
- Table 34: Global Medium Voltage Gate Drivers Volume K Forecast, by Type 2020 & 2033
- Table 35: Global Medium Voltage Gate Drivers Revenue million Forecast, by Country 2020 & 2033
- Table 36: Global Medium Voltage Gate Drivers Volume K Forecast, by Country 2020 & 2033
- Table 37: United Kingdom Medium Voltage Gate Drivers Revenue (million) Forecast, by Application 2020 & 2033
- Table 38: United Kingdom Medium Voltage Gate Drivers Volume (K) Forecast, by Application 2020 & 2033
- Table 39: Germany Medium Voltage Gate Drivers Revenue (million) Forecast, by Application 2020 & 2033
- Table 40: Germany Medium Voltage Gate Drivers Volume (K) Forecast, by Application 2020 & 2033
- Table 41: France Medium Voltage Gate Drivers Revenue (million) Forecast, by Application 2020 & 2033
- Table 42: France Medium Voltage Gate Drivers Volume (K) Forecast, by Application 2020 & 2033
- Table 43: Italy Medium Voltage Gate Drivers Revenue (million) Forecast, by Application 2020 & 2033
- Table 44: Italy Medium Voltage Gate Drivers Volume (K) Forecast, by Application 2020 & 2033
- Table 45: Spain Medium Voltage Gate Drivers Revenue (million) Forecast, by Application 2020 & 2033
- Table 46: Spain Medium Voltage Gate Drivers Volume (K) Forecast, by Application 2020 & 2033
- Table 47: Russia Medium Voltage Gate Drivers Revenue (million) Forecast, by Application 2020 & 2033
- Table 48: Russia Medium Voltage Gate Drivers Volume (K) Forecast, by Application 2020 & 2033
- Table 49: Benelux Medium Voltage Gate Drivers Revenue (million) Forecast, by Application 2020 & 2033
- Table 50: Benelux Medium Voltage Gate Drivers Volume (K) Forecast, by Application 2020 & 2033
- Table 51: Nordics Medium Voltage Gate Drivers Revenue (million) Forecast, by Application 2020 & 2033
- Table 52: Nordics Medium Voltage Gate Drivers Volume (K) Forecast, by Application 2020 & 2033
- Table 53: Rest of Europe Medium Voltage Gate Drivers Revenue (million) Forecast, by Application 2020 & 2033
- Table 54: Rest of Europe Medium Voltage Gate Drivers Volume (K) Forecast, by Application 2020 & 2033
- Table 55: Global Medium Voltage Gate Drivers Revenue million Forecast, by Application 2020 & 2033
- Table 56: Global Medium Voltage Gate Drivers Volume K Forecast, by Application 2020 & 2033
- Table 57: Global Medium Voltage Gate Drivers Revenue million Forecast, by Type 2020 & 2033
- Table 58: Global Medium Voltage Gate Drivers Volume K Forecast, by Type 2020 & 2033
- Table 59: Global Medium Voltage Gate Drivers Revenue million Forecast, by Country 2020 & 2033
- Table 60: Global Medium Voltage Gate Drivers Volume K Forecast, by Country 2020 & 2033
- Table 61: Turkey Medium Voltage Gate Drivers Revenue (million) Forecast, by Application 2020 & 2033
- Table 62: Turkey Medium Voltage Gate Drivers Volume (K) Forecast, by Application 2020 & 2033
- Table 63: Israel Medium Voltage Gate Drivers Revenue (million) Forecast, by Application 2020 & 2033
- Table 64: Israel Medium Voltage Gate Drivers Volume (K) Forecast, by Application 2020 & 2033
- Table 65: GCC Medium Voltage Gate Drivers Revenue (million) Forecast, by Application 2020 & 2033
- Table 66: GCC Medium Voltage Gate Drivers Volume (K) Forecast, by Application 2020 & 2033
- Table 67: North Africa Medium Voltage Gate Drivers Revenue (million) Forecast, by Application 2020 & 2033
- Table 68: North Africa Medium Voltage Gate Drivers Volume (K) Forecast, by Application 2020 & 2033
- Table 69: South Africa Medium Voltage Gate Drivers Revenue (million) Forecast, by Application 2020 & 2033
- Table 70: South Africa Medium Voltage Gate Drivers Volume (K) Forecast, by Application 2020 & 2033
- Table 71: Rest of Middle East & Africa Medium Voltage Gate Drivers Revenue (million) Forecast, by Application 2020 & 2033
- Table 72: Rest of Middle East & Africa Medium Voltage Gate Drivers Volume (K) Forecast, by Application 2020 & 2033
- Table 73: Global Medium Voltage Gate Drivers Revenue million Forecast, by Application 2020 & 2033
- Table 74: Global Medium Voltage Gate Drivers Volume K Forecast, by Application 2020 & 2033
- Table 75: Global Medium Voltage Gate Drivers Revenue million Forecast, by Type 2020 & 2033
- Table 76: Global Medium Voltage Gate Drivers Volume K Forecast, by Type 2020 & 2033
- Table 77: Global Medium Voltage Gate Drivers Revenue million Forecast, by Country 2020 & 2033
- Table 78: Global Medium Voltage Gate Drivers Volume K Forecast, by Country 2020 & 2033
- Table 79: China Medium Voltage Gate Drivers Revenue (million) Forecast, by Application 2020 & 2033
- Table 80: China Medium Voltage Gate Drivers Volume (K) Forecast, by Application 2020 & 2033
- Table 81: India Medium Voltage Gate Drivers Revenue (million) Forecast, by Application 2020 & 2033
- Table 82: India Medium Voltage Gate Drivers Volume (K) Forecast, by Application 2020 & 2033
- Table 83: Japan Medium Voltage Gate Drivers Revenue (million) Forecast, by Application 2020 & 2033
- Table 84: Japan Medium Voltage Gate Drivers Volume (K) Forecast, by Application 2020 & 2033
- Table 85: South Korea Medium Voltage Gate Drivers Revenue (million) Forecast, by Application 2020 & 2033
- Table 86: South Korea Medium Voltage Gate Drivers Volume (K) Forecast, by Application 2020 & 2033
- Table 87: ASEAN Medium Voltage Gate Drivers Revenue (million) Forecast, by Application 2020 & 2033
- Table 88: ASEAN Medium Voltage Gate Drivers Volume (K) Forecast, by Application 2020 & 2033
- Table 89: Oceania Medium Voltage Gate Drivers Revenue (million) Forecast, by Application 2020 & 2033
- Table 90: Oceania Medium Voltage Gate Drivers Volume (K) Forecast, by Application 2020 & 2033
- Table 91: Rest of Asia Pacific Medium Voltage Gate Drivers Revenue (million) Forecast, by Application 2020 & 2033
- Table 92: Rest of Asia Pacific Medium Voltage Gate Drivers Volume (K) Forecast, by Application 2020 & 2033
Frequently Asked Questions
1. What is the projected Compound Annual Growth Rate (CAGR) of the Medium Voltage Gate Drivers?
The projected CAGR is approximately 5.5%.
2. Which companies are prominent players in the Medium Voltage Gate Drivers?
Key companies in the market include Texas Instruments, STMicroelectronics, Cissoid, Infineon Technologies, Onsemi, NXP Semiconductors, Diodes, Renesas Electronics, HITACHI.
3. What are the main segments of the Medium Voltage Gate Drivers?
The market segments include Application, Type.
4. Can you provide details about the market size?
The market size is estimated to be USD 2734 million as of 2022.
5. What are some drivers contributing to market growth?
N/A
6. What are the notable trends driving market growth?
N/A
7. Are there any restraints impacting market growth?
N/A
8. Can you provide examples of recent developments in the market?
N/A
9. What pricing options are available for accessing the report?
Pricing options include single-user, multi-user, and enterprise licenses priced at USD 3950.00, USD 5925.00, and USD 7900.00 respectively.
10. Is the market size provided in terms of value or volume?
The market size is provided in terms of value, measured in million and volume, measured in K.
11. Are there any specific market keywords associated with the report?
Yes, the market keyword associated with the report is "Medium Voltage Gate Drivers," which aids in identifying and referencing the specific market segment covered.
12. How do I determine which pricing option suits my needs best?
The pricing options vary based on user requirements and access needs. Individual users may opt for single-user licenses, while businesses requiring broader access may choose multi-user or enterprise licenses for cost-effective access to the report.
13. Are there any additional resources or data provided in the Medium Voltage Gate Drivers report?
While the report offers comprehensive insights, it's advisable to review the specific contents or supplementary materials provided to ascertain if additional resources or data are available.
14. How can I stay updated on further developments or reports in the Medium Voltage Gate Drivers?
To stay informed about further developments, trends, and reports in the Medium Voltage Gate Drivers, consider subscribing to industry newsletters, following relevant companies and organizations, or regularly checking reputable industry news sources and publications.
Methodology
Step 1 - Identification of Relevant Samples Size from Population Database


Step 2 - Approaches for Defining Global Market Size (Value, Volume* & Price*)

Note*: In applicable scenarios
Step 3 - Data Sources
Primary Research
- Web Analytics
- Survey Reports
- Research Institute
- Latest Research Reports
- Opinion Leaders
Secondary Research
- Annual Reports
- White Paper
- Latest Press Release
- Industry Association
- Paid Database
- Investor Presentations

Step 4 - Data Triangulation
Involves using different sources of information in order to increase the validity of a study
These sources are likely to be stakeholders in a program - participants, other researchers, program staff, other community members, and so on.
Then we put all data in single framework & apply various statistical tools to find out the dynamic on the market.
During the analysis stage, feedback from the stakeholder groups would be compared to determine areas of agreement as well as areas of divergence