

Key Insights
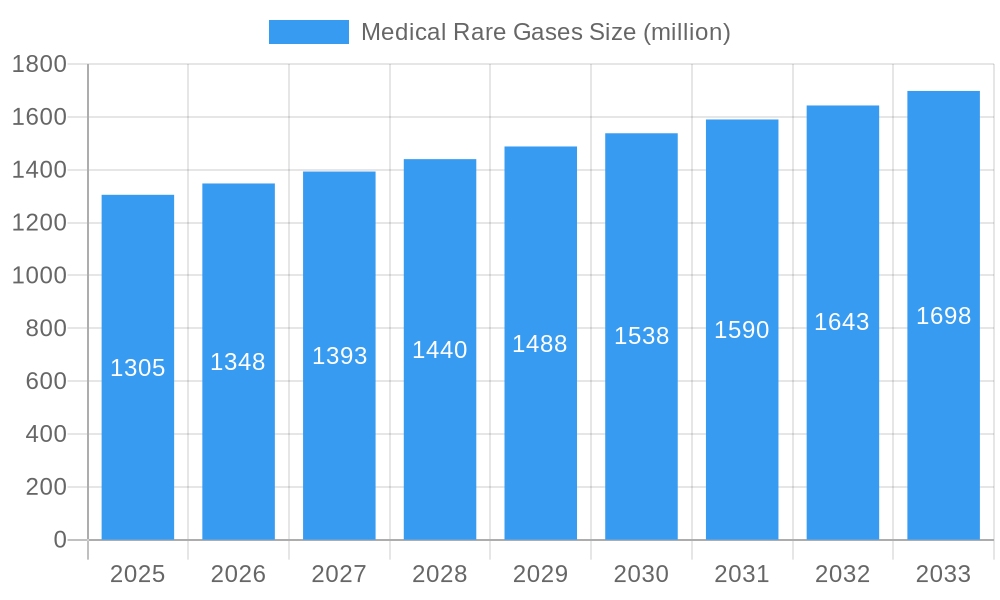
The medical rare gases market, currently valued at $1.305 billion in 2025, is projected to experience steady growth, with a Compound Annual Growth Rate (CAGR) of 3.4% from 2025 to 2033. This growth is driven by several key factors. The increasing prevalence of chronic respiratory diseases necessitates wider use of medical gases like helium and xenon for diagnostic and therapeutic applications such as MRI and lung function tests. Advancements in medical technology, particularly in respiratory care and minimally invasive surgeries, are fueling demand for high-purity rare gases. Furthermore, the rising geriatric population, susceptible to respiratory illnesses, further boosts market expansion. Stringent regulatory frameworks and safety standards within the healthcare sector ensure quality and safety, contributing to the market's stability. However, price volatility of raw materials and potential supply chain disruptions pose challenges to consistent growth. The market is segmented based on gas type (Helium, Xenon, Argon, Krypton, Neon, Radon), application (Anesthesia, Respiratory Care, Medical Imaging), and end-user (Hospitals, Clinics, Diagnostic Centers). Leading companies like Air Liquide, Air Products, and Linde Healthcare dominate the market landscape, leveraging their extensive distribution networks and technological expertise. Geographical expansion into emerging economies with growing healthcare infrastructure is expected to open new avenues for market growth in the coming years.
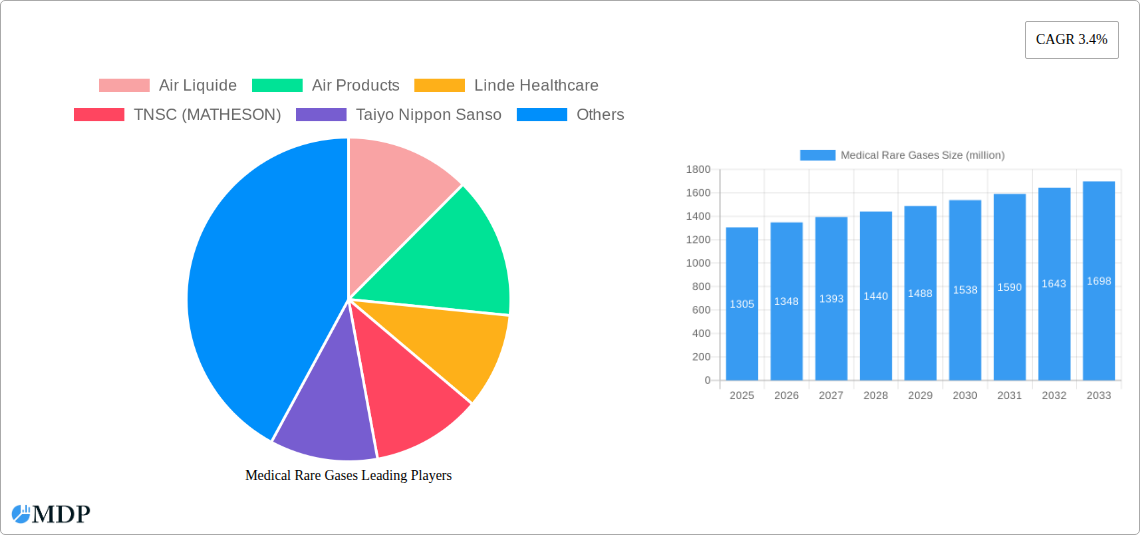
Medical Rare Gases Market Size (In Billion)
The competitive landscape is characterized by both large multinational corporations and regional players. Strategic partnerships, mergers, and acquisitions are prevalent strategies to enhance market share and product portfolios. Technological innovations focus on improving the purity, efficiency, and delivery systems of medical rare gases. Future growth will hinge on factors such as technological innovation in gas delivery systems, development of novel applications in medical imaging and therapeutics, and expansion into underserved markets. The market faces challenges related to the sustainable sourcing of rare gases and the need for ongoing investment in research and development to meet evolving healthcare needs and regulatory requirements. Overall, the market presents a promising investment opportunity with consistent growth anticipated throughout the forecast period.
Medical Rare Gases Company Market Share
Medical Rare Gases Market Report: 2019-2033 Forecast
Dive deep into the burgeoning Medical Rare Gases market with this comprehensive report, projecting a market value exceeding $XX million by 2033. This in-depth analysis provides actionable insights for industry stakeholders, investors, and businesses seeking to capitalize on the significant growth opportunities within this specialized sector. The report covers the period 2019-2033, with a focus on the 2025-2033 forecast period. Benefit from our meticulous research incorporating historical data (2019-2024), current market dynamics (Base Year: 2025), and future projections (Estimated Year: 2025).
Medical Rare Gases Market Dynamics & Concentration
This section analyzes the competitive landscape of the medical rare gases market, exploring market concentration, innovation drivers, regulatory frameworks, product substitutes, end-user trends, and M&A activities. The global market is moderately concentrated, with key players like Air Liquide, Air Products, Linde Healthcare, TNSC (Matheson), Taiyo Nippon Sanso, AMCS Corporation, and Jinhong Group holding significant market share.
- Market Concentration: The market exhibits a moderately consolidated structure, with the top 5 players accounting for approximately XX% of the global market share in 2025. This concentration is expected to slightly increase by 2033 due to ongoing mergers and acquisitions.
- Innovation Drivers: Continuous advancements in medical technologies, particularly in cryogenic procedures and medical imaging, are fueling demand for high-purity rare gases.
- Regulatory Frameworks: Stringent regulations concerning the purity and safety of medical gases significantly impact market dynamics. Compliance costs and regulatory approvals can present challenges for market entrants.
- Product Substitutes: Limited viable substitutes exist for rare gases in many medical applications, making the market relatively resilient to substitution pressure. However, technological advancements may lead to the exploration of alternative solutions in the future.
- End-User Trends: Growing adoption of minimally invasive surgical procedures and increasing demand for advanced medical imaging are driving market growth.
- M&A Activities: Over the historical period (2019-2024), approximately XX M&A deals involving medical rare gas companies were recorded, primarily driven by companies aiming to expand their product portfolio and geographical reach.
Medical Rare Gases Industry Trends & Analysis
This section provides a detailed analysis of the key industry trends influencing the medical rare gases market. The market exhibits a robust Compound Annual Growth Rate (CAGR) of XX% during the forecast period (2025-2033), driven by factors such as increasing demand from healthcare facilities, technological advancements, and favorable regulatory policies. Market penetration of medical rare gases in developing economies is steadily increasing, further contributing to the market's robust growth trajectory. Technological advancements, such as improved purification techniques and the development of more efficient delivery systems, are enhancing the quality and efficiency of medical rare gas applications. Competitive dynamics are shaping the market, with leading companies focusing on product differentiation, strategic partnerships, and geographic expansion to maintain a competitive edge.
Leading Markets & Segments in Medical Rare Gases
The North American market holds the dominant position in the global medical rare gases market, accounting for approximately XX% of the global market share in 2025. This dominance is largely attributed to the high adoption of advanced medical technologies, robust healthcare infrastructure, and significant investment in research and development.
Key Drivers for North American Market Dominance:
- Advanced Healthcare Infrastructure: Extensive network of hospitals, clinics, and research institutions.
- High Healthcare Expenditure: High per capita spending on healthcare services.
- Favorable Regulatory Environment: Supportive regulations promoting innovation and adoption of new medical technologies.
- Strong R&D Investment: Significant investments in research and development of new medical applications for rare gases.
Other regions, such as Europe and Asia-Pacific, are experiencing substantial growth, fueled by increasing healthcare awareness, rising disposable incomes, and government initiatives promoting healthcare infrastructure development.
Medical Rare Gases Product Developments
Recent advancements in medical rare gas technology have focused on improving gas purity, developing more efficient delivery systems, and expanding applications into new medical areas. These developments have resulted in enhanced patient outcomes, reduced treatment times, and increased overall efficiency in healthcare settings. The ongoing focus on improving the safety and efficacy of medical rare gas applications is driving the development of innovative products and technologies that better meet the evolving needs of the healthcare industry.
Key Drivers of Medical Rare Gases Growth
The growth of the medical rare gases market is propelled by several key factors. The increasing prevalence of chronic diseases necessitates advanced medical treatments, boosting the demand for rare gases in various applications. Technological advancements leading to enhanced purity, efficient delivery systems, and broader applications further contribute to growth. Favorable regulatory frameworks in several countries streamline market entry and adoption, while government initiatives promoting healthcare infrastructure development fuel the expansion.
Challenges in the Medical Rare Gases Market
The medical rare gases market faces several challenges, including stringent regulatory requirements, which can increase compliance costs and time-to-market. Supply chain complexities, particularly regarding the sourcing of raw materials, can lead to supply disruptions and price volatility. Furthermore, intense competition among established players and potential new entrants exerts pressure on pricing and profitability. These factors can collectively impact market growth.
Emerging Opportunities in Medical Rare Gases
Significant growth opportunities exist in the medical rare gases market. Advancements in cryogenic technologies and medical imaging are paving the way for innovative applications. Strategic collaborations among industry players to leverage technological expertise and expand market reach represent a considerable opportunity. Market expansion into developing economies, where healthcare infrastructure is improving, presents a substantial growth potential in the years to come.
Leading Players in the Medical Rare Gases Sector
- Air Liquide
- Air Products
- Linde Healthcare
- TNSC (MATHESON)
- Taiyo Nippon Sanso
- AMCS Corporation
- Jinhong Group
Key Milestones in Medical Rare Gases Industry
- 2020: Air Liquide launches a new high-purity helium delivery system for MRI applications.
- 2021: Linde Healthcare announces a significant investment in expanding its medical rare gas production capacity.
- 2022: A major merger between two smaller medical rare gas companies consolidates market share.
- 2023: New regulatory guidelines for medical grade rare gases are implemented in several key markets.
- 2024: Taiyo Nippon Sanso introduces a new cryogenic system for improved efficiency in medical procedures.
Strategic Outlook for Medical Rare Gases Market
The future of the medical rare gases market appears extremely promising. Continuous technological innovations, coupled with the growing demand for advanced healthcare solutions, will propel market growth. Strategic partnerships, geographical expansion, and a focus on product differentiation will be crucial for companies seeking to capitalize on the substantial market potential. The market is expected to witness strong growth throughout the forecast period, driven by favorable industry trends and technological advancements.
Medical Rare Gases Segmentation
-
1. Application
- 1.1. Hospitals and Clinics
- 1.2. Home Healthcare
- 1.3. Pharmaceutical and Biotechnology Industries
- 1.4. Others
-
2. Types
- 2.1. Neon
- 2.2. Krypton
- 2.3. Xenon
- 2.4. Others
Medical Rare Gases Segmentation By Geography
-
1. North America
- 1.1. United States
- 1.2. Canada
- 1.3. Mexico
-
2. South America
- 2.1. Brazil
- 2.2. Argentina
- 2.3. Rest of South America
-
3. Europe
- 3.1. United Kingdom
- 3.2. Germany
- 3.3. France
- 3.4. Italy
- 3.5. Spain
- 3.6. Russia
- 3.7. Benelux
- 3.8. Nordics
- 3.9. Rest of Europe
-
4. Middle East & Africa
- 4.1. Turkey
- 4.2. Israel
- 4.3. GCC
- 4.4. North Africa
- 4.5. South Africa
- 4.6. Rest of Middle East & Africa
-
5. Asia Pacific
- 5.1. China
- 5.2. India
- 5.3. Japan
- 5.4. South Korea
- 5.5. ASEAN
- 5.6. Oceania
- 5.7. Rest of Asia Pacific

Medical Rare Gases Regional Market Share
Geographic Coverage of Medical Rare Gases
Medical Rare Gases REPORT HIGHLIGHTS
| Aspects | Details |
|---|---|
| Study Period | 2020-2034 |
| Base Year | 2025 |
| Estimated Year | 2026 |
| Forecast Period | 2026-2034 |
| Historical Period | 2020-2025 |
| Growth Rate | CAGR of 3.4% from 2020-2034 |
| Segmentation |
|
Table of Contents
- 1. Introduction
- 1.1. Research Scope
- 1.2. Market Segmentation
- 1.3. Research Objective
- 1.4. Definitions and Assumptions
- 2. Executive Summary
- 2.1. Market Snapshot
- 3. Market Dynamics
- 3.1. Market Drivers
- 3.2. Market Restrains
- 3.3. Market Trends
- 3.4. Market Opportunities
- 4. Market Factor Analysis
- 4.1. Porters Five Forces
- 4.1.1. Bargaining Power of Suppliers
- 4.1.2. Bargaining Power of Buyers
- 4.1.3. Threat of New Entrants
- 4.1.4. Threat of Substitutes
- 4.1.5. Competitive Rivalry
- 4.2. PESTEL analysis
- 4.3. BCG Analysis
- 4.3.1. Stars (High Growth, High Market Share)
- 4.3.2. Cash Cows (Low Growth, High Market Share)
- 4.3.3. Question Mark (High Growth, Low Market Share)
- 4.3.4. Dogs (Low Growth, Low Market Share)
- 4.4. Ansoff Matrix Analysis
- 4.5. Supply Chain Analysis
- 4.6. Regulatory Landscape
- 4.7. Current Market Potential and Opportunity Assessment (TAM–SAM–SOM Framework)
- 4.8. MDP Analyst Note
- 4.1. Porters Five Forces
- 5. Market Analysis, Insights and Forecast 2021-2033
- 5.1. Market Analysis, Insights and Forecast - by Application
- 5.1.1. Hospitals and Clinics
- 5.1.2. Home Healthcare
- 5.1.3. Pharmaceutical and Biotechnology Industries
- 5.1.4. Others
- 5.2. Market Analysis, Insights and Forecast - by Types
- 5.2.1. Neon
- 5.2.2. Krypton
- 5.2.3. Xenon
- 5.2.4. Others
- 5.3. Market Analysis, Insights and Forecast - by Region
- 5.3.1. North America
- 5.3.2. South America
- 5.3.3. Europe
- 5.3.4. Middle East & Africa
- 5.3.5. Asia Pacific
- 5.1. Market Analysis, Insights and Forecast - by Application
- 6. Global Medical Rare Gases Analysis, Insights and Forecast, 2021-2033
- 6.1. Market Analysis, Insights and Forecast - by Application
- 6.1.1. Hospitals and Clinics
- 6.1.2. Home Healthcare
- 6.1.3. Pharmaceutical and Biotechnology Industries
- 6.1.4. Others
- 6.2. Market Analysis, Insights and Forecast - by Types
- 6.2.1. Neon
- 6.2.2. Krypton
- 6.2.3. Xenon
- 6.2.4. Others
- 6.1. Market Analysis, Insights and Forecast - by Application
- 7. North America Medical Rare Gases Analysis, Insights and Forecast, 2020-2032
- 7.1. Market Analysis, Insights and Forecast - by Application
- 7.1.1. Hospitals and Clinics
- 7.1.2. Home Healthcare
- 7.1.3. Pharmaceutical and Biotechnology Industries
- 7.1.4. Others
- 7.2. Market Analysis, Insights and Forecast - by Types
- 7.2.1. Neon
- 7.2.2. Krypton
- 7.2.3. Xenon
- 7.2.4. Others
- 7.1. Market Analysis, Insights and Forecast - by Application
- 8. South America Medical Rare Gases Analysis, Insights and Forecast, 2020-2032
- 8.1. Market Analysis, Insights and Forecast - by Application
- 8.1.1. Hospitals and Clinics
- 8.1.2. Home Healthcare
- 8.1.3. Pharmaceutical and Biotechnology Industries
- 8.1.4. Others
- 8.2. Market Analysis, Insights and Forecast - by Types
- 8.2.1. Neon
- 8.2.2. Krypton
- 8.2.3. Xenon
- 8.2.4. Others
- 8.1. Market Analysis, Insights and Forecast - by Application
- 9. Europe Medical Rare Gases Analysis, Insights and Forecast, 2020-2032
- 9.1. Market Analysis, Insights and Forecast - by Application
- 9.1.1. Hospitals and Clinics
- 9.1.2. Home Healthcare
- 9.1.3. Pharmaceutical and Biotechnology Industries
- 9.1.4. Others
- 9.2. Market Analysis, Insights and Forecast - by Types
- 9.2.1. Neon
- 9.2.2. Krypton
- 9.2.3. Xenon
- 9.2.4. Others
- 9.1. Market Analysis, Insights and Forecast - by Application
- 10. Middle East & Africa Medical Rare Gases Analysis, Insights and Forecast, 2020-2032
- 10.1. Market Analysis, Insights and Forecast - by Application
- 10.1.1. Hospitals and Clinics
- 10.1.2. Home Healthcare
- 10.1.3. Pharmaceutical and Biotechnology Industries
- 10.1.4. Others
- 10.2. Market Analysis, Insights and Forecast - by Types
- 10.2.1. Neon
- 10.2.2. Krypton
- 10.2.3. Xenon
- 10.2.4. Others
- 10.1. Market Analysis, Insights and Forecast - by Application
- 11. Asia Pacific Medical Rare Gases Analysis, Insights and Forecast, 2020-2032
- 11.1. Market Analysis, Insights and Forecast - by Application
- 11.1.1. Hospitals and Clinics
- 11.1.2. Home Healthcare
- 11.1.3. Pharmaceutical and Biotechnology Industries
- 11.1.4. Others
- 11.2. Market Analysis, Insights and Forecast - by Types
- 11.2.1. Neon
- 11.2.2. Krypton
- 11.2.3. Xenon
- 11.2.4. Others
- 11.1. Market Analysis, Insights and Forecast - by Application
- 12. Competitive Analysis
- 12.1. Company Profiles
- 12.1.1 Air Liquide
- 12.1.1.1. Company Overview
- 12.1.1.2. Products
- 12.1.1.3. Company Financials
- 12.1.1.4. SWOT Analysis
- 12.1.2 Air Products
- 12.1.2.1. Company Overview
- 12.1.2.2. Products
- 12.1.2.3. Company Financials
- 12.1.2.4. SWOT Analysis
- 12.1.3 Linde Healthcare
- 12.1.3.1. Company Overview
- 12.1.3.2. Products
- 12.1.3.3. Company Financials
- 12.1.3.4. SWOT Analysis
- 12.1.4 TNSC (MATHESON)
- 12.1.4.1. Company Overview
- 12.1.4.2. Products
- 12.1.4.3. Company Financials
- 12.1.4.4. SWOT Analysis
- 12.1.5 Taiyo Nippon Sanso
- 12.1.5.1. Company Overview
- 12.1.5.2. Products
- 12.1.5.3. Company Financials
- 12.1.5.4. SWOT Analysis
- 12.1.6 AMCS Corporation
- 12.1.6.1. Company Overview
- 12.1.6.2. Products
- 12.1.6.3. Company Financials
- 12.1.6.4. SWOT Analysis
- 12.1.7 Jinhong Group
- 12.1.7.1. Company Overview
- 12.1.7.2. Products
- 12.1.7.3. Company Financials
- 12.1.7.4. SWOT Analysis
- 12.1.1 Air Liquide
- 12.2. Market Entropy
- 12.2.1 Company's Key Areas Served
- 12.2.2 Recent Developments
- 12.3. Company Market Share Analysis 2025
- 12.3.1 Top 5 Companies Market Share Analysis
- 12.3.2 Top 3 Companies Market Share Analysis
- 12.4. List of Potential Customers
- 13. Research Methodology
List of Figures
- Figure 1: Global Medical Rare Gases Revenue Breakdown (million, %) by Region 2025 & 2033
- Figure 2: Global Medical Rare Gases Volume Breakdown (K, %) by Region 2025 & 2033
- Figure 3: North America Medical Rare Gases Revenue (million), by Application 2025 & 2033
- Figure 4: North America Medical Rare Gases Volume (K), by Application 2025 & 2033
- Figure 5: North America Medical Rare Gases Revenue Share (%), by Application 2025 & 2033
- Figure 6: North America Medical Rare Gases Volume Share (%), by Application 2025 & 2033
- Figure 7: North America Medical Rare Gases Revenue (million), by Types 2025 & 2033
- Figure 8: North America Medical Rare Gases Volume (K), by Types 2025 & 2033
- Figure 9: North America Medical Rare Gases Revenue Share (%), by Types 2025 & 2033
- Figure 10: North America Medical Rare Gases Volume Share (%), by Types 2025 & 2033
- Figure 11: North America Medical Rare Gases Revenue (million), by Country 2025 & 2033
- Figure 12: North America Medical Rare Gases Volume (K), by Country 2025 & 2033
- Figure 13: North America Medical Rare Gases Revenue Share (%), by Country 2025 & 2033
- Figure 14: North America Medical Rare Gases Volume Share (%), by Country 2025 & 2033
- Figure 15: South America Medical Rare Gases Revenue (million), by Application 2025 & 2033
- Figure 16: South America Medical Rare Gases Volume (K), by Application 2025 & 2033
- Figure 17: South America Medical Rare Gases Revenue Share (%), by Application 2025 & 2033
- Figure 18: South America Medical Rare Gases Volume Share (%), by Application 2025 & 2033
- Figure 19: South America Medical Rare Gases Revenue (million), by Types 2025 & 2033
- Figure 20: South America Medical Rare Gases Volume (K), by Types 2025 & 2033
- Figure 21: South America Medical Rare Gases Revenue Share (%), by Types 2025 & 2033
- Figure 22: South America Medical Rare Gases Volume Share (%), by Types 2025 & 2033
- Figure 23: South America Medical Rare Gases Revenue (million), by Country 2025 & 2033
- Figure 24: South America Medical Rare Gases Volume (K), by Country 2025 & 2033
- Figure 25: South America Medical Rare Gases Revenue Share (%), by Country 2025 & 2033
- Figure 26: South America Medical Rare Gases Volume Share (%), by Country 2025 & 2033
- Figure 27: Europe Medical Rare Gases Revenue (million), by Application 2025 & 2033
- Figure 28: Europe Medical Rare Gases Volume (K), by Application 2025 & 2033
- Figure 29: Europe Medical Rare Gases Revenue Share (%), by Application 2025 & 2033
- Figure 30: Europe Medical Rare Gases Volume Share (%), by Application 2025 & 2033
- Figure 31: Europe Medical Rare Gases Revenue (million), by Types 2025 & 2033
- Figure 32: Europe Medical Rare Gases Volume (K), by Types 2025 & 2033
- Figure 33: Europe Medical Rare Gases Revenue Share (%), by Types 2025 & 2033
- Figure 34: Europe Medical Rare Gases Volume Share (%), by Types 2025 & 2033
- Figure 35: Europe Medical Rare Gases Revenue (million), by Country 2025 & 2033
- Figure 36: Europe Medical Rare Gases Volume (K), by Country 2025 & 2033
- Figure 37: Europe Medical Rare Gases Revenue Share (%), by Country 2025 & 2033
- Figure 38: Europe Medical Rare Gases Volume Share (%), by Country 2025 & 2033
- Figure 39: Middle East & Africa Medical Rare Gases Revenue (million), by Application 2025 & 2033
- Figure 40: Middle East & Africa Medical Rare Gases Volume (K), by Application 2025 & 2033
- Figure 41: Middle East & Africa Medical Rare Gases Revenue Share (%), by Application 2025 & 2033
- Figure 42: Middle East & Africa Medical Rare Gases Volume Share (%), by Application 2025 & 2033
- Figure 43: Middle East & Africa Medical Rare Gases Revenue (million), by Types 2025 & 2033
- Figure 44: Middle East & Africa Medical Rare Gases Volume (K), by Types 2025 & 2033
- Figure 45: Middle East & Africa Medical Rare Gases Revenue Share (%), by Types 2025 & 2033
- Figure 46: Middle East & Africa Medical Rare Gases Volume Share (%), by Types 2025 & 2033
- Figure 47: Middle East & Africa Medical Rare Gases Revenue (million), by Country 2025 & 2033
- Figure 48: Middle East & Africa Medical Rare Gases Volume (K), by Country 2025 & 2033
- Figure 49: Middle East & Africa Medical Rare Gases Revenue Share (%), by Country 2025 & 2033
- Figure 50: Middle East & Africa Medical Rare Gases Volume Share (%), by Country 2025 & 2033
- Figure 51: Asia Pacific Medical Rare Gases Revenue (million), by Application 2025 & 2033
- Figure 52: Asia Pacific Medical Rare Gases Volume (K), by Application 2025 & 2033
- Figure 53: Asia Pacific Medical Rare Gases Revenue Share (%), by Application 2025 & 2033
- Figure 54: Asia Pacific Medical Rare Gases Volume Share (%), by Application 2025 & 2033
- Figure 55: Asia Pacific Medical Rare Gases Revenue (million), by Types 2025 & 2033
- Figure 56: Asia Pacific Medical Rare Gases Volume (K), by Types 2025 & 2033
- Figure 57: Asia Pacific Medical Rare Gases Revenue Share (%), by Types 2025 & 2033
- Figure 58: Asia Pacific Medical Rare Gases Volume Share (%), by Types 2025 & 2033
- Figure 59: Asia Pacific Medical Rare Gases Revenue (million), by Country 2025 & 2033
- Figure 60: Asia Pacific Medical Rare Gases Volume (K), by Country 2025 & 2033
- Figure 61: Asia Pacific Medical Rare Gases Revenue Share (%), by Country 2025 & 2033
- Figure 62: Asia Pacific Medical Rare Gases Volume Share (%), by Country 2025 & 2033
List of Tables
- Table 1: Global Medical Rare Gases Revenue million Forecast, by Application 2020 & 2033
- Table 2: Global Medical Rare Gases Volume K Forecast, by Application 2020 & 2033
- Table 3: Global Medical Rare Gases Revenue million Forecast, by Types 2020 & 2033
- Table 4: Global Medical Rare Gases Volume K Forecast, by Types 2020 & 2033
- Table 5: Global Medical Rare Gases Revenue million Forecast, by Region 2020 & 2033
- Table 6: Global Medical Rare Gases Volume K Forecast, by Region 2020 & 2033
- Table 7: Global Medical Rare Gases Revenue million Forecast, by Application 2020 & 2033
- Table 8: Global Medical Rare Gases Volume K Forecast, by Application 2020 & 2033
- Table 9: Global Medical Rare Gases Revenue million Forecast, by Types 2020 & 2033
- Table 10: Global Medical Rare Gases Volume K Forecast, by Types 2020 & 2033
- Table 11: Global Medical Rare Gases Revenue million Forecast, by Country 2020 & 2033
- Table 12: Global Medical Rare Gases Volume K Forecast, by Country 2020 & 2033
- Table 13: United States Medical Rare Gases Revenue (million) Forecast, by Application 2020 & 2033
- Table 14: United States Medical Rare Gases Volume (K) Forecast, by Application 2020 & 2033
- Table 15: Canada Medical Rare Gases Revenue (million) Forecast, by Application 2020 & 2033
- Table 16: Canada Medical Rare Gases Volume (K) Forecast, by Application 2020 & 2033
- Table 17: Mexico Medical Rare Gases Revenue (million) Forecast, by Application 2020 & 2033
- Table 18: Mexico Medical Rare Gases Volume (K) Forecast, by Application 2020 & 2033
- Table 19: Global Medical Rare Gases Revenue million Forecast, by Application 2020 & 2033
- Table 20: Global Medical Rare Gases Volume K Forecast, by Application 2020 & 2033
- Table 21: Global Medical Rare Gases Revenue million Forecast, by Types 2020 & 2033
- Table 22: Global Medical Rare Gases Volume K Forecast, by Types 2020 & 2033
- Table 23: Global Medical Rare Gases Revenue million Forecast, by Country 2020 & 2033
- Table 24: Global Medical Rare Gases Volume K Forecast, by Country 2020 & 2033
- Table 25: Brazil Medical Rare Gases Revenue (million) Forecast, by Application 2020 & 2033
- Table 26: Brazil Medical Rare Gases Volume (K) Forecast, by Application 2020 & 2033
- Table 27: Argentina Medical Rare Gases Revenue (million) Forecast, by Application 2020 & 2033
- Table 28: Argentina Medical Rare Gases Volume (K) Forecast, by Application 2020 & 2033
- Table 29: Rest of South America Medical Rare Gases Revenue (million) Forecast, by Application 2020 & 2033
- Table 30: Rest of South America Medical Rare Gases Volume (K) Forecast, by Application 2020 & 2033
- Table 31: Global Medical Rare Gases Revenue million Forecast, by Application 2020 & 2033
- Table 32: Global Medical Rare Gases Volume K Forecast, by Application 2020 & 2033
- Table 33: Global Medical Rare Gases Revenue million Forecast, by Types 2020 & 2033
- Table 34: Global Medical Rare Gases Volume K Forecast, by Types 2020 & 2033
- Table 35: Global Medical Rare Gases Revenue million Forecast, by Country 2020 & 2033
- Table 36: Global Medical Rare Gases Volume K Forecast, by Country 2020 & 2033
- Table 37: United Kingdom Medical Rare Gases Revenue (million) Forecast, by Application 2020 & 2033
- Table 38: United Kingdom Medical Rare Gases Volume (K) Forecast, by Application 2020 & 2033
- Table 39: Germany Medical Rare Gases Revenue (million) Forecast, by Application 2020 & 2033
- Table 40: Germany Medical Rare Gases Volume (K) Forecast, by Application 2020 & 2033
- Table 41: France Medical Rare Gases Revenue (million) Forecast, by Application 2020 & 2033
- Table 42: France Medical Rare Gases Volume (K) Forecast, by Application 2020 & 2033
- Table 43: Italy Medical Rare Gases Revenue (million) Forecast, by Application 2020 & 2033
- Table 44: Italy Medical Rare Gases Volume (K) Forecast, by Application 2020 & 2033
- Table 45: Spain Medical Rare Gases Revenue (million) Forecast, by Application 2020 & 2033
- Table 46: Spain Medical Rare Gases Volume (K) Forecast, by Application 2020 & 2033
- Table 47: Russia Medical Rare Gases Revenue (million) Forecast, by Application 2020 & 2033
- Table 48: Russia Medical Rare Gases Volume (K) Forecast, by Application 2020 & 2033
- Table 49: Benelux Medical Rare Gases Revenue (million) Forecast, by Application 2020 & 2033
- Table 50: Benelux Medical Rare Gases Volume (K) Forecast, by Application 2020 & 2033
- Table 51: Nordics Medical Rare Gases Revenue (million) Forecast, by Application 2020 & 2033
- Table 52: Nordics Medical Rare Gases Volume (K) Forecast, by Application 2020 & 2033
- Table 53: Rest of Europe Medical Rare Gases Revenue (million) Forecast, by Application 2020 & 2033
- Table 54: Rest of Europe Medical Rare Gases Volume (K) Forecast, by Application 2020 & 2033
- Table 55: Global Medical Rare Gases Revenue million Forecast, by Application 2020 & 2033
- Table 56: Global Medical Rare Gases Volume K Forecast, by Application 2020 & 2033
- Table 57: Global Medical Rare Gases Revenue million Forecast, by Types 2020 & 2033
- Table 58: Global Medical Rare Gases Volume K Forecast, by Types 2020 & 2033
- Table 59: Global Medical Rare Gases Revenue million Forecast, by Country 2020 & 2033
- Table 60: Global Medical Rare Gases Volume K Forecast, by Country 2020 & 2033
- Table 61: Turkey Medical Rare Gases Revenue (million) Forecast, by Application 2020 & 2033
- Table 62: Turkey Medical Rare Gases Volume (K) Forecast, by Application 2020 & 2033
- Table 63: Israel Medical Rare Gases Revenue (million) Forecast, by Application 2020 & 2033
- Table 64: Israel Medical Rare Gases Volume (K) Forecast, by Application 2020 & 2033
- Table 65: GCC Medical Rare Gases Revenue (million) Forecast, by Application 2020 & 2033
- Table 66: GCC Medical Rare Gases Volume (K) Forecast, by Application 2020 & 2033
- Table 67: North Africa Medical Rare Gases Revenue (million) Forecast, by Application 2020 & 2033
- Table 68: North Africa Medical Rare Gases Volume (K) Forecast, by Application 2020 & 2033
- Table 69: South Africa Medical Rare Gases Revenue (million) Forecast, by Application 2020 & 2033
- Table 70: South Africa Medical Rare Gases Volume (K) Forecast, by Application 2020 & 2033
- Table 71: Rest of Middle East & Africa Medical Rare Gases Revenue (million) Forecast, by Application 2020 & 2033
- Table 72: Rest of Middle East & Africa Medical Rare Gases Volume (K) Forecast, by Application 2020 & 2033
- Table 73: Global Medical Rare Gases Revenue million Forecast, by Application 2020 & 2033
- Table 74: Global Medical Rare Gases Volume K Forecast, by Application 2020 & 2033
- Table 75: Global Medical Rare Gases Revenue million Forecast, by Types 2020 & 2033
- Table 76: Global Medical Rare Gases Volume K Forecast, by Types 2020 & 2033
- Table 77: Global Medical Rare Gases Revenue million Forecast, by Country 2020 & 2033
- Table 78: Global Medical Rare Gases Volume K Forecast, by Country 2020 & 2033
- Table 79: China Medical Rare Gases Revenue (million) Forecast, by Application 2020 & 2033
- Table 80: China Medical Rare Gases Volume (K) Forecast, by Application 2020 & 2033
- Table 81: India Medical Rare Gases Revenue (million) Forecast, by Application 2020 & 2033
- Table 82: India Medical Rare Gases Volume (K) Forecast, by Application 2020 & 2033
- Table 83: Japan Medical Rare Gases Revenue (million) Forecast, by Application 2020 & 2033
- Table 84: Japan Medical Rare Gases Volume (K) Forecast, by Application 2020 & 2033
- Table 85: South Korea Medical Rare Gases Revenue (million) Forecast, by Application 2020 & 2033
- Table 86: South Korea Medical Rare Gases Volume (K) Forecast, by Application 2020 & 2033
- Table 87: ASEAN Medical Rare Gases Revenue (million) Forecast, by Application 2020 & 2033
- Table 88: ASEAN Medical Rare Gases Volume (K) Forecast, by Application 2020 & 2033
- Table 89: Oceania Medical Rare Gases Revenue (million) Forecast, by Application 2020 & 2033
- Table 90: Oceania Medical Rare Gases Volume (K) Forecast, by Application 2020 & 2033
- Table 91: Rest of Asia Pacific Medical Rare Gases Revenue (million) Forecast, by Application 2020 & 2033
- Table 92: Rest of Asia Pacific Medical Rare Gases Volume (K) Forecast, by Application 2020 & 2033
Frequently Asked Questions
1. What is the projected Compound Annual Growth Rate (CAGR) of the Medical Rare Gases?
The projected CAGR is approximately 3.4%.
2. Which companies are prominent players in the Medical Rare Gases?
Key companies in the market include Air Liquide, Air Products, Linde Healthcare, TNSC (MATHESON), Taiyo Nippon Sanso, AMCS Corporation, Jinhong Group.
3. What are the main segments of the Medical Rare Gases?
The market segments include Application, Types.
4. Can you provide details about the market size?
The market size is estimated to be USD 1305 million as of 2022.
5. What are some drivers contributing to market growth?
N/A
6. What are the notable trends driving market growth?
N/A
7. Are there any restraints impacting market growth?
N/A
8. Can you provide examples of recent developments in the market?
N/A
9. What pricing options are available for accessing the report?
Pricing options include single-user, multi-user, and enterprise licenses priced at USD 3950.00, USD 5925.00, and USD 7900.00 respectively.
10. Is the market size provided in terms of value or volume?
The market size is provided in terms of value, measured in million and volume, measured in K.
11. Are there any specific market keywords associated with the report?
Yes, the market keyword associated with the report is "Medical Rare Gases," which aids in identifying and referencing the specific market segment covered.
12. How do I determine which pricing option suits my needs best?
The pricing options vary based on user requirements and access needs. Individual users may opt for single-user licenses, while businesses requiring broader access may choose multi-user or enterprise licenses for cost-effective access to the report.
13. Are there any additional resources or data provided in the Medical Rare Gases report?
While the report offers comprehensive insights, it's advisable to review the specific contents or supplementary materials provided to ascertain if additional resources or data are available.
14. How can I stay updated on further developments or reports in the Medical Rare Gases?
To stay informed about further developments, trends, and reports in the Medical Rare Gases, consider subscribing to industry newsletters, following relevant companies and organizations, or regularly checking reputable industry news sources and publications.
Methodology
Step 1 - Identification of Relevant Samples Size from Population Database


Step 2 - Approaches for Defining Global Market Size (Value, Volume* & Price*)

Note*: In applicable scenarios
Step 3 - Data Sources
Primary Research
- Web Analytics
- Survey Reports
- Research Institute
- Latest Research Reports
- Opinion Leaders
Secondary Research
- Annual Reports
- White Paper
- Latest Press Release
- Industry Association
- Paid Database
- Investor Presentations

Step 4 - Data Triangulation
Involves using different sources of information in order to increase the validity of a study
These sources are likely to be stakeholders in a program - participants, other researchers, program staff, other community members, and so on.
Then we put all data in single framework & apply various statistical tools to find out the dynamic on the market.
During the analysis stage, feedback from the stakeholder groups would be compared to determine areas of agreement as well as areas of divergence