

Key Insights
The Medical Imaging Analysis Software market is projected for substantial expansion, estimated at $43.5 billion in 2025, with a Compound Annual Growth Rate (CAGR) of 5.1% from 2025 to 2033. This growth is propelled by escalating chronic disease rates, driving demand for advanced diagnostic imaging analysis. Key drivers include rapid technological advancements in AI and ML for image processing, alongside the increasing adoption of cost-effective, accessible cloud-based solutions by healthcare providers. The market is segmented by image type (2D, 3D, 4D), modality (tomography, ultrasound, radiography, X-ray, MRI, others), software type (integrated, standalone), and end-user (hospitals, diagnostic centers, research centers). Major competitors, including Siemens Healthcare, GE Healthcare, Philips, and IBM, are actively engaged in strategic collaborations and innovation.
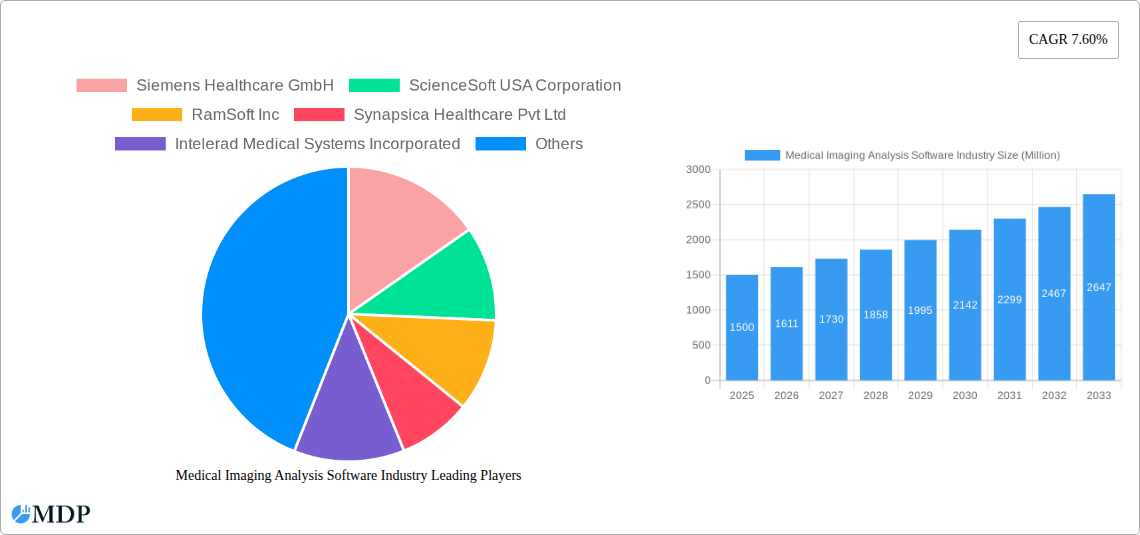
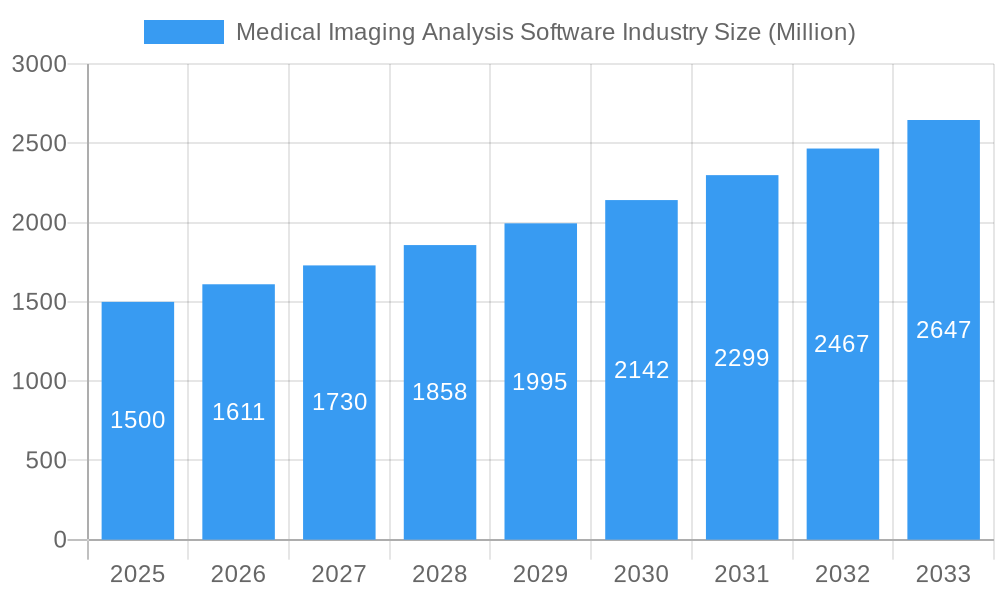
Medical Imaging Analysis Software Industry Market Size (In Billion)
North America currently leads the market due to high healthcare spending and early technology adoption. The Asia-Pacific region is expected to exhibit significant growth driven by healthcare infrastructure development and increasing awareness of advanced diagnostics. Challenges such as software costs and the need for skilled personnel are being addressed through improved affordability and user-friendly interfaces. Regulatory compliance and data privacy are critical considerations. The forecast for 2025-2033 predicts continued market growth, fueled by the integration of medical imaging with advanced analytics, particularly AI and ML, for personalized medicine applications.
Medical Imaging Analysis Software Industry Company Market Share
Medical Imaging Analysis Software Industry Market Report: 2019-2033
This comprehensive report provides a detailed analysis of the Medical Imaging Analysis Software industry, encompassing market dynamics, leading players, technological advancements, and future growth prospects. The study period covers 2019-2033, with 2025 as the base and estimated year. This report is essential for stakeholders including investors, manufacturers, and healthcare providers seeking to navigate this rapidly evolving landscape. The global market is projected to reach xx Million by 2033.
Medical Imaging Analysis Software Industry Market Dynamics & Concentration
The Medical Imaging Analysis Software market exhibits a moderately consolidated structure, with key players holding significant market share. The market size in 2024 was estimated at xx Million. Competition is intense, driven by innovation, technological advancements, and strategic acquisitions. Regulatory frameworks, particularly concerning data privacy and software validation, significantly impact market dynamics. The market is witnessing a steady increase in M&A activities, as larger companies seek to expand their product portfolios and market reach. Substitute products, such as cloud-based image analysis platforms, pose a competitive challenge. End-user trends, including increasing adoption of AI-powered solutions and a preference for integrated software, shape market growth.
- Market Share: Top 5 players hold approximately xx% of the market share (2024).
- M&A Activity: xx major mergers and acquisitions were recorded between 2019 and 2024.
- Innovation Drivers: AI, deep learning, cloud computing, and advanced visualization techniques.
- Regulatory Landscape: HIPAA, GDPR, and other regional regulations influence software development and deployment.
Medical Imaging Analysis Software Industry Trends & Analysis
The Medical Imaging Analysis Software market is experiencing robust growth, driven by several key factors. The Compound Annual Growth Rate (CAGR) from 2025 to 2033 is projected to be xx%. Technological advancements, such as the integration of artificial intelligence (AI) and machine learning (ML) algorithms, are revolutionizing image analysis, leading to improved diagnostic accuracy and efficiency. Increasing demand for faster and more accurate diagnoses, coupled with rising prevalence of chronic diseases, fuels market expansion. Consumer preferences are shifting toward user-friendly interfaces and cloud-based solutions, impacting software design and deployment strategies. Intense competition among established players and new entrants continues to drive innovation and improve cost-effectiveness. Market penetration is expected to reach xx% by 2033.
Leading Markets & Segments in Medical Imaging Analysis Software Industry
The North American region currently dominates the Medical Imaging Analysis Software market, driven by high healthcare spending, technological advancements, and robust regulatory frameworks. However, the Asia-Pacific region is projected to witness the fastest growth rate during the forecast period due to increasing healthcare infrastructure development and rising disposable incomes.
Dominant Segments:
- Image Type: 2D and 3D imaging currently hold the largest market share, but 4D imaging is experiencing rapid growth.
- Modality: MRI and X-ray imaging are the dominant modalities, followed by CT scanning and Ultrasound.
- Software Type: Integrated software solutions are gaining popularity over standalone software due to their enhanced efficiency and workflow integration.
- End User: Hospitals and diagnostic centers account for the largest segment, with research centers showing significant growth potential.
Key Drivers:
- North America: High healthcare expenditure, technological infrastructure, and stringent regulatory oversight.
- Asia-Pacific: Rapid economic growth, increasing healthcare investments, and growing adoption of advanced technologies.
- Europe: Strong regulatory environment and rising focus on preventive healthcare.
Medical Imaging Analysis Software Industry Product Developments
Recent product innovations have focused on enhancing image quality, improving workflow efficiency, and integrating AI capabilities. Manufacturers are integrating deep learning algorithms into their software to automate tasks like image segmentation, detection, and quantification. The market is also witnessing the rise of cloud-based solutions that enable remote access to imaging data and analysis tools. These advancements enhance diagnostic accuracy, reduce processing time, and improve the overall patient experience. New products emphasize seamless integration with existing hospital information systems (HIS) and picture archiving and communication systems (PACS).
Key Drivers of Medical Imaging Analysis Software Industry Growth
The Medical Imaging Analysis Software market is driven by a confluence of factors. Advancements in AI and machine learning are enabling faster and more accurate image analysis, leading to improved diagnostic outcomes. Increased prevalence of chronic diseases necessitates more sophisticated diagnostic tools, boosting market demand. Government initiatives supporting digital healthcare transformation and investments in healthcare infrastructure are propelling market expansion. Furthermore, a growing preference for minimally invasive procedures and personalized medicine further fuels the adoption of advanced imaging analysis software.
Challenges in the Medical Imaging Analysis Software Industry Market
The market faces several challenges. Strict regulatory requirements for software validation and data security increase development costs and time-to-market. Supply chain disruptions, particularly concerning specialized hardware components, can impact production and delivery. Intense competition among established players and the emergence of new entrants exert pressure on pricing and margins. The xx Million investment required for software development can be a barrier for small companies.
Emerging Opportunities in Medical Imaging Analysis Software Industry
Emerging opportunities lie in the integration of AI and machine learning for advanced image analysis, offering significant potential for improved diagnostic accuracy and efficiency. Strategic partnerships between software developers and healthcare providers can drive market penetration and accelerate product adoption. Expansion into new geographic markets with growing healthcare infrastructure offers significant untapped potential for market growth. Furthermore, the development of specialized software solutions for niche medical applications will continue to open up new revenue streams.
Leading Players in the Medical Imaging Analysis Software Industry Sector
- Siemens Healthcare GmbH
- ScienceSoft USA Corporation
- RamSoft Inc
- Synapsica Healthcare Pvt Ltd
- Intelerad Medical Systems Incorporated
- Carestream Health
- Xinapse Systems Ltd
- General Electric Company (GE Healthcare)
- Canon Inc (Canon Medical Systems USA)
- Koninklijke Philips NV
- International Business Machines Corporation (IBM)
- AQUILAB SAS
- Agfa-Gevaert Group
Key Milestones in Medical Imaging Analysis Software Industry Industry
- July 2022: Siemens Healthineers integrated Subtle Medical's SubtleMR software into its Open Recon pipeline, improving MRI image quality and workflow.
- March 2022: Canon Medical Systems acquired Nordisk Rontgen Teknik, strengthening its X-ray business.
Strategic Outlook for Medical Imaging Analysis Software Industry Market
The future of the Medical Imaging Analysis Software market is promising, driven by continuous technological advancements, rising healthcare spending, and the growing need for improved diagnostic accuracy. Strategic partnerships, focused innovation in AI and ML, and expansion into emerging markets will be critical for success. The market is poised for significant growth, offering substantial opportunities for both established players and new entrants to capitalize on the increasing demand for sophisticated imaging analysis solutions.
Medical Imaging Analysis Software Industry Segmentation
-
1. Image Type
- 1.1. 2D Image
- 1.2. 3D Image
- 1.3. 4D Image
-
2. Modality
- 2.1. Tomography
- 2.2. Ultrasound Imaging
- 2.3. Radiographic Imaging
- 2.4. X-ray Imaging
- 2.5. Magnetic Resonance Imaging (MRI)
- 2.6. Other Modalities
-
3. Software Type
- 3.1. Integrated Software
- 3.2. Standalone Software
-
4. End User
- 4.1. Hospital
- 4.2. Diagnostic Center
- 4.3. Research Center
Medical Imaging Analysis Software Industry Segmentation By Geography
-
1. North America
- 1.1. United States
- 1.2. Canada
- 1.3. Mexico
-
2. Europe
- 2.1. Germany
- 2.2. United Kingdom
- 2.3. France
- 2.4. Italy
- 2.5. Spain
- 2.6. Rest of Europe
-
3. Asia Pacific
- 3.1. China
- 3.2. Japan
- 3.3. India
- 3.4. Australia
- 3.5. South Korea
- 3.6. Rest of Asia Pacific
-
4. Middle East and Africa
- 4.1. GCC
- 4.2. South Africa
- 4.3. Rest of Middle East and Africa
-
5. South America
- 5.1. Brazil
- 5.2. Argentina
- 5.3. Rest of South America
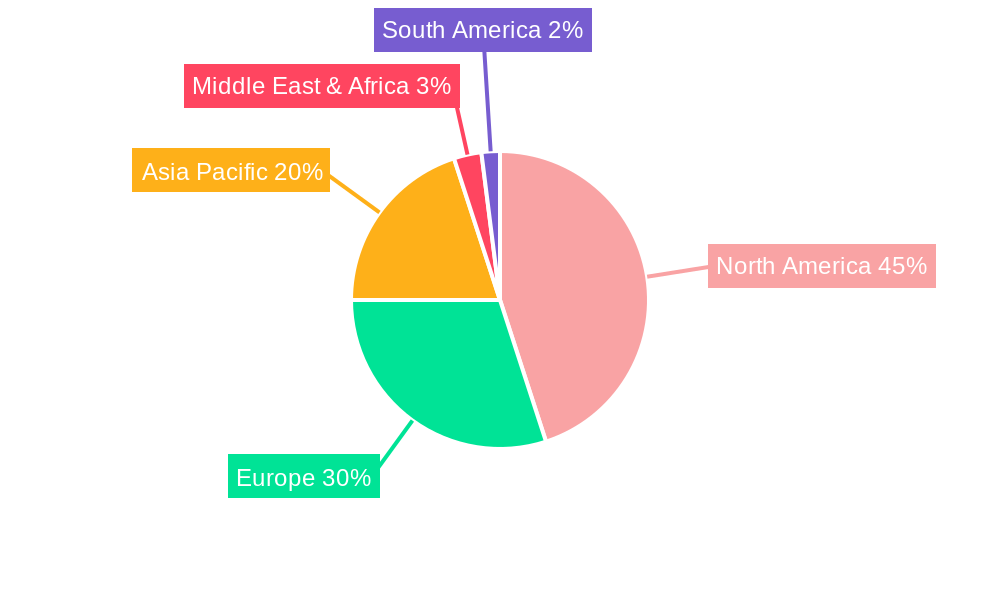
Medical Imaging Analysis Software Industry Regional Market Share
Geographic Coverage of Medical Imaging Analysis Software Industry
Medical Imaging Analysis Software Industry REPORT HIGHLIGHTS
| Aspects | Details |
|---|---|
| Study Period | 2020-2034 |
| Base Year | 2025 |
| Estimated Year | 2026 |
| Forecast Period | 2026-2034 |
| Historical Period | 2020-2025 |
| Growth Rate | CAGR of 5.1% from 2020-2034 |
| Segmentation |
|
Table of Contents
- 1. Introduction
- 1.1. Research Scope
- 1.2. Market Segmentation
- 1.3. Research Objective
- 1.4. Definitions and Assumptions
- 2. Executive Summary
- 2.1. Market Snapshot
- 3. Market Dynamics
- 3.1. Market Drivers
- 3.2. Market Restrains
- 3.3. Market Trends
- 3.4. Market Opportunities
- 4. Market Factor Analysis
- 4.1. Porters Five Forces
- 4.1.1. Bargaining Power of Suppliers
- 4.1.2. Bargaining Power of Buyers
- 4.1.3. Threat of New Entrants
- 4.1.4. Threat of Substitutes
- 4.1.5. Competitive Rivalry
- 4.2. PESTEL analysis
- 4.3. BCG Analysis
- 4.3.1. Stars (High Growth, High Market Share)
- 4.3.2. Cash Cows (Low Growth, High Market Share)
- 4.3.3. Question Mark (High Growth, Low Market Share)
- 4.3.4. Dogs (Low Growth, Low Market Share)
- 4.4. Ansoff Matrix Analysis
- 4.5. Supply Chain Analysis
- 4.6. Regulatory Landscape
- 4.7. Current Market Potential and Opportunity Assessment (TAM–SAM–SOM Framework)
- 4.8. MDP Analyst Note
- 4.1. Porters Five Forces
- 5. Market Analysis, Insights and Forecast 2021-2033
- 5.1. Market Analysis, Insights and Forecast - by Image Type
- 5.1.1. 2D Image
- 5.1.2. 3D Image
- 5.1.3. 4D Image
- 5.2. Market Analysis, Insights and Forecast - by Modality
- 5.2.1. Tomography
- 5.2.2. Ultrasound Imaging
- 5.2.3. Radiographic Imaging
- 5.2.4. X-ray Imaging
- 5.2.5. Magnetic Resonance Imaging (MRI)
- 5.2.6. Other Modalities
- 5.3. Market Analysis, Insights and Forecast - by Software Type
- 5.3.1. Integrated Software
- 5.3.2. Standalone Software
- 5.4. Market Analysis, Insights and Forecast - by End User
- 5.4.1. Hospital
- 5.4.2. Diagnostic Center
- 5.4.3. Research Center
- 5.5. Market Analysis, Insights and Forecast - by Region
- 5.5.1. North America
- 5.5.2. Europe
- 5.5.3. Asia Pacific
- 5.5.4. Middle East and Africa
- 5.5.5. South America
- 5.1. Market Analysis, Insights and Forecast - by Image Type
- 6. Global Medical Imaging Analysis Software Industry Analysis, Insights and Forecast, 2021-2033
- 6.1. Market Analysis, Insights and Forecast - by Image Type
- 6.1.1. 2D Image
- 6.1.2. 3D Image
- 6.1.3. 4D Image
- 6.2. Market Analysis, Insights and Forecast - by Modality
- 6.2.1. Tomography
- 6.2.2. Ultrasound Imaging
- 6.2.3. Radiographic Imaging
- 6.2.4. X-ray Imaging
- 6.2.5. Magnetic Resonance Imaging (MRI)
- 6.2.6. Other Modalities
- 6.3. Market Analysis, Insights and Forecast - by Software Type
- 6.3.1. Integrated Software
- 6.3.2. Standalone Software
- 6.4. Market Analysis, Insights and Forecast - by End User
- 6.4.1. Hospital
- 6.4.2. Diagnostic Center
- 6.4.3. Research Center
- 6.1. Market Analysis, Insights and Forecast - by Image Type
- 7. North America Medical Imaging Analysis Software Industry Analysis, Insights and Forecast, 2020-2032
- 7.1. Market Analysis, Insights and Forecast - by Image Type
- 7.1.1. 2D Image
- 7.1.2. 3D Image
- 7.1.3. 4D Image
- 7.2. Market Analysis, Insights and Forecast - by Modality
- 7.2.1. Tomography
- 7.2.2. Ultrasound Imaging
- 7.2.3. Radiographic Imaging
- 7.2.4. X-ray Imaging
- 7.2.5. Magnetic Resonance Imaging (MRI)
- 7.2.6. Other Modalities
- 7.3. Market Analysis, Insights and Forecast - by Software Type
- 7.3.1. Integrated Software
- 7.3.2. Standalone Software
- 7.4. Market Analysis, Insights and Forecast - by End User
- 7.4.1. Hospital
- 7.4.2. Diagnostic Center
- 7.4.3. Research Center
- 7.1. Market Analysis, Insights and Forecast - by Image Type
- 8. Europe Medical Imaging Analysis Software Industry Analysis, Insights and Forecast, 2020-2032
- 8.1. Market Analysis, Insights and Forecast - by Image Type
- 8.1.1. 2D Image
- 8.1.2. 3D Image
- 8.1.3. 4D Image
- 8.2. Market Analysis, Insights and Forecast - by Modality
- 8.2.1. Tomography
- 8.2.2. Ultrasound Imaging
- 8.2.3. Radiographic Imaging
- 8.2.4. X-ray Imaging
- 8.2.5. Magnetic Resonance Imaging (MRI)
- 8.2.6. Other Modalities
- 8.3. Market Analysis, Insights and Forecast - by Software Type
- 8.3.1. Integrated Software
- 8.3.2. Standalone Software
- 8.4. Market Analysis, Insights and Forecast - by End User
- 8.4.1. Hospital
- 8.4.2. Diagnostic Center
- 8.4.3. Research Center
- 8.1. Market Analysis, Insights and Forecast - by Image Type
- 9. Asia Pacific Medical Imaging Analysis Software Industry Analysis, Insights and Forecast, 2020-2032
- 9.1. Market Analysis, Insights and Forecast - by Image Type
- 9.1.1. 2D Image
- 9.1.2. 3D Image
- 9.1.3. 4D Image
- 9.2. Market Analysis, Insights and Forecast - by Modality
- 9.2.1. Tomography
- 9.2.2. Ultrasound Imaging
- 9.2.3. Radiographic Imaging
- 9.2.4. X-ray Imaging
- 9.2.5. Magnetic Resonance Imaging (MRI)
- 9.2.6. Other Modalities
- 9.3. Market Analysis, Insights and Forecast - by Software Type
- 9.3.1. Integrated Software
- 9.3.2. Standalone Software
- 9.4. Market Analysis, Insights and Forecast - by End User
- 9.4.1. Hospital
- 9.4.2. Diagnostic Center
- 9.4.3. Research Center
- 9.1. Market Analysis, Insights and Forecast - by Image Type
- 10. Middle East and Africa Medical Imaging Analysis Software Industry Analysis, Insights and Forecast, 2020-2032
- 10.1. Market Analysis, Insights and Forecast - by Image Type
- 10.1.1. 2D Image
- 10.1.2. 3D Image
- 10.1.3. 4D Image
- 10.2. Market Analysis, Insights and Forecast - by Modality
- 10.2.1. Tomography
- 10.2.2. Ultrasound Imaging
- 10.2.3. Radiographic Imaging
- 10.2.4. X-ray Imaging
- 10.2.5. Magnetic Resonance Imaging (MRI)
- 10.2.6. Other Modalities
- 10.3. Market Analysis, Insights and Forecast - by Software Type
- 10.3.1. Integrated Software
- 10.3.2. Standalone Software
- 10.4. Market Analysis, Insights and Forecast - by End User
- 10.4.1. Hospital
- 10.4.2. Diagnostic Center
- 10.4.3. Research Center
- 10.1. Market Analysis, Insights and Forecast - by Image Type
- 11. South America Medical Imaging Analysis Software Industry Analysis, Insights and Forecast, 2020-2032
- 11.1. Market Analysis, Insights and Forecast - by Image Type
- 11.1.1. 2D Image
- 11.1.2. 3D Image
- 11.1.3. 4D Image
- 11.2. Market Analysis, Insights and Forecast - by Modality
- 11.2.1. Tomography
- 11.2.2. Ultrasound Imaging
- 11.2.3. Radiographic Imaging
- 11.2.4. X-ray Imaging
- 11.2.5. Magnetic Resonance Imaging (MRI)
- 11.2.6. Other Modalities
- 11.3. Market Analysis, Insights and Forecast - by Software Type
- 11.3.1. Integrated Software
- 11.3.2. Standalone Software
- 11.4. Market Analysis, Insights and Forecast - by End User
- 11.4.1. Hospital
- 11.4.2. Diagnostic Center
- 11.4.3. Research Center
- 11.1. Market Analysis, Insights and Forecast - by Image Type
- 12. Competitive Analysis
- 12.1. Company Profiles
- 12.1.1 Siemens Healthcare GmbH
- 12.1.1.1. Company Overview
- 12.1.1.2. Products
- 12.1.1.3. Company Financials
- 12.1.1.4. SWOT Analysis
- 12.1.2 ScienceSoft USA Corporation
- 12.1.2.1. Company Overview
- 12.1.2.2. Products
- 12.1.2.3. Company Financials
- 12.1.2.4. SWOT Analysis
- 12.1.3 RamSoft Inc
- 12.1.3.1. Company Overview
- 12.1.3.2. Products
- 12.1.3.3. Company Financials
- 12.1.3.4. SWOT Analysis
- 12.1.4 Synapsica Healthcare Pvt Ltd
- 12.1.4.1. Company Overview
- 12.1.4.2. Products
- 12.1.4.3. Company Financials
- 12.1.4.4. SWOT Analysis
- 12.1.5 Intelerad Medical Systems Incorporated
- 12.1.5.1. Company Overview
- 12.1.5.2. Products
- 12.1.5.3. Company Financials
- 12.1.5.4. SWOT Analysis
- 12.1.6 Carestream Health
- 12.1.6.1. Company Overview
- 12.1.6.2. Products
- 12.1.6.3. Company Financials
- 12.1.6.4. SWOT Analysis
- 12.1.7 Xinapse Systems Ltd
- 12.1.7.1. Company Overview
- 12.1.7.2. Products
- 12.1.7.3. Company Financials
- 12.1.7.4. SWOT Analysis
- 12.1.8 General Electric Company (GE Healthcare)
- 12.1.8.1. Company Overview
- 12.1.8.2. Products
- 12.1.8.3. Company Financials
- 12.1.8.4. SWOT Analysis
- 12.1.9 Canon Inc (Canon Medical Systems USA)
- 12.1.9.1. Company Overview
- 12.1.9.2. Products
- 12.1.9.3. Company Financials
- 12.1.9.4. SWOT Analysis
- 12.1.10 Koninklijke Philips NV
- 12.1.10.1. Company Overview
- 12.1.10.2. Products
- 12.1.10.3. Company Financials
- 12.1.10.4. SWOT Analysis
- 12.1.11 International Business Machines Corporation (IBM)
- 12.1.11.1. Company Overview
- 12.1.11.2. Products
- 12.1.11.3. Company Financials
- 12.1.11.4. SWOT Analysis
- 12.1.12 AQUILAB SAS
- 12.1.12.1. Company Overview
- 12.1.12.2. Products
- 12.1.12.3. Company Financials
- 12.1.12.4. SWOT Analysis
- 12.1.13 Agfa-Gevaert Group
- 12.1.13.1. Company Overview
- 12.1.13.2. Products
- 12.1.13.3. Company Financials
- 12.1.13.4. SWOT Analysis
- 12.1.1 Siemens Healthcare GmbH
- 12.2. Market Entropy
- 12.2.1 Company's Key Areas Served
- 12.2.2 Recent Developments
- 12.3. Company Market Share Analysis 2025
- 12.3.1 Top 5 Companies Market Share Analysis
- 12.3.2 Top 3 Companies Market Share Analysis
- 12.4. List of Potential Customers
- 13. Research Methodology
List of Figures
- Figure 1: Global Medical Imaging Analysis Software Industry Revenue Breakdown (billion, %) by Region 2025 & 2033
- Figure 2: Global Medical Imaging Analysis Software Industry Volume Breakdown (K Unit, %) by Region 2025 & 2033
- Figure 3: North America Medical Imaging Analysis Software Industry Revenue (billion), by Image Type 2025 & 2033
- Figure 4: North America Medical Imaging Analysis Software Industry Volume (K Unit), by Image Type 2025 & 2033
- Figure 5: North America Medical Imaging Analysis Software Industry Revenue Share (%), by Image Type 2025 & 2033
- Figure 6: North America Medical Imaging Analysis Software Industry Volume Share (%), by Image Type 2025 & 2033
- Figure 7: North America Medical Imaging Analysis Software Industry Revenue (billion), by Modality 2025 & 2033
- Figure 8: North America Medical Imaging Analysis Software Industry Volume (K Unit), by Modality 2025 & 2033
- Figure 9: North America Medical Imaging Analysis Software Industry Revenue Share (%), by Modality 2025 & 2033
- Figure 10: North America Medical Imaging Analysis Software Industry Volume Share (%), by Modality 2025 & 2033
- Figure 11: North America Medical Imaging Analysis Software Industry Revenue (billion), by Software Type 2025 & 2033
- Figure 12: North America Medical Imaging Analysis Software Industry Volume (K Unit), by Software Type 2025 & 2033
- Figure 13: North America Medical Imaging Analysis Software Industry Revenue Share (%), by Software Type 2025 & 2033
- Figure 14: North America Medical Imaging Analysis Software Industry Volume Share (%), by Software Type 2025 & 2033
- Figure 15: North America Medical Imaging Analysis Software Industry Revenue (billion), by End User 2025 & 2033
- Figure 16: North America Medical Imaging Analysis Software Industry Volume (K Unit), by End User 2025 & 2033
- Figure 17: North America Medical Imaging Analysis Software Industry Revenue Share (%), by End User 2025 & 2033
- Figure 18: North America Medical Imaging Analysis Software Industry Volume Share (%), by End User 2025 & 2033
- Figure 19: North America Medical Imaging Analysis Software Industry Revenue (billion), by Country 2025 & 2033
- Figure 20: North America Medical Imaging Analysis Software Industry Volume (K Unit), by Country 2025 & 2033
- Figure 21: North America Medical Imaging Analysis Software Industry Revenue Share (%), by Country 2025 & 2033
- Figure 22: North America Medical Imaging Analysis Software Industry Volume Share (%), by Country 2025 & 2033
- Figure 23: Europe Medical Imaging Analysis Software Industry Revenue (billion), by Image Type 2025 & 2033
- Figure 24: Europe Medical Imaging Analysis Software Industry Volume (K Unit), by Image Type 2025 & 2033
- Figure 25: Europe Medical Imaging Analysis Software Industry Revenue Share (%), by Image Type 2025 & 2033
- Figure 26: Europe Medical Imaging Analysis Software Industry Volume Share (%), by Image Type 2025 & 2033
- Figure 27: Europe Medical Imaging Analysis Software Industry Revenue (billion), by Modality 2025 & 2033
- Figure 28: Europe Medical Imaging Analysis Software Industry Volume (K Unit), by Modality 2025 & 2033
- Figure 29: Europe Medical Imaging Analysis Software Industry Revenue Share (%), by Modality 2025 & 2033
- Figure 30: Europe Medical Imaging Analysis Software Industry Volume Share (%), by Modality 2025 & 2033
- Figure 31: Europe Medical Imaging Analysis Software Industry Revenue (billion), by Software Type 2025 & 2033
- Figure 32: Europe Medical Imaging Analysis Software Industry Volume (K Unit), by Software Type 2025 & 2033
- Figure 33: Europe Medical Imaging Analysis Software Industry Revenue Share (%), by Software Type 2025 & 2033
- Figure 34: Europe Medical Imaging Analysis Software Industry Volume Share (%), by Software Type 2025 & 2033
- Figure 35: Europe Medical Imaging Analysis Software Industry Revenue (billion), by End User 2025 & 2033
- Figure 36: Europe Medical Imaging Analysis Software Industry Volume (K Unit), by End User 2025 & 2033
- Figure 37: Europe Medical Imaging Analysis Software Industry Revenue Share (%), by End User 2025 & 2033
- Figure 38: Europe Medical Imaging Analysis Software Industry Volume Share (%), by End User 2025 & 2033
- Figure 39: Europe Medical Imaging Analysis Software Industry Revenue (billion), by Country 2025 & 2033
- Figure 40: Europe Medical Imaging Analysis Software Industry Volume (K Unit), by Country 2025 & 2033
- Figure 41: Europe Medical Imaging Analysis Software Industry Revenue Share (%), by Country 2025 & 2033
- Figure 42: Europe Medical Imaging Analysis Software Industry Volume Share (%), by Country 2025 & 2033
- Figure 43: Asia Pacific Medical Imaging Analysis Software Industry Revenue (billion), by Image Type 2025 & 2033
- Figure 44: Asia Pacific Medical Imaging Analysis Software Industry Volume (K Unit), by Image Type 2025 & 2033
- Figure 45: Asia Pacific Medical Imaging Analysis Software Industry Revenue Share (%), by Image Type 2025 & 2033
- Figure 46: Asia Pacific Medical Imaging Analysis Software Industry Volume Share (%), by Image Type 2025 & 2033
- Figure 47: Asia Pacific Medical Imaging Analysis Software Industry Revenue (billion), by Modality 2025 & 2033
- Figure 48: Asia Pacific Medical Imaging Analysis Software Industry Volume (K Unit), by Modality 2025 & 2033
- Figure 49: Asia Pacific Medical Imaging Analysis Software Industry Revenue Share (%), by Modality 2025 & 2033
- Figure 50: Asia Pacific Medical Imaging Analysis Software Industry Volume Share (%), by Modality 2025 & 2033
- Figure 51: Asia Pacific Medical Imaging Analysis Software Industry Revenue (billion), by Software Type 2025 & 2033
- Figure 52: Asia Pacific Medical Imaging Analysis Software Industry Volume (K Unit), by Software Type 2025 & 2033
- Figure 53: Asia Pacific Medical Imaging Analysis Software Industry Revenue Share (%), by Software Type 2025 & 2033
- Figure 54: Asia Pacific Medical Imaging Analysis Software Industry Volume Share (%), by Software Type 2025 & 2033
- Figure 55: Asia Pacific Medical Imaging Analysis Software Industry Revenue (billion), by End User 2025 & 2033
- Figure 56: Asia Pacific Medical Imaging Analysis Software Industry Volume (K Unit), by End User 2025 & 2033
- Figure 57: Asia Pacific Medical Imaging Analysis Software Industry Revenue Share (%), by End User 2025 & 2033
- Figure 58: Asia Pacific Medical Imaging Analysis Software Industry Volume Share (%), by End User 2025 & 2033
- Figure 59: Asia Pacific Medical Imaging Analysis Software Industry Revenue (billion), by Country 2025 & 2033
- Figure 60: Asia Pacific Medical Imaging Analysis Software Industry Volume (K Unit), by Country 2025 & 2033
- Figure 61: Asia Pacific Medical Imaging Analysis Software Industry Revenue Share (%), by Country 2025 & 2033
- Figure 62: Asia Pacific Medical Imaging Analysis Software Industry Volume Share (%), by Country 2025 & 2033
- Figure 63: Middle East and Africa Medical Imaging Analysis Software Industry Revenue (billion), by Image Type 2025 & 2033
- Figure 64: Middle East and Africa Medical Imaging Analysis Software Industry Volume (K Unit), by Image Type 2025 & 2033
- Figure 65: Middle East and Africa Medical Imaging Analysis Software Industry Revenue Share (%), by Image Type 2025 & 2033
- Figure 66: Middle East and Africa Medical Imaging Analysis Software Industry Volume Share (%), by Image Type 2025 & 2033
- Figure 67: Middle East and Africa Medical Imaging Analysis Software Industry Revenue (billion), by Modality 2025 & 2033
- Figure 68: Middle East and Africa Medical Imaging Analysis Software Industry Volume (K Unit), by Modality 2025 & 2033
- Figure 69: Middle East and Africa Medical Imaging Analysis Software Industry Revenue Share (%), by Modality 2025 & 2033
- Figure 70: Middle East and Africa Medical Imaging Analysis Software Industry Volume Share (%), by Modality 2025 & 2033
- Figure 71: Middle East and Africa Medical Imaging Analysis Software Industry Revenue (billion), by Software Type 2025 & 2033
- Figure 72: Middle East and Africa Medical Imaging Analysis Software Industry Volume (K Unit), by Software Type 2025 & 2033
- Figure 73: Middle East and Africa Medical Imaging Analysis Software Industry Revenue Share (%), by Software Type 2025 & 2033
- Figure 74: Middle East and Africa Medical Imaging Analysis Software Industry Volume Share (%), by Software Type 2025 & 2033
- Figure 75: Middle East and Africa Medical Imaging Analysis Software Industry Revenue (billion), by End User 2025 & 2033
- Figure 76: Middle East and Africa Medical Imaging Analysis Software Industry Volume (K Unit), by End User 2025 & 2033
- Figure 77: Middle East and Africa Medical Imaging Analysis Software Industry Revenue Share (%), by End User 2025 & 2033
- Figure 78: Middle East and Africa Medical Imaging Analysis Software Industry Volume Share (%), by End User 2025 & 2033
- Figure 79: Middle East and Africa Medical Imaging Analysis Software Industry Revenue (billion), by Country 2025 & 2033
- Figure 80: Middle East and Africa Medical Imaging Analysis Software Industry Volume (K Unit), by Country 2025 & 2033
- Figure 81: Middle East and Africa Medical Imaging Analysis Software Industry Revenue Share (%), by Country 2025 & 2033
- Figure 82: Middle East and Africa Medical Imaging Analysis Software Industry Volume Share (%), by Country 2025 & 2033
- Figure 83: South America Medical Imaging Analysis Software Industry Revenue (billion), by Image Type 2025 & 2033
- Figure 84: South America Medical Imaging Analysis Software Industry Volume (K Unit), by Image Type 2025 & 2033
- Figure 85: South America Medical Imaging Analysis Software Industry Revenue Share (%), by Image Type 2025 & 2033
- Figure 86: South America Medical Imaging Analysis Software Industry Volume Share (%), by Image Type 2025 & 2033
- Figure 87: South America Medical Imaging Analysis Software Industry Revenue (billion), by Modality 2025 & 2033
- Figure 88: South America Medical Imaging Analysis Software Industry Volume (K Unit), by Modality 2025 & 2033
- Figure 89: South America Medical Imaging Analysis Software Industry Revenue Share (%), by Modality 2025 & 2033
- Figure 90: South America Medical Imaging Analysis Software Industry Volume Share (%), by Modality 2025 & 2033
- Figure 91: South America Medical Imaging Analysis Software Industry Revenue (billion), by Software Type 2025 & 2033
- Figure 92: South America Medical Imaging Analysis Software Industry Volume (K Unit), by Software Type 2025 & 2033
- Figure 93: South America Medical Imaging Analysis Software Industry Revenue Share (%), by Software Type 2025 & 2033
- Figure 94: South America Medical Imaging Analysis Software Industry Volume Share (%), by Software Type 2025 & 2033
- Figure 95: South America Medical Imaging Analysis Software Industry Revenue (billion), by End User 2025 & 2033
- Figure 96: South America Medical Imaging Analysis Software Industry Volume (K Unit), by End User 2025 & 2033
- Figure 97: South America Medical Imaging Analysis Software Industry Revenue Share (%), by End User 2025 & 2033
- Figure 98: South America Medical Imaging Analysis Software Industry Volume Share (%), by End User 2025 & 2033
- Figure 99: South America Medical Imaging Analysis Software Industry Revenue (billion), by Country 2025 & 2033
- Figure 100: South America Medical Imaging Analysis Software Industry Volume (K Unit), by Country 2025 & 2033
- Figure 101: South America Medical Imaging Analysis Software Industry Revenue Share (%), by Country 2025 & 2033
- Figure 102: South America Medical Imaging Analysis Software Industry Volume Share (%), by Country 2025 & 2033
List of Tables
- Table 1: Global Medical Imaging Analysis Software Industry Revenue billion Forecast, by Image Type 2020 & 2033
- Table 2: Global Medical Imaging Analysis Software Industry Volume K Unit Forecast, by Image Type 2020 & 2033
- Table 3: Global Medical Imaging Analysis Software Industry Revenue billion Forecast, by Modality 2020 & 2033
- Table 4: Global Medical Imaging Analysis Software Industry Volume K Unit Forecast, by Modality 2020 & 2033
- Table 5: Global Medical Imaging Analysis Software Industry Revenue billion Forecast, by Software Type 2020 & 2033
- Table 6: Global Medical Imaging Analysis Software Industry Volume K Unit Forecast, by Software Type 2020 & 2033
- Table 7: Global Medical Imaging Analysis Software Industry Revenue billion Forecast, by End User 2020 & 2033
- Table 8: Global Medical Imaging Analysis Software Industry Volume K Unit Forecast, by End User 2020 & 2033
- Table 9: Global Medical Imaging Analysis Software Industry Revenue billion Forecast, by Region 2020 & 2033
- Table 10: Global Medical Imaging Analysis Software Industry Volume K Unit Forecast, by Region 2020 & 2033
- Table 11: Global Medical Imaging Analysis Software Industry Revenue billion Forecast, by Image Type 2020 & 2033
- Table 12: Global Medical Imaging Analysis Software Industry Volume K Unit Forecast, by Image Type 2020 & 2033
- Table 13: Global Medical Imaging Analysis Software Industry Revenue billion Forecast, by Modality 2020 & 2033
- Table 14: Global Medical Imaging Analysis Software Industry Volume K Unit Forecast, by Modality 2020 & 2033
- Table 15: Global Medical Imaging Analysis Software Industry Revenue billion Forecast, by Software Type 2020 & 2033
- Table 16: Global Medical Imaging Analysis Software Industry Volume K Unit Forecast, by Software Type 2020 & 2033
- Table 17: Global Medical Imaging Analysis Software Industry Revenue billion Forecast, by End User 2020 & 2033
- Table 18: Global Medical Imaging Analysis Software Industry Volume K Unit Forecast, by End User 2020 & 2033
- Table 19: Global Medical Imaging Analysis Software Industry Revenue billion Forecast, by Country 2020 & 2033
- Table 20: Global Medical Imaging Analysis Software Industry Volume K Unit Forecast, by Country 2020 & 2033
- Table 21: United States Medical Imaging Analysis Software Industry Revenue (billion) Forecast, by Application 2020 & 2033
- Table 22: United States Medical Imaging Analysis Software Industry Volume (K Unit) Forecast, by Application 2020 & 2033
- Table 23: Canada Medical Imaging Analysis Software Industry Revenue (billion) Forecast, by Application 2020 & 2033
- Table 24: Canada Medical Imaging Analysis Software Industry Volume (K Unit) Forecast, by Application 2020 & 2033
- Table 25: Mexico Medical Imaging Analysis Software Industry Revenue (billion) Forecast, by Application 2020 & 2033
- Table 26: Mexico Medical Imaging Analysis Software Industry Volume (K Unit) Forecast, by Application 2020 & 2033
- Table 27: Global Medical Imaging Analysis Software Industry Revenue billion Forecast, by Image Type 2020 & 2033
- Table 28: Global Medical Imaging Analysis Software Industry Volume K Unit Forecast, by Image Type 2020 & 2033
- Table 29: Global Medical Imaging Analysis Software Industry Revenue billion Forecast, by Modality 2020 & 2033
- Table 30: Global Medical Imaging Analysis Software Industry Volume K Unit Forecast, by Modality 2020 & 2033
- Table 31: Global Medical Imaging Analysis Software Industry Revenue billion Forecast, by Software Type 2020 & 2033
- Table 32: Global Medical Imaging Analysis Software Industry Volume K Unit Forecast, by Software Type 2020 & 2033
- Table 33: Global Medical Imaging Analysis Software Industry Revenue billion Forecast, by End User 2020 & 2033
- Table 34: Global Medical Imaging Analysis Software Industry Volume K Unit Forecast, by End User 2020 & 2033
- Table 35: Global Medical Imaging Analysis Software Industry Revenue billion Forecast, by Country 2020 & 2033
- Table 36: Global Medical Imaging Analysis Software Industry Volume K Unit Forecast, by Country 2020 & 2033
- Table 37: Germany Medical Imaging Analysis Software Industry Revenue (billion) Forecast, by Application 2020 & 2033
- Table 38: Germany Medical Imaging Analysis Software Industry Volume (K Unit) Forecast, by Application 2020 & 2033
- Table 39: United Kingdom Medical Imaging Analysis Software Industry Revenue (billion) Forecast, by Application 2020 & 2033
- Table 40: United Kingdom Medical Imaging Analysis Software Industry Volume (K Unit) Forecast, by Application 2020 & 2033
- Table 41: France Medical Imaging Analysis Software Industry Revenue (billion) Forecast, by Application 2020 & 2033
- Table 42: France Medical Imaging Analysis Software Industry Volume (K Unit) Forecast, by Application 2020 & 2033
- Table 43: Italy Medical Imaging Analysis Software Industry Revenue (billion) Forecast, by Application 2020 & 2033
- Table 44: Italy Medical Imaging Analysis Software Industry Volume (K Unit) Forecast, by Application 2020 & 2033
- Table 45: Spain Medical Imaging Analysis Software Industry Revenue (billion) Forecast, by Application 2020 & 2033
- Table 46: Spain Medical Imaging Analysis Software Industry Volume (K Unit) Forecast, by Application 2020 & 2033
- Table 47: Rest of Europe Medical Imaging Analysis Software Industry Revenue (billion) Forecast, by Application 2020 & 2033
- Table 48: Rest of Europe Medical Imaging Analysis Software Industry Volume (K Unit) Forecast, by Application 2020 & 2033
- Table 49: Global Medical Imaging Analysis Software Industry Revenue billion Forecast, by Image Type 2020 & 2033
- Table 50: Global Medical Imaging Analysis Software Industry Volume K Unit Forecast, by Image Type 2020 & 2033
- Table 51: Global Medical Imaging Analysis Software Industry Revenue billion Forecast, by Modality 2020 & 2033
- Table 52: Global Medical Imaging Analysis Software Industry Volume K Unit Forecast, by Modality 2020 & 2033
- Table 53: Global Medical Imaging Analysis Software Industry Revenue billion Forecast, by Software Type 2020 & 2033
- Table 54: Global Medical Imaging Analysis Software Industry Volume K Unit Forecast, by Software Type 2020 & 2033
- Table 55: Global Medical Imaging Analysis Software Industry Revenue billion Forecast, by End User 2020 & 2033
- Table 56: Global Medical Imaging Analysis Software Industry Volume K Unit Forecast, by End User 2020 & 2033
- Table 57: Global Medical Imaging Analysis Software Industry Revenue billion Forecast, by Country 2020 & 2033
- Table 58: Global Medical Imaging Analysis Software Industry Volume K Unit Forecast, by Country 2020 & 2033
- Table 59: China Medical Imaging Analysis Software Industry Revenue (billion) Forecast, by Application 2020 & 2033
- Table 60: China Medical Imaging Analysis Software Industry Volume (K Unit) Forecast, by Application 2020 & 2033
- Table 61: Japan Medical Imaging Analysis Software Industry Revenue (billion) Forecast, by Application 2020 & 2033
- Table 62: Japan Medical Imaging Analysis Software Industry Volume (K Unit) Forecast, by Application 2020 & 2033
- Table 63: India Medical Imaging Analysis Software Industry Revenue (billion) Forecast, by Application 2020 & 2033
- Table 64: India Medical Imaging Analysis Software Industry Volume (K Unit) Forecast, by Application 2020 & 2033
- Table 65: Australia Medical Imaging Analysis Software Industry Revenue (billion) Forecast, by Application 2020 & 2033
- Table 66: Australia Medical Imaging Analysis Software Industry Volume (K Unit) Forecast, by Application 2020 & 2033
- Table 67: South Korea Medical Imaging Analysis Software Industry Revenue (billion) Forecast, by Application 2020 & 2033
- Table 68: South Korea Medical Imaging Analysis Software Industry Volume (K Unit) Forecast, by Application 2020 & 2033
- Table 69: Rest of Asia Pacific Medical Imaging Analysis Software Industry Revenue (billion) Forecast, by Application 2020 & 2033
- Table 70: Rest of Asia Pacific Medical Imaging Analysis Software Industry Volume (K Unit) Forecast, by Application 2020 & 2033
- Table 71: Global Medical Imaging Analysis Software Industry Revenue billion Forecast, by Image Type 2020 & 2033
- Table 72: Global Medical Imaging Analysis Software Industry Volume K Unit Forecast, by Image Type 2020 & 2033
- Table 73: Global Medical Imaging Analysis Software Industry Revenue billion Forecast, by Modality 2020 & 2033
- Table 74: Global Medical Imaging Analysis Software Industry Volume K Unit Forecast, by Modality 2020 & 2033
- Table 75: Global Medical Imaging Analysis Software Industry Revenue billion Forecast, by Software Type 2020 & 2033
- Table 76: Global Medical Imaging Analysis Software Industry Volume K Unit Forecast, by Software Type 2020 & 2033
- Table 77: Global Medical Imaging Analysis Software Industry Revenue billion Forecast, by End User 2020 & 2033
- Table 78: Global Medical Imaging Analysis Software Industry Volume K Unit Forecast, by End User 2020 & 2033
- Table 79: Global Medical Imaging Analysis Software Industry Revenue billion Forecast, by Country 2020 & 2033
- Table 80: Global Medical Imaging Analysis Software Industry Volume K Unit Forecast, by Country 2020 & 2033
- Table 81: GCC Medical Imaging Analysis Software Industry Revenue (billion) Forecast, by Application 2020 & 2033
- Table 82: GCC Medical Imaging Analysis Software Industry Volume (K Unit) Forecast, by Application 2020 & 2033
- Table 83: South Africa Medical Imaging Analysis Software Industry Revenue (billion) Forecast, by Application 2020 & 2033
- Table 84: South Africa Medical Imaging Analysis Software Industry Volume (K Unit) Forecast, by Application 2020 & 2033
- Table 85: Rest of Middle East and Africa Medical Imaging Analysis Software Industry Revenue (billion) Forecast, by Application 2020 & 2033
- Table 86: Rest of Middle East and Africa Medical Imaging Analysis Software Industry Volume (K Unit) Forecast, by Application 2020 & 2033
- Table 87: Global Medical Imaging Analysis Software Industry Revenue billion Forecast, by Image Type 2020 & 2033
- Table 88: Global Medical Imaging Analysis Software Industry Volume K Unit Forecast, by Image Type 2020 & 2033
- Table 89: Global Medical Imaging Analysis Software Industry Revenue billion Forecast, by Modality 2020 & 2033
- Table 90: Global Medical Imaging Analysis Software Industry Volume K Unit Forecast, by Modality 2020 & 2033
- Table 91: Global Medical Imaging Analysis Software Industry Revenue billion Forecast, by Software Type 2020 & 2033
- Table 92: Global Medical Imaging Analysis Software Industry Volume K Unit Forecast, by Software Type 2020 & 2033
- Table 93: Global Medical Imaging Analysis Software Industry Revenue billion Forecast, by End User 2020 & 2033
- Table 94: Global Medical Imaging Analysis Software Industry Volume K Unit Forecast, by End User 2020 & 2033
- Table 95: Global Medical Imaging Analysis Software Industry Revenue billion Forecast, by Country 2020 & 2033
- Table 96: Global Medical Imaging Analysis Software Industry Volume K Unit Forecast, by Country 2020 & 2033
- Table 97: Brazil Medical Imaging Analysis Software Industry Revenue (billion) Forecast, by Application 2020 & 2033
- Table 98: Brazil Medical Imaging Analysis Software Industry Volume (K Unit) Forecast, by Application 2020 & 2033
- Table 99: Argentina Medical Imaging Analysis Software Industry Revenue (billion) Forecast, by Application 2020 & 2033
- Table 100: Argentina Medical Imaging Analysis Software Industry Volume (K Unit) Forecast, by Application 2020 & 2033
- Table 101: Rest of South America Medical Imaging Analysis Software Industry Revenue (billion) Forecast, by Application 2020 & 2033
- Table 102: Rest of South America Medical Imaging Analysis Software Industry Volume (K Unit) Forecast, by Application 2020 & 2033
Frequently Asked Questions
1. What is the projected Compound Annual Growth Rate (CAGR) of the Medical Imaging Analysis Software Industry?
The projected CAGR is approximately 5.1%.
2. Which companies are prominent players in the Medical Imaging Analysis Software Industry?
Key companies in the market include Siemens Healthcare GmbH, ScienceSoft USA Corporation, RamSoft Inc, Synapsica Healthcare Pvt Ltd, Intelerad Medical Systems Incorporated, Carestream Health, Xinapse Systems Ltd, General Electric Company (GE Healthcare), Canon Inc (Canon Medical Systems USA), Koninklijke Philips NV, International Business Machines Corporation (IBM), AQUILAB SAS, Agfa-Gevaert Group.
3. What are the main segments of the Medical Imaging Analysis Software Industry?
The market segments include Image Type, Modality, Software Type, End User.
4. Can you provide details about the market size?
The market size is estimated to be USD 43.5 billion as of 2022.
5. What are some drivers contributing to market growth?
Technological Advancements in Medical Imaging Systems and Analysis Software; Increasing Usage of Imaging Equipment Due to Rising Prevalence of Chronic Diseases; Rising Applications of Computer-aided Diagnosis.
6. What are the notable trends driving market growth?
The X-ray Imaging Segment is Expected to Witness Significant Growth Over the Forecast Period.
7. Are there any restraints impacting market growth?
Budgetary Constraints.
8. Can you provide examples of recent developments in the market?
In July 2022, Siemens Healthineers, a medical technology company, officially integrated Subtle Medical's SubtleMR image-enhancement software into the new reconstruction pipeline of Siemens Healthineers, Open Recon. SubtleMR offers DL (deep learning) post-processing for denoising and increased sharpness on faster MRI sequences, enabling improved image quality, optimized workflow, and a better patient experience.
9. What pricing options are available for accessing the report?
Pricing options include single-user, multi-user, and enterprise licenses priced at USD 4750, USD 5250, and USD 8750 respectively.
10. Is the market size provided in terms of value or volume?
The market size is provided in terms of value, measured in billion and volume, measured in K Unit.
11. Are there any specific market keywords associated with the report?
Yes, the market keyword associated with the report is "Medical Imaging Analysis Software Industry," which aids in identifying and referencing the specific market segment covered.
12. How do I determine which pricing option suits my needs best?
The pricing options vary based on user requirements and access needs. Individual users may opt for single-user licenses, while businesses requiring broader access may choose multi-user or enterprise licenses for cost-effective access to the report.
13. Are there any additional resources or data provided in the Medical Imaging Analysis Software Industry report?
While the report offers comprehensive insights, it's advisable to review the specific contents or supplementary materials provided to ascertain if additional resources or data are available.
14. How can I stay updated on further developments or reports in the Medical Imaging Analysis Software Industry?
To stay informed about further developments, trends, and reports in the Medical Imaging Analysis Software Industry, consider subscribing to industry newsletters, following relevant companies and organizations, or regularly checking reputable industry news sources and publications.
Methodology
Step 1 - Identification of Relevant Samples Size from Population Database


Step 2 - Approaches for Defining Global Market Size (Value, Volume* & Price*)

Note*: In applicable scenarios
Step 3 - Data Sources
Primary Research
- Web Analytics
- Survey Reports
- Research Institute
- Latest Research Reports
- Opinion Leaders
Secondary Research
- Annual Reports
- White Paper
- Latest Press Release
- Industry Association
- Paid Database
- Investor Presentations

Step 4 - Data Triangulation
Involves using different sources of information in order to increase the validity of a study
These sources are likely to be stakeholders in a program - participants, other researchers, program staff, other community members, and so on.
Then we put all data in single framework & apply various statistical tools to find out the dynamic on the market.
During the analysis stage, feedback from the stakeholder groups would be compared to determine areas of agreement as well as areas of divergence