

Key Insights
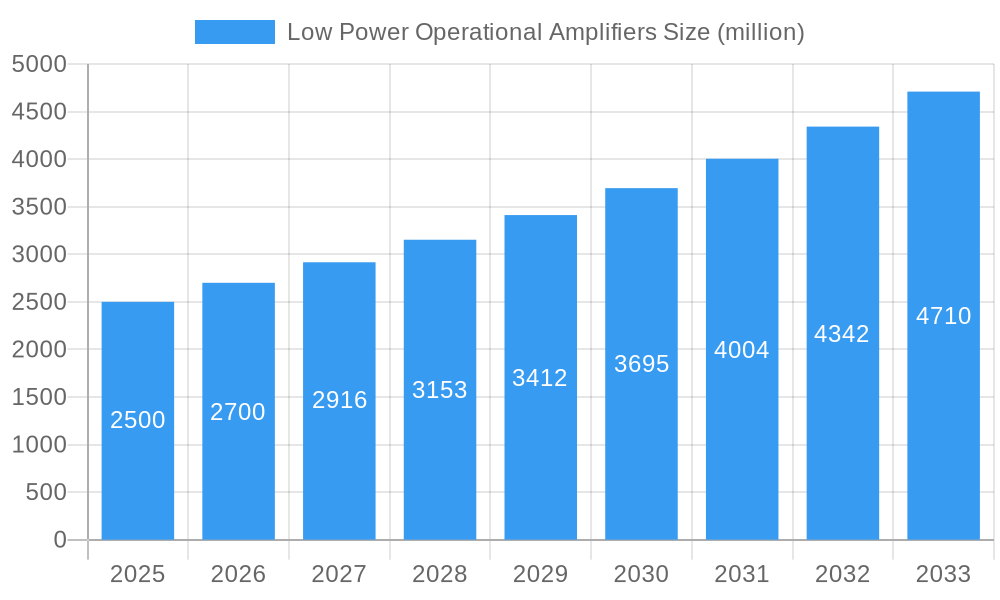
The low-power operational amplifier (op-amp) market is experiencing robust growth, driven by the increasing demand for energy-efficient electronics across various sectors. The market, estimated at $2.5 billion in 2025, is projected to exhibit a Compound Annual Growth Rate (CAGR) of 8% from 2025 to 2033, reaching approximately $4.2 billion by 2033. This growth is fueled by several key factors, including the proliferation of portable and wearable devices, the rise of the Internet of Things (IoT), and the increasing adoption of energy-harvesting technologies. Miniaturization trends in electronics, coupled with the need for longer battery life, are further bolstering demand for low-power op-amps. Leading manufacturers such as Analog Devices, Texas Instruments, and Maxim Integrated are heavily investing in research and development to improve performance, reduce power consumption, and expand their product portfolios to cater to this expanding market. The automotive, healthcare, and industrial automation sectors are significant contributors to this growth, with demand for low-power op-amps increasing in applications like sensor interfaces, data acquisition systems, and power management units.
Low Power Operational Amplifiers Market Size (In Billion)
Competition in the low-power op-amp market is intense, with established players facing challenges from emerging regional manufacturers. While companies like Analog Devices and Texas Instruments maintain a significant market share due to their established brand reputation and technological expertise, smaller companies are focusing on niche applications and cost-effective solutions, creating a dynamic market landscape. Future growth will likely be influenced by advancements in semiconductor technology, the development of more energy-efficient designs, and the emergence of new applications in areas like artificial intelligence and 5G infrastructure. Continued innovation in low-power design techniques, particularly in areas like ultra-low-power consumption and improved noise performance, will be crucial for companies seeking to maintain a competitive edge in this rapidly evolving market.
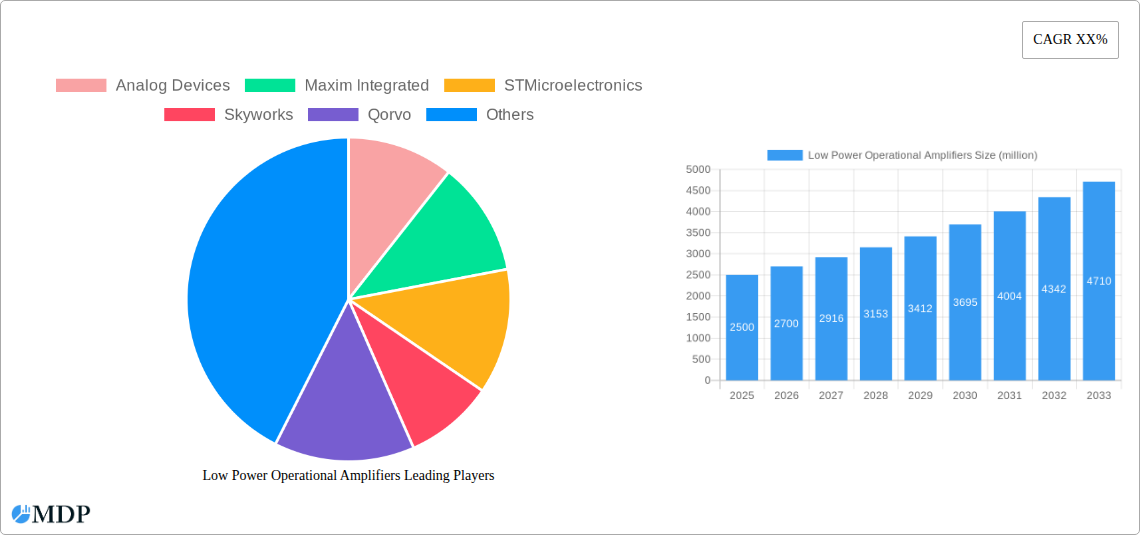
Low Power Operational Amplifiers Company Market Share
Low Power Operational Amplifiers Market Report: 2019-2033 - A Comprehensive Analysis
This comprehensive report provides an in-depth analysis of the global Low Power Operational Amplifiers market, projecting a market value exceeding $XX million by 2033. The study covers the period from 2019 to 2033, with a base year of 2025 and a forecast period of 2025-2033. It offers crucial insights for industry stakeholders, investors, and market entrants seeking to understand this dynamic sector. The report leverages data from the historical period (2019-2024) to provide accurate forecasts and identifies key opportunities within the rapidly evolving landscape. High-growth segments and leading companies like Analog Devices, Maxim Integrated, STMicroelectronics, and Texas Instruments are deeply analyzed.
Low Power Operational Amplifiers Market Dynamics & Concentration
The low power operational amplifier market exhibits a moderately concentrated landscape, with a few major players holding significant market share. Analog Devices, Texas Instruments, and Maxim Integrated collectively control an estimated xx% of the market. However, the market is experiencing increased competition from emerging players, particularly in Asia. Market concentration is influenced by factors such as technological innovation, robust intellectual property portfolios, and established distribution networks. The market has witnessed a notable increase in M&A activity in recent years, with an estimated xx million deals closed during the 2019-2024 period, largely driven by the consolidation of smaller players and expansion into new geographical markets.
- Innovation Drivers: Miniaturization, improved power efficiency, and advanced functionalities drive market growth.
- Regulatory Frameworks: Compliance requirements (e.g., environmental regulations) impact manufacturing and product design.
- Product Substitutes: The emergence of alternative technologies presents challenges but also fosters innovation.
- End-User Trends: The increasing demand for low-power electronics in portable devices and IoT applications fuels market expansion.
- M&A Activities: Consolidation among key players leads to increased market concentration and technological advancements.
Low Power Operational Amplifiers Industry Trends & Analysis
The low power operational amplifier market is experiencing robust growth, driven primarily by the proliferation of portable electronics, the Internet of Things (IoT), and the increasing demand for energy-efficient solutions. The Compound Annual Growth Rate (CAGR) during the forecast period (2025-2033) is projected to be xx%, exceeding $xx million in market value by 2033. Technological disruptions, such as the development of advanced process technologies and the integration of functionalities, are reshaping the competitive landscape. Consumer preferences for smaller, more energy-efficient devices are fueling demand. The market penetration of low-power operational amplifiers in diverse applications is steadily increasing. Competitive dynamics are characterized by ongoing product innovation, strategic partnerships, and efforts to reduce costs.
Leading Markets & Segments in Low Power Operational Amplifiers
The Asia-Pacific region is currently the dominant market for low-power operational amplifiers, representing an estimated xx% of the global market in 2025. This dominance is primarily driven by the region's robust electronics manufacturing sector, the growing consumer electronics market, and supportive government policies promoting technological advancement. China, in particular, is a major contributor to market growth.
- Key Drivers in Asia-Pacific:
- Rapid growth of the consumer electronics industry.
- Significant investments in infrastructure development.
- Government initiatives promoting technological advancements.
- Large-scale manufacturing capabilities.
The automotive segment is also a significant growth driver due to the increasing adoption of advanced driver-assistance systems (ADAS) and electric vehicles. Other key segments include industrial automation, medical devices, and aerospace applications.
Low Power Operational Amplifiers Product Developments
Recent product innovations focus on reducing power consumption further, improving accuracy, and enhancing operational range. New designs incorporate advanced technologies such as low-voltage operation, ultra-low noise performance, and improved temperature stability. These advancements cater to the rising demand for smaller, more energy-efficient, and higher-performance devices across various applications. The increasing integration of functionalities enhances system-level performance and simplifies design complexity. Strong market fit is secured through the customization of these amplifiers for various applications, emphasizing cost-effectiveness and ease of integration.
Key Drivers of Low Power Operational Amplifiers Growth
The growth of the low-power operational amplifier market is driven by a convergence of factors, including the explosive growth of the IoT, the increasing demand for energy-efficient electronic devices in portable applications (wearables, smartphones), and stringent environmental regulations promoting energy conservation. Advances in semiconductor technology enable the production of smaller, more efficient amplifiers. The rising adoption of electric vehicles also contributes significantly to market expansion due to the need for advanced power management systems.
Challenges in the Low Power Operational Amplifiers Market
The market faces challenges like supply chain disruptions and the increasing complexity of regulatory compliance. Fluctuations in raw material prices and geopolitical instability can impact manufacturing costs and lead times. Intense competition from emerging players requires continuous innovation and adaptation. Meeting stringent industry standards and certifications for specific applications can also present hurdles. These factors collectively contribute to market instability and can impede projected growth rates. The overall impact of these challenges on market revenue is estimated at xx million annually.
Emerging Opportunities in Low Power Operational Amplifiers
The long-term growth of the low-power operational amplifier market is poised for significant expansion driven by several factors. The development of advanced materials and process technologies will lead to even more efficient devices. Strategic partnerships among key players in the semiconductor industry will accelerate innovation and market penetration. The expansion into new markets, particularly in developing economies with burgeoning electronics sectors, presents substantial growth potential. These factors collectively pave the way for a sustained period of expansion within the market.
Leading Players in the Low Power Operational Amplifiers Sector
- Analog Devices
- Maxim Integrated
- STMicroelectronics
- Skyworks
- Qorvo
- Texas Instruments
- Microchip Technology
- ROHM Semiconductor GmbH
- Shenzhen Jxsq Technology Development
- Sanway Audio Equipment
- Shenzhen Semicon Electronics Technology
- Dongguan Merry Electronic
- SGMICRO
Key Milestones in Low Power Operational Amplifiers Industry
- 2020: Introduction of xx-nm process technology by several leading manufacturers, significantly improving power efficiency.
- 2022: A major merger between two key players in the market, leading to increased market concentration.
- 2023: Significant expansion of the low-power amplifier market into new emerging applications within the IoT sector.
- 2024: Launch of several new ultra-low power operational amplifiers targeting high-growth segments, such as wearables.
Strategic Outlook for Low Power Operational Amplifiers Market
The future of the low-power operational amplifier market is promising, driven by ongoing technological advancements, increasing demand from various sectors, and expansion into new applications. Strategic investments in R&D, coupled with strategic partnerships and mergers and acquisitions, will be crucial to maintaining a competitive edge and capitalizing on emerging opportunities. The market is expected to experience sustained growth, with significant potential for expansion in diverse sectors, including the rapidly expanding markets of the IoT and electric vehicles. Continuous innovation and adaptation will be pivotal for companies seeking to thrive in this dynamic market environment.
Low Power Operational Amplifiers Segmentation
-
1. Application
- 1.1. Consumer Electronics
- 1.2. Telecommunications and Datacom
- 1.3. Medical
- 1.4. Automotive
- 1.5. Others
-
2. Types
- 2.1. High Speed
- 2.2. Medium Speed
- 2.3. Low Speed
Low Power Operational Amplifiers Segmentation By Geography
-
1. North America
- 1.1. United States
- 1.2. Canada
- 1.3. Mexico
-
2. South America
- 2.1. Brazil
- 2.2. Argentina
- 2.3. Rest of South America
-
3. Europe
- 3.1. United Kingdom
- 3.2. Germany
- 3.3. France
- 3.4. Italy
- 3.5. Spain
- 3.6. Russia
- 3.7. Benelux
- 3.8. Nordics
- 3.9. Rest of Europe
-
4. Middle East & Africa
- 4.1. Turkey
- 4.2. Israel
- 4.3. GCC
- 4.4. North Africa
- 4.5. South Africa
- 4.6. Rest of Middle East & Africa
-
5. Asia Pacific
- 5.1. China
- 5.2. India
- 5.3. Japan
- 5.4. South Korea
- 5.5. ASEAN
- 5.6. Oceania
- 5.7. Rest of Asia Pacific
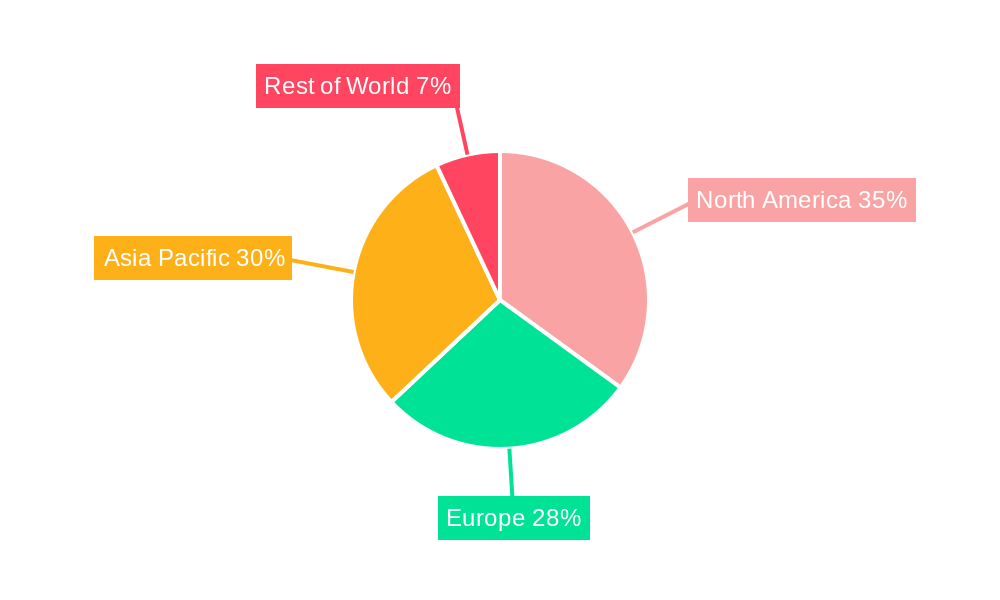
Low Power Operational Amplifiers Regional Market Share
Geographic Coverage of Low Power Operational Amplifiers
Low Power Operational Amplifiers REPORT HIGHLIGHTS
| Aspects | Details |
|---|---|
| Study Period | 2020-2034 |
| Base Year | 2025 |
| Estimated Year | 2026 |
| Forecast Period | 2026-2034 |
| Historical Period | 2020-2025 |
| Growth Rate | CAGR of 14.11% from 2020-2034 |
| Segmentation |
|
Table of Contents
- 1. Introduction
- 1.1. Research Scope
- 1.2. Market Segmentation
- 1.3. Research Methodology
- 1.4. Definitions and Assumptions
- 2. Executive Summary
- 2.1. Introduction
- 3. Market Dynamics
- 3.1. Introduction
- 3.2. Market Drivers
- 3.3. Market Restrains
- 3.4. Market Trends
- 4. Market Factor Analysis
- 4.1. Porters Five Forces
- 4.2. Supply/Value Chain
- 4.3. PESTEL analysis
- 4.4. Market Entropy
- 4.5. Patent/Trademark Analysis
- 5. Global Low Power Operational Amplifiers Analysis, Insights and Forecast, 2020-2032
- 5.1. Market Analysis, Insights and Forecast - by Application
- 5.1.1. Consumer Electronics
- 5.1.2. Telecommunications and Datacom
- 5.1.3. Medical
- 5.1.4. Automotive
- 5.1.5. Others
- 5.2. Market Analysis, Insights and Forecast - by Types
- 5.2.1. High Speed
- 5.2.2. Medium Speed
- 5.2.3. Low Speed
- 5.3. Market Analysis, Insights and Forecast - by Region
- 5.3.1. North America
- 5.3.2. South America
- 5.3.3. Europe
- 5.3.4. Middle East & Africa
- 5.3.5. Asia Pacific
- 5.1. Market Analysis, Insights and Forecast - by Application
- 6. North America Low Power Operational Amplifiers Analysis, Insights and Forecast, 2020-2032
- 6.1. Market Analysis, Insights and Forecast - by Application
- 6.1.1. Consumer Electronics
- 6.1.2. Telecommunications and Datacom
- 6.1.3. Medical
- 6.1.4. Automotive
- 6.1.5. Others
- 6.2. Market Analysis, Insights and Forecast - by Types
- 6.2.1. High Speed
- 6.2.2. Medium Speed
- 6.2.3. Low Speed
- 6.1. Market Analysis, Insights and Forecast - by Application
- 7. South America Low Power Operational Amplifiers Analysis, Insights and Forecast, 2020-2032
- 7.1. Market Analysis, Insights and Forecast - by Application
- 7.1.1. Consumer Electronics
- 7.1.2. Telecommunications and Datacom
- 7.1.3. Medical
- 7.1.4. Automotive
- 7.1.5. Others
- 7.2. Market Analysis, Insights and Forecast - by Types
- 7.2.1. High Speed
- 7.2.2. Medium Speed
- 7.2.3. Low Speed
- 7.1. Market Analysis, Insights and Forecast - by Application
- 8. Europe Low Power Operational Amplifiers Analysis, Insights and Forecast, 2020-2032
- 8.1. Market Analysis, Insights and Forecast - by Application
- 8.1.1. Consumer Electronics
- 8.1.2. Telecommunications and Datacom
- 8.1.3. Medical
- 8.1.4. Automotive
- 8.1.5. Others
- 8.2. Market Analysis, Insights and Forecast - by Types
- 8.2.1. High Speed
- 8.2.2. Medium Speed
- 8.2.3. Low Speed
- 8.1. Market Analysis, Insights and Forecast - by Application
- 9. Middle East & Africa Low Power Operational Amplifiers Analysis, Insights and Forecast, 2020-2032
- 9.1. Market Analysis, Insights and Forecast - by Application
- 9.1.1. Consumer Electronics
- 9.1.2. Telecommunications and Datacom
- 9.1.3. Medical
- 9.1.4. Automotive
- 9.1.5. Others
- 9.2. Market Analysis, Insights and Forecast - by Types
- 9.2.1. High Speed
- 9.2.2. Medium Speed
- 9.2.3. Low Speed
- 9.1. Market Analysis, Insights and Forecast - by Application
- 10. Asia Pacific Low Power Operational Amplifiers Analysis, Insights and Forecast, 2020-2032
- 10.1. Market Analysis, Insights and Forecast - by Application
- 10.1.1. Consumer Electronics
- 10.1.2. Telecommunications and Datacom
- 10.1.3. Medical
- 10.1.4. Automotive
- 10.1.5. Others
- 10.2. Market Analysis, Insights and Forecast - by Types
- 10.2.1. High Speed
- 10.2.2. Medium Speed
- 10.2.3. Low Speed
- 10.1. Market Analysis, Insights and Forecast - by Application
- 11. Competitive Analysis
- 11.1. Global Market Share Analysis 2025
- 11.2. Company Profiles
- 11.2.1 Analog Devices
- 11.2.1.1. Overview
- 11.2.1.2. Products
- 11.2.1.3. SWOT Analysis
- 11.2.1.4. Recent Developments
- 11.2.1.5. Financials (Based on Availability)
- 11.2.2 Maxim Integrated
- 11.2.2.1. Overview
- 11.2.2.2. Products
- 11.2.2.3. SWOT Analysis
- 11.2.2.4. Recent Developments
- 11.2.2.5. Financials (Based on Availability)
- 11.2.3 STMicroelectronics
- 11.2.3.1. Overview
- 11.2.3.2. Products
- 11.2.3.3. SWOT Analysis
- 11.2.3.4. Recent Developments
- 11.2.3.5. Financials (Based on Availability)
- 11.2.4 Skyworks
- 11.2.4.1. Overview
- 11.2.4.2. Products
- 11.2.4.3. SWOT Analysis
- 11.2.4.4. Recent Developments
- 11.2.4.5. Financials (Based on Availability)
- 11.2.5 Qorvo
- 11.2.5.1. Overview
- 11.2.5.2. Products
- 11.2.5.3. SWOT Analysis
- 11.2.5.4. Recent Developments
- 11.2.5.5. Financials (Based on Availability)
- 11.2.6 Texas Instruments
- 11.2.6.1. Overview
- 11.2.6.2. Products
- 11.2.6.3. SWOT Analysis
- 11.2.6.4. Recent Developments
- 11.2.6.5. Financials (Based on Availability)
- 11.2.7 Microchip Technology
- 11.2.7.1. Overview
- 11.2.7.2. Products
- 11.2.7.3. SWOT Analysis
- 11.2.7.4. Recent Developments
- 11.2.7.5. Financials (Based on Availability)
- 11.2.8 ROHM Semiconductor GmbH
- 11.2.8.1. Overview
- 11.2.8.2. Products
- 11.2.8.3. SWOT Analysis
- 11.2.8.4. Recent Developments
- 11.2.8.5. Financials (Based on Availability)
- 11.2.9 Shenzhen Jxsq Technology Development
- 11.2.9.1. Overview
- 11.2.9.2. Products
- 11.2.9.3. SWOT Analysis
- 11.2.9.4. Recent Developments
- 11.2.9.5. Financials (Based on Availability)
- 11.2.10 Sanway Audio Equipment
- 11.2.10.1. Overview
- 11.2.10.2. Products
- 11.2.10.3. SWOT Analysis
- 11.2.10.4. Recent Developments
- 11.2.10.5. Financials (Based on Availability)
- 11.2.11 Shenzhen Semicon Electronics Technology
- 11.2.11.1. Overview
- 11.2.11.2. Products
- 11.2.11.3. SWOT Analysis
- 11.2.11.4. Recent Developments
- 11.2.11.5. Financials (Based on Availability)
- 11.2.12 Dongguan Merry Electronic
- 11.2.12.1. Overview
- 11.2.12.2. Products
- 11.2.12.3. SWOT Analysis
- 11.2.12.4. Recent Developments
- 11.2.12.5. Financials (Based on Availability)
- 11.2.13 SGMICRO
- 11.2.13.1. Overview
- 11.2.13.2. Products
- 11.2.13.3. SWOT Analysis
- 11.2.13.4. Recent Developments
- 11.2.13.5. Financials (Based on Availability)
- 11.2.1 Analog Devices
List of Figures
- Figure 1: Global Low Power Operational Amplifiers Revenue Breakdown (undefined, %) by Region 2025 & 2033
- Figure 2: Global Low Power Operational Amplifiers Volume Breakdown (K, %) by Region 2025 & 2033
- Figure 3: North America Low Power Operational Amplifiers Revenue (undefined), by Application 2025 & 2033
- Figure 4: North America Low Power Operational Amplifiers Volume (K), by Application 2025 & 2033
- Figure 5: North America Low Power Operational Amplifiers Revenue Share (%), by Application 2025 & 2033
- Figure 6: North America Low Power Operational Amplifiers Volume Share (%), by Application 2025 & 2033
- Figure 7: North America Low Power Operational Amplifiers Revenue (undefined), by Types 2025 & 2033
- Figure 8: North America Low Power Operational Amplifiers Volume (K), by Types 2025 & 2033
- Figure 9: North America Low Power Operational Amplifiers Revenue Share (%), by Types 2025 & 2033
- Figure 10: North America Low Power Operational Amplifiers Volume Share (%), by Types 2025 & 2033
- Figure 11: North America Low Power Operational Amplifiers Revenue (undefined), by Country 2025 & 2033
- Figure 12: North America Low Power Operational Amplifiers Volume (K), by Country 2025 & 2033
- Figure 13: North America Low Power Operational Amplifiers Revenue Share (%), by Country 2025 & 2033
- Figure 14: North America Low Power Operational Amplifiers Volume Share (%), by Country 2025 & 2033
- Figure 15: South America Low Power Operational Amplifiers Revenue (undefined), by Application 2025 & 2033
- Figure 16: South America Low Power Operational Amplifiers Volume (K), by Application 2025 & 2033
- Figure 17: South America Low Power Operational Amplifiers Revenue Share (%), by Application 2025 & 2033
- Figure 18: South America Low Power Operational Amplifiers Volume Share (%), by Application 2025 & 2033
- Figure 19: South America Low Power Operational Amplifiers Revenue (undefined), by Types 2025 & 2033
- Figure 20: South America Low Power Operational Amplifiers Volume (K), by Types 2025 & 2033
- Figure 21: South America Low Power Operational Amplifiers Revenue Share (%), by Types 2025 & 2033
- Figure 22: South America Low Power Operational Amplifiers Volume Share (%), by Types 2025 & 2033
- Figure 23: South America Low Power Operational Amplifiers Revenue (undefined), by Country 2025 & 2033
- Figure 24: South America Low Power Operational Amplifiers Volume (K), by Country 2025 & 2033
- Figure 25: South America Low Power Operational Amplifiers Revenue Share (%), by Country 2025 & 2033
- Figure 26: South America Low Power Operational Amplifiers Volume Share (%), by Country 2025 & 2033
- Figure 27: Europe Low Power Operational Amplifiers Revenue (undefined), by Application 2025 & 2033
- Figure 28: Europe Low Power Operational Amplifiers Volume (K), by Application 2025 & 2033
- Figure 29: Europe Low Power Operational Amplifiers Revenue Share (%), by Application 2025 & 2033
- Figure 30: Europe Low Power Operational Amplifiers Volume Share (%), by Application 2025 & 2033
- Figure 31: Europe Low Power Operational Amplifiers Revenue (undefined), by Types 2025 & 2033
- Figure 32: Europe Low Power Operational Amplifiers Volume (K), by Types 2025 & 2033
- Figure 33: Europe Low Power Operational Amplifiers Revenue Share (%), by Types 2025 & 2033
- Figure 34: Europe Low Power Operational Amplifiers Volume Share (%), by Types 2025 & 2033
- Figure 35: Europe Low Power Operational Amplifiers Revenue (undefined), by Country 2025 & 2033
- Figure 36: Europe Low Power Operational Amplifiers Volume (K), by Country 2025 & 2033
- Figure 37: Europe Low Power Operational Amplifiers Revenue Share (%), by Country 2025 & 2033
- Figure 38: Europe Low Power Operational Amplifiers Volume Share (%), by Country 2025 & 2033
- Figure 39: Middle East & Africa Low Power Operational Amplifiers Revenue (undefined), by Application 2025 & 2033
- Figure 40: Middle East & Africa Low Power Operational Amplifiers Volume (K), by Application 2025 & 2033
- Figure 41: Middle East & Africa Low Power Operational Amplifiers Revenue Share (%), by Application 2025 & 2033
- Figure 42: Middle East & Africa Low Power Operational Amplifiers Volume Share (%), by Application 2025 & 2033
- Figure 43: Middle East & Africa Low Power Operational Amplifiers Revenue (undefined), by Types 2025 & 2033
- Figure 44: Middle East & Africa Low Power Operational Amplifiers Volume (K), by Types 2025 & 2033
- Figure 45: Middle East & Africa Low Power Operational Amplifiers Revenue Share (%), by Types 2025 & 2033
- Figure 46: Middle East & Africa Low Power Operational Amplifiers Volume Share (%), by Types 2025 & 2033
- Figure 47: Middle East & Africa Low Power Operational Amplifiers Revenue (undefined), by Country 2025 & 2033
- Figure 48: Middle East & Africa Low Power Operational Amplifiers Volume (K), by Country 2025 & 2033
- Figure 49: Middle East & Africa Low Power Operational Amplifiers Revenue Share (%), by Country 2025 & 2033
- Figure 50: Middle East & Africa Low Power Operational Amplifiers Volume Share (%), by Country 2025 & 2033
- Figure 51: Asia Pacific Low Power Operational Amplifiers Revenue (undefined), by Application 2025 & 2033
- Figure 52: Asia Pacific Low Power Operational Amplifiers Volume (K), by Application 2025 & 2033
- Figure 53: Asia Pacific Low Power Operational Amplifiers Revenue Share (%), by Application 2025 & 2033
- Figure 54: Asia Pacific Low Power Operational Amplifiers Volume Share (%), by Application 2025 & 2033
- Figure 55: Asia Pacific Low Power Operational Amplifiers Revenue (undefined), by Types 2025 & 2033
- Figure 56: Asia Pacific Low Power Operational Amplifiers Volume (K), by Types 2025 & 2033
- Figure 57: Asia Pacific Low Power Operational Amplifiers Revenue Share (%), by Types 2025 & 2033
- Figure 58: Asia Pacific Low Power Operational Amplifiers Volume Share (%), by Types 2025 & 2033
- Figure 59: Asia Pacific Low Power Operational Amplifiers Revenue (undefined), by Country 2025 & 2033
- Figure 60: Asia Pacific Low Power Operational Amplifiers Volume (K), by Country 2025 & 2033
- Figure 61: Asia Pacific Low Power Operational Amplifiers Revenue Share (%), by Country 2025 & 2033
- Figure 62: Asia Pacific Low Power Operational Amplifiers Volume Share (%), by Country 2025 & 2033
List of Tables
- Table 1: Global Low Power Operational Amplifiers Revenue undefined Forecast, by Application 2020 & 2033
- Table 2: Global Low Power Operational Amplifiers Volume K Forecast, by Application 2020 & 2033
- Table 3: Global Low Power Operational Amplifiers Revenue undefined Forecast, by Types 2020 & 2033
- Table 4: Global Low Power Operational Amplifiers Volume K Forecast, by Types 2020 & 2033
- Table 5: Global Low Power Operational Amplifiers Revenue undefined Forecast, by Region 2020 & 2033
- Table 6: Global Low Power Operational Amplifiers Volume K Forecast, by Region 2020 & 2033
- Table 7: Global Low Power Operational Amplifiers Revenue undefined Forecast, by Application 2020 & 2033
- Table 8: Global Low Power Operational Amplifiers Volume K Forecast, by Application 2020 & 2033
- Table 9: Global Low Power Operational Amplifiers Revenue undefined Forecast, by Types 2020 & 2033
- Table 10: Global Low Power Operational Amplifiers Volume K Forecast, by Types 2020 & 2033
- Table 11: Global Low Power Operational Amplifiers Revenue undefined Forecast, by Country 2020 & 2033
- Table 12: Global Low Power Operational Amplifiers Volume K Forecast, by Country 2020 & 2033
- Table 13: United States Low Power Operational Amplifiers Revenue (undefined) Forecast, by Application 2020 & 2033
- Table 14: United States Low Power Operational Amplifiers Volume (K) Forecast, by Application 2020 & 2033
- Table 15: Canada Low Power Operational Amplifiers Revenue (undefined) Forecast, by Application 2020 & 2033
- Table 16: Canada Low Power Operational Amplifiers Volume (K) Forecast, by Application 2020 & 2033
- Table 17: Mexico Low Power Operational Amplifiers Revenue (undefined) Forecast, by Application 2020 & 2033
- Table 18: Mexico Low Power Operational Amplifiers Volume (K) Forecast, by Application 2020 & 2033
- Table 19: Global Low Power Operational Amplifiers Revenue undefined Forecast, by Application 2020 & 2033
- Table 20: Global Low Power Operational Amplifiers Volume K Forecast, by Application 2020 & 2033
- Table 21: Global Low Power Operational Amplifiers Revenue undefined Forecast, by Types 2020 & 2033
- Table 22: Global Low Power Operational Amplifiers Volume K Forecast, by Types 2020 & 2033
- Table 23: Global Low Power Operational Amplifiers Revenue undefined Forecast, by Country 2020 & 2033
- Table 24: Global Low Power Operational Amplifiers Volume K Forecast, by Country 2020 & 2033
- Table 25: Brazil Low Power Operational Amplifiers Revenue (undefined) Forecast, by Application 2020 & 2033
- Table 26: Brazil Low Power Operational Amplifiers Volume (K) Forecast, by Application 2020 & 2033
- Table 27: Argentina Low Power Operational Amplifiers Revenue (undefined) Forecast, by Application 2020 & 2033
- Table 28: Argentina Low Power Operational Amplifiers Volume (K) Forecast, by Application 2020 & 2033
- Table 29: Rest of South America Low Power Operational Amplifiers Revenue (undefined) Forecast, by Application 2020 & 2033
- Table 30: Rest of South America Low Power Operational Amplifiers Volume (K) Forecast, by Application 2020 & 2033
- Table 31: Global Low Power Operational Amplifiers Revenue undefined Forecast, by Application 2020 & 2033
- Table 32: Global Low Power Operational Amplifiers Volume K Forecast, by Application 2020 & 2033
- Table 33: Global Low Power Operational Amplifiers Revenue undefined Forecast, by Types 2020 & 2033
- Table 34: Global Low Power Operational Amplifiers Volume K Forecast, by Types 2020 & 2033
- Table 35: Global Low Power Operational Amplifiers Revenue undefined Forecast, by Country 2020 & 2033
- Table 36: Global Low Power Operational Amplifiers Volume K Forecast, by Country 2020 & 2033
- Table 37: United Kingdom Low Power Operational Amplifiers Revenue (undefined) Forecast, by Application 2020 & 2033
- Table 38: United Kingdom Low Power Operational Amplifiers Volume (K) Forecast, by Application 2020 & 2033
- Table 39: Germany Low Power Operational Amplifiers Revenue (undefined) Forecast, by Application 2020 & 2033
- Table 40: Germany Low Power Operational Amplifiers Volume (K) Forecast, by Application 2020 & 2033
- Table 41: France Low Power Operational Amplifiers Revenue (undefined) Forecast, by Application 2020 & 2033
- Table 42: France Low Power Operational Amplifiers Volume (K) Forecast, by Application 2020 & 2033
- Table 43: Italy Low Power Operational Amplifiers Revenue (undefined) Forecast, by Application 2020 & 2033
- Table 44: Italy Low Power Operational Amplifiers Volume (K) Forecast, by Application 2020 & 2033
- Table 45: Spain Low Power Operational Amplifiers Revenue (undefined) Forecast, by Application 2020 & 2033
- Table 46: Spain Low Power Operational Amplifiers Volume (K) Forecast, by Application 2020 & 2033
- Table 47: Russia Low Power Operational Amplifiers Revenue (undefined) Forecast, by Application 2020 & 2033
- Table 48: Russia Low Power Operational Amplifiers Volume (K) Forecast, by Application 2020 & 2033
- Table 49: Benelux Low Power Operational Amplifiers Revenue (undefined) Forecast, by Application 2020 & 2033
- Table 50: Benelux Low Power Operational Amplifiers Volume (K) Forecast, by Application 2020 & 2033
- Table 51: Nordics Low Power Operational Amplifiers Revenue (undefined) Forecast, by Application 2020 & 2033
- Table 52: Nordics Low Power Operational Amplifiers Volume (K) Forecast, by Application 2020 & 2033
- Table 53: Rest of Europe Low Power Operational Amplifiers Revenue (undefined) Forecast, by Application 2020 & 2033
- Table 54: Rest of Europe Low Power Operational Amplifiers Volume (K) Forecast, by Application 2020 & 2033
- Table 55: Global Low Power Operational Amplifiers Revenue undefined Forecast, by Application 2020 & 2033
- Table 56: Global Low Power Operational Amplifiers Volume K Forecast, by Application 2020 & 2033
- Table 57: Global Low Power Operational Amplifiers Revenue undefined Forecast, by Types 2020 & 2033
- Table 58: Global Low Power Operational Amplifiers Volume K Forecast, by Types 2020 & 2033
- Table 59: Global Low Power Operational Amplifiers Revenue undefined Forecast, by Country 2020 & 2033
- Table 60: Global Low Power Operational Amplifiers Volume K Forecast, by Country 2020 & 2033
- Table 61: Turkey Low Power Operational Amplifiers Revenue (undefined) Forecast, by Application 2020 & 2033
- Table 62: Turkey Low Power Operational Amplifiers Volume (K) Forecast, by Application 2020 & 2033
- Table 63: Israel Low Power Operational Amplifiers Revenue (undefined) Forecast, by Application 2020 & 2033
- Table 64: Israel Low Power Operational Amplifiers Volume (K) Forecast, by Application 2020 & 2033
- Table 65: GCC Low Power Operational Amplifiers Revenue (undefined) Forecast, by Application 2020 & 2033
- Table 66: GCC Low Power Operational Amplifiers Volume (K) Forecast, by Application 2020 & 2033
- Table 67: North Africa Low Power Operational Amplifiers Revenue (undefined) Forecast, by Application 2020 & 2033
- Table 68: North Africa Low Power Operational Amplifiers Volume (K) Forecast, by Application 2020 & 2033
- Table 69: South Africa Low Power Operational Amplifiers Revenue (undefined) Forecast, by Application 2020 & 2033
- Table 70: South Africa Low Power Operational Amplifiers Volume (K) Forecast, by Application 2020 & 2033
- Table 71: Rest of Middle East & Africa Low Power Operational Amplifiers Revenue (undefined) Forecast, by Application 2020 & 2033
- Table 72: Rest of Middle East & Africa Low Power Operational Amplifiers Volume (K) Forecast, by Application 2020 & 2033
- Table 73: Global Low Power Operational Amplifiers Revenue undefined Forecast, by Application 2020 & 2033
- Table 74: Global Low Power Operational Amplifiers Volume K Forecast, by Application 2020 & 2033
- Table 75: Global Low Power Operational Amplifiers Revenue undefined Forecast, by Types 2020 & 2033
- Table 76: Global Low Power Operational Amplifiers Volume K Forecast, by Types 2020 & 2033
- Table 77: Global Low Power Operational Amplifiers Revenue undefined Forecast, by Country 2020 & 2033
- Table 78: Global Low Power Operational Amplifiers Volume K Forecast, by Country 2020 & 2033
- Table 79: China Low Power Operational Amplifiers Revenue (undefined) Forecast, by Application 2020 & 2033
- Table 80: China Low Power Operational Amplifiers Volume (K) Forecast, by Application 2020 & 2033
- Table 81: India Low Power Operational Amplifiers Revenue (undefined) Forecast, by Application 2020 & 2033
- Table 82: India Low Power Operational Amplifiers Volume (K) Forecast, by Application 2020 & 2033
- Table 83: Japan Low Power Operational Amplifiers Revenue (undefined) Forecast, by Application 2020 & 2033
- Table 84: Japan Low Power Operational Amplifiers Volume (K) Forecast, by Application 2020 & 2033
- Table 85: South Korea Low Power Operational Amplifiers Revenue (undefined) Forecast, by Application 2020 & 2033
- Table 86: South Korea Low Power Operational Amplifiers Volume (K) Forecast, by Application 2020 & 2033
- Table 87: ASEAN Low Power Operational Amplifiers Revenue (undefined) Forecast, by Application 2020 & 2033
- Table 88: ASEAN Low Power Operational Amplifiers Volume (K) Forecast, by Application 2020 & 2033
- Table 89: Oceania Low Power Operational Amplifiers Revenue (undefined) Forecast, by Application 2020 & 2033
- Table 90: Oceania Low Power Operational Amplifiers Volume (K) Forecast, by Application 2020 & 2033
- Table 91: Rest of Asia Pacific Low Power Operational Amplifiers Revenue (undefined) Forecast, by Application 2020 & 2033
- Table 92: Rest of Asia Pacific Low Power Operational Amplifiers Volume (K) Forecast, by Application 2020 & 2033
Frequently Asked Questions
1. What is the projected Compound Annual Growth Rate (CAGR) of the Low Power Operational Amplifiers?
The projected CAGR is approximately 14.11%.
2. Which companies are prominent players in the Low Power Operational Amplifiers?
Key companies in the market include Analog Devices, Maxim Integrated, STMicroelectronics, Skyworks, Qorvo, Texas Instruments, Microchip Technology, ROHM Semiconductor GmbH, Shenzhen Jxsq Technology Development, Sanway Audio Equipment, Shenzhen Semicon Electronics Technology, Dongguan Merry Electronic, SGMICRO.
3. What are the main segments of the Low Power Operational Amplifiers?
The market segments include Application, Types.
4. Can you provide details about the market size?
The market size is estimated to be USD XXX N/A as of 2022.
5. What are some drivers contributing to market growth?
N/A
6. What are the notable trends driving market growth?
N/A
7. Are there any restraints impacting market growth?
N/A
8. Can you provide examples of recent developments in the market?
N/A
9. What pricing options are available for accessing the report?
Pricing options include single-user, multi-user, and enterprise licenses priced at USD 3350.00, USD 5025.00, and USD 6700.00 respectively.
10. Is the market size provided in terms of value or volume?
The market size is provided in terms of value, measured in N/A and volume, measured in K.
11. Are there any specific market keywords associated with the report?
Yes, the market keyword associated with the report is "Low Power Operational Amplifiers," which aids in identifying and referencing the specific market segment covered.
12. How do I determine which pricing option suits my needs best?
The pricing options vary based on user requirements and access needs. Individual users may opt for single-user licenses, while businesses requiring broader access may choose multi-user or enterprise licenses for cost-effective access to the report.
13. Are there any additional resources or data provided in the Low Power Operational Amplifiers report?
While the report offers comprehensive insights, it's advisable to review the specific contents or supplementary materials provided to ascertain if additional resources or data are available.
14. How can I stay updated on further developments or reports in the Low Power Operational Amplifiers?
To stay informed about further developments, trends, and reports in the Low Power Operational Amplifiers, consider subscribing to industry newsletters, following relevant companies and organizations, or regularly checking reputable industry news sources and publications.
Methodology
Step 1 - Identification of Relevant Samples Size from Population Database


Step 2 - Approaches for Defining Global Market Size (Value, Volume* & Price*)

Note*: In applicable scenarios
Step 3 - Data Sources
Primary Research
- Web Analytics
- Survey Reports
- Research Institute
- Latest Research Reports
- Opinion Leaders
Secondary Research
- Annual Reports
- White Paper
- Latest Press Release
- Industry Association
- Paid Database
- Investor Presentations

Step 4 - Data Triangulation
Involves using different sources of information in order to increase the validity of a study
These sources are likely to be stakeholders in a program - participants, other researchers, program staff, other community members, and so on.
Then we put all data in single framework & apply various statistical tools to find out the dynamic on the market.
During the analysis stage, feedback from the stakeholder groups would be compared to determine areas of agreement as well as areas of divergence