

Key Insights
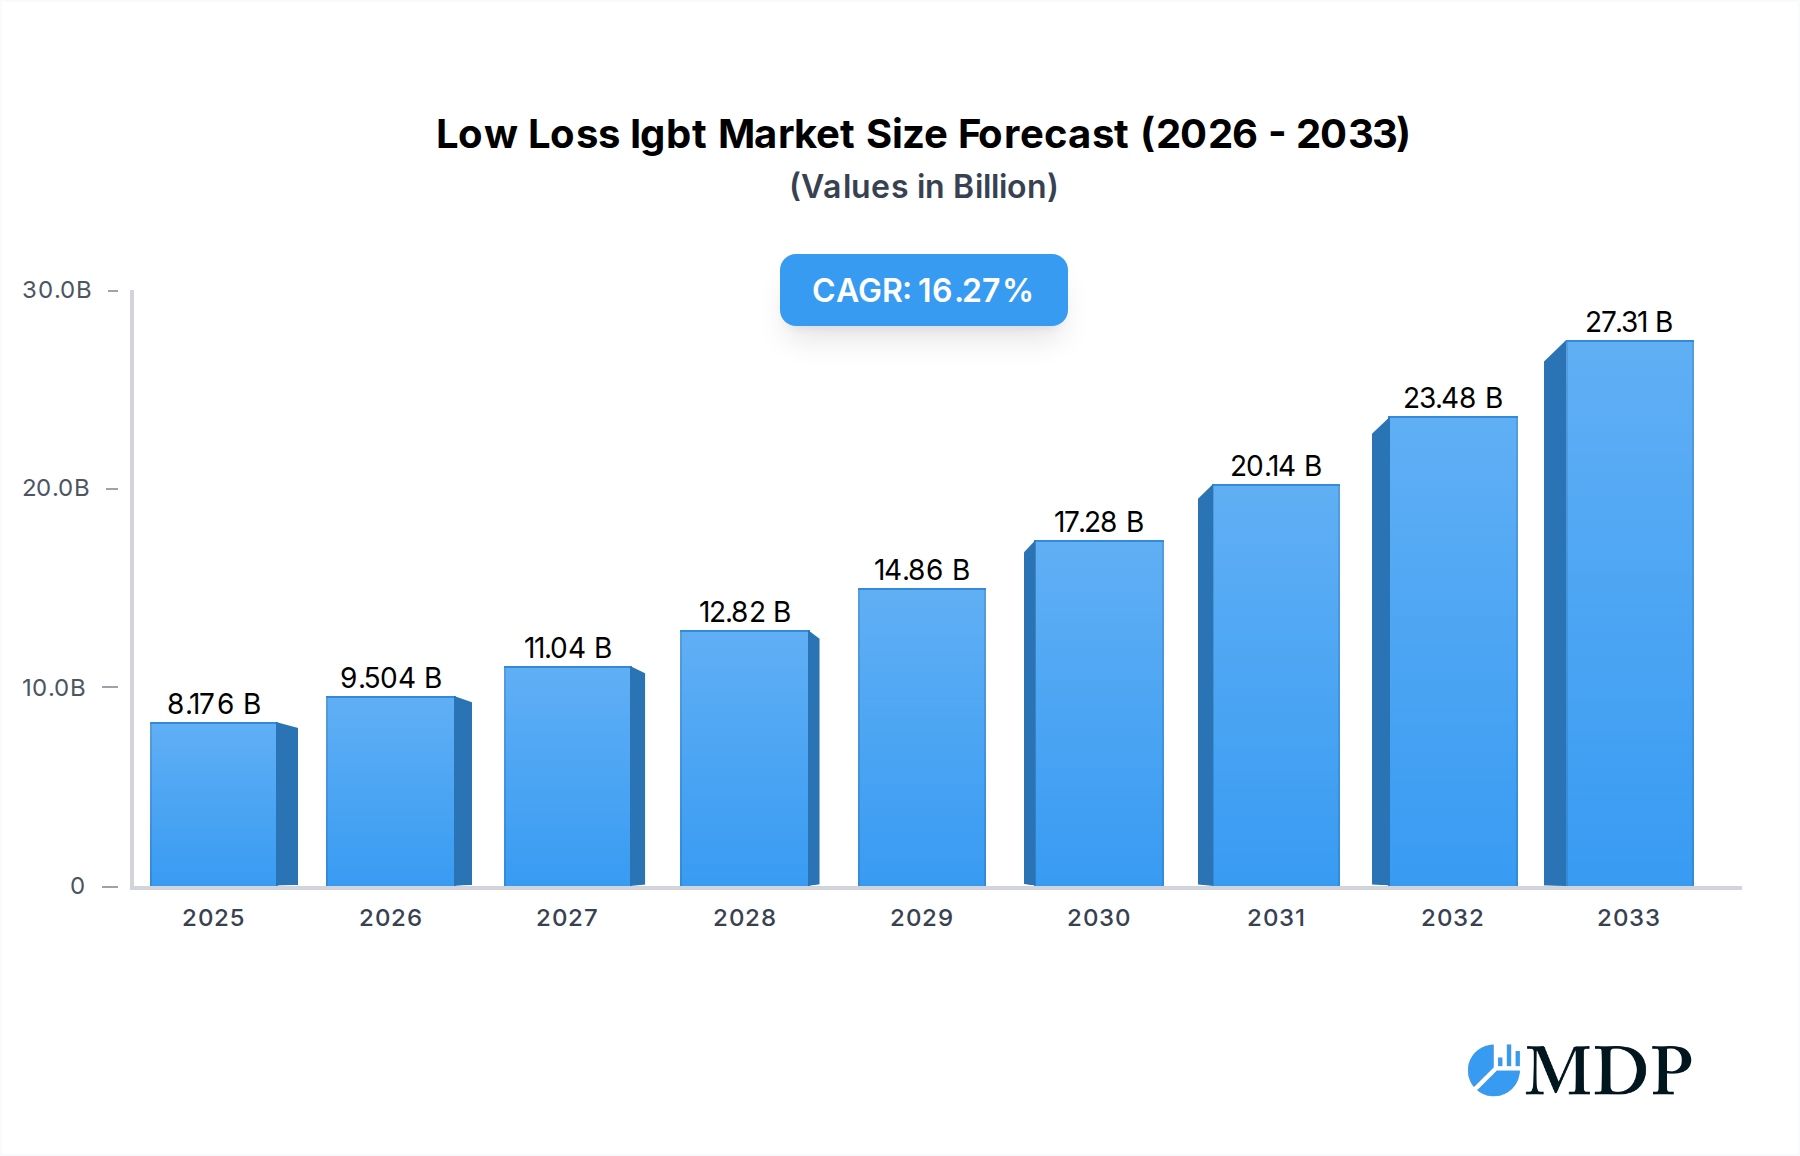
The global Low Loss IGBT market is poised for substantial expansion, projected to reach an estimated $8176 million by 2025, with an impressive Compound Annual Growth Rate (CAGR) of 16.1% during the forecast period of 2025-2033. This robust growth is primarily fueled by the escalating demand for energy-efficient power electronic components across a spectrum of critical industries. The ongoing electrification of transportation, particularly the burgeoning electric vehicle (EV) sector, stands as a significant growth driver. EVs rely heavily on advanced IGBTs for efficient power management, enabling longer driving ranges and faster charging capabilities. Furthermore, the renewable energy sector, with its increasing adoption of solar and wind power, also necessitates high-performance IGBTs for inverters and power conversion systems to optimize energy harvesting and grid integration. Consumer electronics, industrial automation, and advancements in rail transportation systems are also contributing to the sustained upward trajectory of this market.

Low Loss Igbt Market Size (In Billion)
The market's growth is further propelled by technological advancements leading to the development of Low Loss IGBTs with enhanced performance characteristics, including reduced switching losses, improved thermal management, and higher power density. These innovations are crucial for meeting the stringent efficiency requirements of modern electronic devices and systems. The increasing focus on reducing carbon footprints and promoting sustainable energy solutions globally is a strong underlying trend that favors the adoption of energy-efficient components like Low Loss IGBTs. While the market enjoys strong growth, potential restraints could emerge from the volatility of raw material prices impacting manufacturing costs, and the intense competition among established global players and emerging regional manufacturers. However, the continuous innovation in material science and manufacturing processes, coupled with supportive government policies promoting energy efficiency and green technologies, are expected to mitigate these challenges and ensure sustained market expansion.
Low Loss Igbt Company Market Share
Low Loss IGBT Market: Comprehensive Analysis and Future Projections (2019-2033)
This in-depth report provides a definitive analysis of the global Low Loss Insulated Gate Bipolar Transistor (IGBT) market, meticulously examining its dynamics, trends, and future trajectory. Designed for industry stakeholders, including manufacturers, investors, and research institutions, this report offers actionable insights into market concentration, technological advancements, leading segments, and the strategic imperatives for success in this rapidly evolving sector. With a Study Period spanning from 2019 to 2033, a Base Year of 2025, and a Forecast Period from 2025 to 2033, this comprehensive study delivers unparalleled clarity on market opportunities and challenges.
Low Loss Igbt Market Dynamics & Concentration
The Low Loss IGBT market is characterized by a moderate to high concentration, with key players investing heavily in research and development to achieve superior energy efficiency. Innovation drivers are primarily centered around reducing conduction and switching losses, enabling smaller, lighter, and more cost-effective power electronic systems. Regulatory frameworks, particularly those emphasizing energy conservation and emission reduction (e.g., stringent standards for electric vehicles and industrial machinery), play a significant role in shaping market demand and driving the adoption of advanced IGBT technologies. Product substitutes, such as Silicon Carbide (SiC) and Gallium Nitride (GaN) devices, are emerging as competitive alternatives, especially in high-frequency and high-temperature applications, pushing IGBT manufacturers to continually enhance performance and cost-effectiveness. End-user trends indicate a strong preference for integrated solutions and modules that simplify design and improve reliability. Mergers and acquisitions (M&A) activities are prevalent, with larger companies acquiring smaller innovators to consolidate market share and expand their technological portfolios. The historical M&A deal count for the past five years stands at an estimated 25 million, indicating a dynamic landscape driven by strategic consolidation and technological synergy. Market share of leading players is estimated to be north of 70 million, reflecting the dominance of established manufacturers.
Low Loss Igbt Industry Trends & Analysis
The Low Loss IGBT industry is poised for significant growth, driven by the escalating demand for energy-efficient power electronics across diverse applications. The market is projected to witness a Compound Annual Growth Rate (CAGR) of approximately 8.5% over the forecast period. This robust expansion is fueled by several key trends. Firstly, the rapid electrification of transportation, particularly the burgeoning Electric Vehicle (EV) segment, represents a major growth driver. The increasing adoption of EVs necessitates advanced power modules for inverters, converters, and onboard chargers, where low loss IGBTs are crucial for maximizing range and minimizing energy consumption. Secondly, the ongoing industrial automation and the deployment of smart grids are creating substantial demand for efficient power control solutions. Inverters for motor control in industrial machinery and renewable energy integration systems are key application areas benefiting from low loss IGBT technology. Thirdly, advancements in semiconductor manufacturing processes and materials are leading to the development of IGBTs with improved performance characteristics, including higher voltage ratings, lower thermal resistance, and enhanced reliability. These technological disruptions are not only expanding the application scope of IGBTs but also driving market penetration in segments previously dominated by other technologies. Consumer electronics, particularly high-efficiency appliances and advanced displays, are also increasingly incorporating low loss IGBTs to meet energy efficiency standards and enhance product performance. The competitive landscape is intensifying, with a focus on next-generation IGBT technologies such as Trench Field-Stop and Advanced Trench technologies to further reduce losses and improve power density. Market penetration is estimated to reach over 65 million units by the end of the forecast period, signifying the widespread adoption of these critical components.
Leading Markets & Segments in Low Loss Igbt
The Low Loss IGBT market is experiencing substantial growth across multiple segments and regions, with a clear dominance in specific application and type categories.
Dominant Application Segments:
- Inverter Applications: This segment is a primary growth engine, driven by the widespread use of inverters in industrial motor drives, renewable energy systems (solar and wind power), and uninterruptible power supplies (UPS). The need for efficient power conversion and energy savings in these areas makes low loss IGBTs indispensable. The global inverter market is projected to reach approximately 120 million units by 2033.
- Key Drivers: Increasing adoption of variable frequency drives (VFDs) in manufacturing, government incentives for renewable energy installations, and the growing demand for reliable power backup solutions.
- Electric Vehicles (EVs): The exponential growth of the EV market is a significant catalyst for low loss IGBT adoption. These components are critical for the efficiency of EV powertrains, including inverters, converters, and onboard chargers, directly impacting vehicle range and performance. The EV segment alone is expected to account for over 90 million units in demand by 2033.
- Key Drivers: Stringent emission regulations, declining battery costs, expansion of charging infrastructure, and increasing consumer preference for sustainable transportation.
- Servo Controllers: In industrial automation, servo controllers require precise and efficient power management, making low loss IGBTs a preferred choice for high-performance servo systems.
- Key Drivers: Advancements in robotics, automation in manufacturing, and the increasing need for precise motion control.
Dominant IGBT Types:
- LV IGBT (Low Voltage IGBT): These are widely adopted across consumer electronics and certain industrial applications due to their cost-effectiveness and suitability for lower voltage requirements. The demand for LV IGBTs is projected to exceed 150 million units by 2033.
- Key Drivers: Proliferation of energy-efficient appliances, smart home devices, and power supplies for electronic equipment.
- MV IGBT (Medium Voltage IGBT): Crucial for medium voltage industrial applications, grid-tied inverters, and rail transportation, MV IGBTs offer a balance of performance and cost for demanding power systems.
- Key Drivers: Growth in industrial automation, development of smart grids, and increasing investments in public transportation infrastructure.
The dominance of these segments is further bolstered by supportive economic policies, such as tax incentives for energy-efficient products and investments in infrastructure development, particularly in emerging economies that are rapidly industrializing and adopting electric mobility solutions.
Low Loss Igbt Product Developments
Recent product developments in the Low Loss IGBT market are centered on achieving unprecedented levels of energy efficiency and power density. Manufacturers are actively innovating with advanced materials and trench gate technologies to minimize conduction and switching losses. This translates into smaller, lighter, and more reliable power modules that are critical for next-generation applications like electric vehicles, renewable energy systems, and industrial automation. Key advancements include the introduction of Field-Stop Trench IGBTs and the integration of fast-recovery diodes, significantly enhancing performance and thermal management. These innovations provide a distinct competitive advantage by enabling designers to create more compact and cost-effective power electronic solutions.
Key Drivers of Low Loss Igbt Growth
The growth of the Low Loss IGBT market is propelled by a confluence of powerful factors.
- Technological Advancements: Continuous innovation in semiconductor technology, such as Field-Stop and Trench Gate designs, significantly reduces energy losses, making IGBTs more efficient and cost-effective.
- Electric Vehicle (EV) Revolution: The rapid expansion of the EV market, driven by environmental concerns and government mandates, creates a massive demand for high-performance IGBTs in vehicle powertrains and charging infrastructure.
- Renewable Energy Integration: The global push towards renewable energy sources like solar and wind power necessitates efficient inverters and power converters, where low loss IGBTs play a crucial role.
- Industrial Automation and Energy Efficiency: Increasing automation in manufacturing and a global focus on energy conservation are driving the adoption of energy-efficient power electronics in industrial equipment and smart grids.
Challenges in the Low Loss Igbt Market
Despite the robust growth, the Low Loss IGBT market faces several significant challenges that could impact its trajectory.
- Intensifying Competition from Wide Bandgap Semiconductors: Emerging technologies like Silicon Carbide (SiC) and Gallium Nitride (GaN) offer superior performance in certain high-frequency and high-temperature applications, posing a competitive threat to traditional IGBTs.
- Supply Chain Volatility: The semiconductor industry is susceptible to disruptions in raw material sourcing, manufacturing capacity, and global logistics, which can lead to price fluctuations and lead time extensions.
- High R&D Investment Requirements: Developing cutting-edge low loss IGBT technology demands substantial and ongoing investment in research and development, creating a barrier for smaller players.
- Price Sensitivity in Certain Segments: While performance is key, price remains a critical factor in cost-sensitive applications, requiring manufacturers to balance innovation with affordability.
Emerging Opportunities in Low Loss Igbt
The Low Loss IGBT market is ripe with emerging opportunities driven by technological breakthroughs and expanding application frontiers. The continuous development of advanced materials and packaging technologies promises further enhancements in power density and efficiency, opening doors for IGBTs in even more demanding applications. Strategic partnerships between IGBT manufacturers and system integrators, particularly in the rapidly growing EV and renewable energy sectors, will be instrumental in co-developing optimized solutions. Furthermore, the expansion of smart grid initiatives and the electrification of transportation in emerging economies present significant untapped market potential. Exploring these opportunities through targeted product development and market penetration strategies will be crucial for sustained growth.
Leading Players in the Low Loss Igbt Sector
- Toshiba
- Infineon Technologies
- STMicroelectronics
- Fuji Electric
- Mitsubishi Electric
- Shenzhen China Micro Semicon
- Renesas
- Sanken Electric
- BYD Semiconductor
- StarPower Semiconductor
- Onsemi
- Yangzhou Yangjie Electronic Technology
- ROHM
Key Milestones in Low Loss Igbt Industry
- 2019/2020: Introduction of next-generation Field-Stop Trench IGBTs with enhanced efficiency and reduced switching losses.
- 2021: Significant increase in demand from the EV sector, leading to capacity expansions by major manufacturers.
- 2022: Growing adoption of advanced IGBT modules in renewable energy inverters to meet efficiency standards.
- 2023: Enhanced focus on intelligent power modules (IPMs) integrating Low Loss IGBTs for simplified system design.
- Ongoing (2024-2025): Continued research and development into Wide Bandgap technologies and hybrid solutions.
Strategic Outlook for Low Loss Igbt Market
The strategic outlook for the Low Loss IGBT market remains exceptionally positive, driven by the accelerating global transition towards electrification and energy efficiency. Future growth will be underpinned by continued advancements in semiconductor technology, leading to even higher performance and cost-effectiveness. Strategic opportunities lie in deepening penetration within the burgeoning EV market, expanding into emerging renewable energy applications, and capitalizing on the growing demand for smart grid solutions. Collaborations with key industry players to develop integrated power modules and customized solutions will be paramount. By focusing on innovation, strategic partnerships, and catering to the evolving needs of its core segments, the Low Loss IGBT market is well-positioned for sustained and robust growth throughout the forecast period and beyond.
Low Loss Igbt Segmentation
-
1. Application
- 1.1. Inverter
- 1.2. Servo Controller
- 1.3. EV
- 1.4. Consumer Eletronics
- 1.5. Rail Transportation
- 1.6. Others
-
2. Type
- 2.1. LV IGBT
- 2.2. MV IGBT
- 2.3. HV IGBT
Low Loss Igbt Segmentation By Geography
-
1. North America
- 1.1. United States
- 1.2. Canada
- 1.3. Mexico
-
2. South America
- 2.1. Brazil
- 2.2. Argentina
- 2.3. Rest of South America
-
3. Europe
- 3.1. United Kingdom
- 3.2. Germany
- 3.3. France
- 3.4. Italy
- 3.5. Spain
- 3.6. Russia
- 3.7. Benelux
- 3.8. Nordics
- 3.9. Rest of Europe
-
4. Middle East & Africa
- 4.1. Turkey
- 4.2. Israel
- 4.3. GCC
- 4.4. North Africa
- 4.5. South Africa
- 4.6. Rest of Middle East & Africa
-
5. Asia Pacific
- 5.1. China
- 5.2. India
- 5.3. Japan
- 5.4. South Korea
- 5.5. ASEAN
- 5.6. Oceania
- 5.7. Rest of Asia Pacific
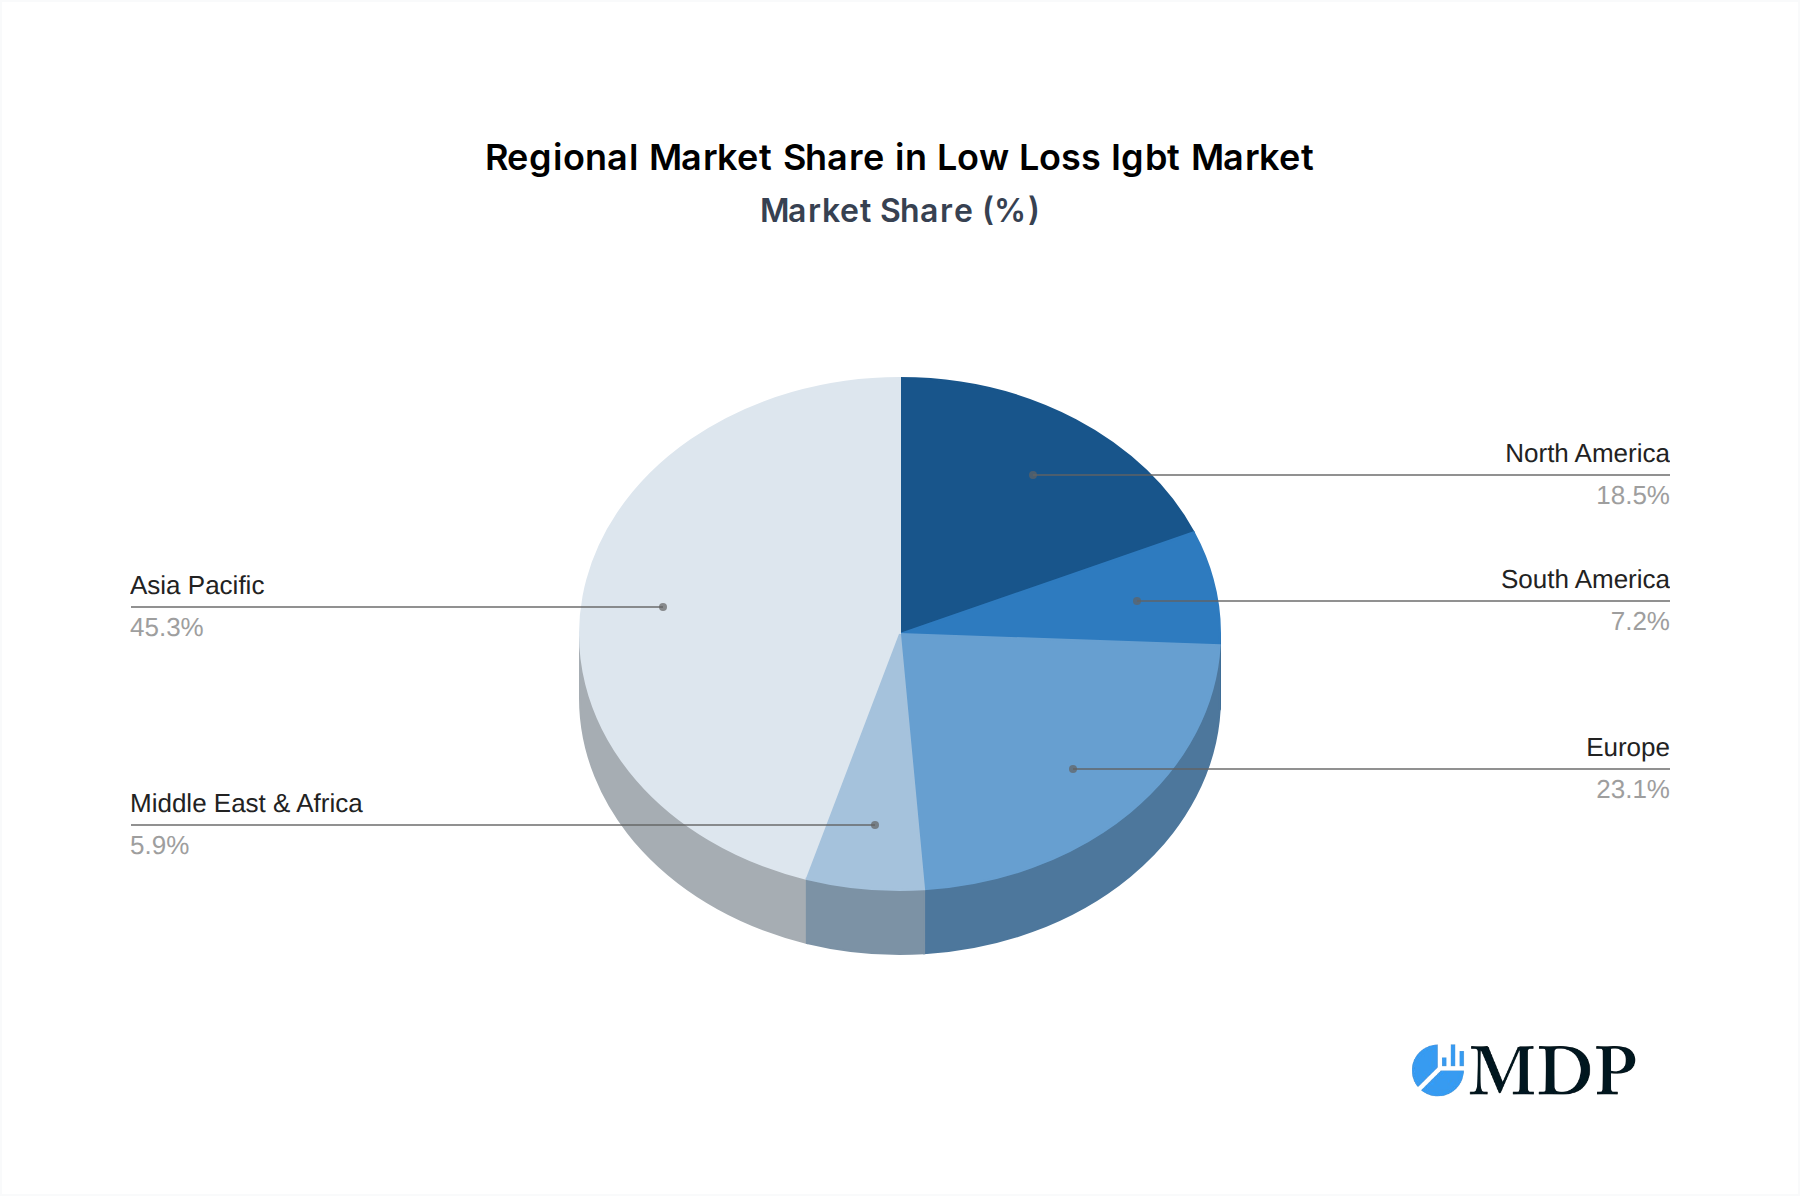
Low Loss Igbt Regional Market Share
Geographic Coverage of Low Loss Igbt
Low Loss Igbt REPORT HIGHLIGHTS
| Aspects | Details |
|---|---|
| Study Period | 2020-2034 |
| Base Year | 2025 |
| Estimated Year | 2026 |
| Forecast Period | 2026-2034 |
| Historical Period | 2020-2025 |
| Growth Rate | CAGR of 16.1% from 2020-2034 |
| Segmentation |
|
Table of Contents
- 1. Introduction
- 1.1. Research Scope
- 1.2. Market Segmentation
- 1.3. Research Methodology
- 1.4. Definitions and Assumptions
- 2. Executive Summary
- 2.1. Introduction
- 3. Market Dynamics
- 3.1. Introduction
- 3.2. Market Drivers
- 3.3. Market Restrains
- 3.4. Market Trends
- 4. Market Factor Analysis
- 4.1. Porters Five Forces
- 4.2. Supply/Value Chain
- 4.3. PESTEL analysis
- 4.4. Market Entropy
- 4.5. Patent/Trademark Analysis
- 5. Global Low Loss Igbt Analysis, Insights and Forecast, 2020-2032
- 5.1. Market Analysis, Insights and Forecast - by Application
- 5.1.1. Inverter
- 5.1.2. Servo Controller
- 5.1.3. EV
- 5.1.4. Consumer Eletronics
- 5.1.5. Rail Transportation
- 5.1.6. Others
- 5.2. Market Analysis, Insights and Forecast - by Type
- 5.2.1. LV IGBT
- 5.2.2. MV IGBT
- 5.2.3. HV IGBT
- 5.3. Market Analysis, Insights and Forecast - by Region
- 5.3.1. North America
- 5.3.2. South America
- 5.3.3. Europe
- 5.3.4. Middle East & Africa
- 5.3.5. Asia Pacific
- 5.1. Market Analysis, Insights and Forecast - by Application
- 6. North America Low Loss Igbt Analysis, Insights and Forecast, 2020-2032
- 6.1. Market Analysis, Insights and Forecast - by Application
- 6.1.1. Inverter
- 6.1.2. Servo Controller
- 6.1.3. EV
- 6.1.4. Consumer Eletronics
- 6.1.5. Rail Transportation
- 6.1.6. Others
- 6.2. Market Analysis, Insights and Forecast - by Type
- 6.2.1. LV IGBT
- 6.2.2. MV IGBT
- 6.2.3. HV IGBT
- 6.1. Market Analysis, Insights and Forecast - by Application
- 7. South America Low Loss Igbt Analysis, Insights and Forecast, 2020-2032
- 7.1. Market Analysis, Insights and Forecast - by Application
- 7.1.1. Inverter
- 7.1.2. Servo Controller
- 7.1.3. EV
- 7.1.4. Consumer Eletronics
- 7.1.5. Rail Transportation
- 7.1.6. Others
- 7.2. Market Analysis, Insights and Forecast - by Type
- 7.2.1. LV IGBT
- 7.2.2. MV IGBT
- 7.2.3. HV IGBT
- 7.1. Market Analysis, Insights and Forecast - by Application
- 8. Europe Low Loss Igbt Analysis, Insights and Forecast, 2020-2032
- 8.1. Market Analysis, Insights and Forecast - by Application
- 8.1.1. Inverter
- 8.1.2. Servo Controller
- 8.1.3. EV
- 8.1.4. Consumer Eletronics
- 8.1.5. Rail Transportation
- 8.1.6. Others
- 8.2. Market Analysis, Insights and Forecast - by Type
- 8.2.1. LV IGBT
- 8.2.2. MV IGBT
- 8.2.3. HV IGBT
- 8.1. Market Analysis, Insights and Forecast - by Application
- 9. Middle East & Africa Low Loss Igbt Analysis, Insights and Forecast, 2020-2032
- 9.1. Market Analysis, Insights and Forecast - by Application
- 9.1.1. Inverter
- 9.1.2. Servo Controller
- 9.1.3. EV
- 9.1.4. Consumer Eletronics
- 9.1.5. Rail Transportation
- 9.1.6. Others
- 9.2. Market Analysis, Insights and Forecast - by Type
- 9.2.1. LV IGBT
- 9.2.2. MV IGBT
- 9.2.3. HV IGBT
- 9.1. Market Analysis, Insights and Forecast - by Application
- 10. Asia Pacific Low Loss Igbt Analysis, Insights and Forecast, 2020-2032
- 10.1. Market Analysis, Insights and Forecast - by Application
- 10.1.1. Inverter
- 10.1.2. Servo Controller
- 10.1.3. EV
- 10.1.4. Consumer Eletronics
- 10.1.5. Rail Transportation
- 10.1.6. Others
- 10.2. Market Analysis, Insights and Forecast - by Type
- 10.2.1. LV IGBT
- 10.2.2. MV IGBT
- 10.2.3. HV IGBT
- 10.1. Market Analysis, Insights and Forecast - by Application
- 11. Competitive Analysis
- 11.1. Global Market Share Analysis 2025
- 11.2. Company Profiles
- 11.2.1 Toshiba
- 11.2.1.1. Overview
- 11.2.1.2. Products
- 11.2.1.3. SWOT Analysis
- 11.2.1.4. Recent Developments
- 11.2.1.5. Financials (Based on Availability)
- 11.2.2 Infineon Technologies
- 11.2.2.1. Overview
- 11.2.2.2. Products
- 11.2.2.3. SWOT Analysis
- 11.2.2.4. Recent Developments
- 11.2.2.5. Financials (Based on Availability)
- 11.2.3 STMicroelectronics
- 11.2.3.1. Overview
- 11.2.3.2. Products
- 11.2.3.3. SWOT Analysis
- 11.2.3.4. Recent Developments
- 11.2.3.5. Financials (Based on Availability)
- 11.2.4 Fuji Electric
- 11.2.4.1. Overview
- 11.2.4.2. Products
- 11.2.4.3. SWOT Analysis
- 11.2.4.4. Recent Developments
- 11.2.4.5. Financials (Based on Availability)
- 11.2.5 Mitsubishi Electric
- 11.2.5.1. Overview
- 11.2.5.2. Products
- 11.2.5.3. SWOT Analysis
- 11.2.5.4. Recent Developments
- 11.2.5.5. Financials (Based on Availability)
- 11.2.6 Shenzhen China Micro Semicon
- 11.2.6.1. Overview
- 11.2.6.2. Products
- 11.2.6.3. SWOT Analysis
- 11.2.6.4. Recent Developments
- 11.2.6.5. Financials (Based on Availability)
- 11.2.7 Renesas
- 11.2.7.1. Overview
- 11.2.7.2. Products
- 11.2.7.3. SWOT Analysis
- 11.2.7.4. Recent Developments
- 11.2.7.5. Financials (Based on Availability)
- 11.2.8 Sanken Electric
- 11.2.8.1. Overview
- 11.2.8.2. Products
- 11.2.8.3. SWOT Analysis
- 11.2.8.4. Recent Developments
- 11.2.8.5. Financials (Based on Availability)
- 11.2.9 BYD Semiconductor
- 11.2.9.1. Overview
- 11.2.9.2. Products
- 11.2.9.3. SWOT Analysis
- 11.2.9.4. Recent Developments
- 11.2.9.5. Financials (Based on Availability)
- 11.2.10 StarPower Semiconductor
- 11.2.10.1. Overview
- 11.2.10.2. Products
- 11.2.10.3. SWOT Analysis
- 11.2.10.4. Recent Developments
- 11.2.10.5. Financials (Based on Availability)
- 11.2.11 Onsemi
- 11.2.11.1. Overview
- 11.2.11.2. Products
- 11.2.11.3. SWOT Analysis
- 11.2.11.4. Recent Developments
- 11.2.11.5. Financials (Based on Availability)
- 11.2.12 Yangzhou Yangjie Electronic Technology
- 11.2.12.1. Overview
- 11.2.12.2. Products
- 11.2.12.3. SWOT Analysis
- 11.2.12.4. Recent Developments
- 11.2.12.5. Financials (Based on Availability)
- 11.2.13 ROHM
- 11.2.13.1. Overview
- 11.2.13.2. Products
- 11.2.13.3. SWOT Analysis
- 11.2.13.4. Recent Developments
- 11.2.13.5. Financials (Based on Availability)
- 11.2.14 Toshiba
- 11.2.14.1. Overview
- 11.2.14.2. Products
- 11.2.14.3. SWOT Analysis
- 11.2.14.4. Recent Developments
- 11.2.14.5. Financials (Based on Availability)
- 11.2.1 Toshiba
List of Figures
- Figure 1: Global Low Loss Igbt Revenue Breakdown (million, %) by Region 2025 & 2033
- Figure 2: Global Low Loss Igbt Volume Breakdown (K, %) by Region 2025 & 2033
- Figure 3: North America Low Loss Igbt Revenue (million), by Application 2025 & 2033
- Figure 4: North America Low Loss Igbt Volume (K), by Application 2025 & 2033
- Figure 5: North America Low Loss Igbt Revenue Share (%), by Application 2025 & 2033
- Figure 6: North America Low Loss Igbt Volume Share (%), by Application 2025 & 2033
- Figure 7: North America Low Loss Igbt Revenue (million), by Type 2025 & 2033
- Figure 8: North America Low Loss Igbt Volume (K), by Type 2025 & 2033
- Figure 9: North America Low Loss Igbt Revenue Share (%), by Type 2025 & 2033
- Figure 10: North America Low Loss Igbt Volume Share (%), by Type 2025 & 2033
- Figure 11: North America Low Loss Igbt Revenue (million), by Country 2025 & 2033
- Figure 12: North America Low Loss Igbt Volume (K), by Country 2025 & 2033
- Figure 13: North America Low Loss Igbt Revenue Share (%), by Country 2025 & 2033
- Figure 14: North America Low Loss Igbt Volume Share (%), by Country 2025 & 2033
- Figure 15: South America Low Loss Igbt Revenue (million), by Application 2025 & 2033
- Figure 16: South America Low Loss Igbt Volume (K), by Application 2025 & 2033
- Figure 17: South America Low Loss Igbt Revenue Share (%), by Application 2025 & 2033
- Figure 18: South America Low Loss Igbt Volume Share (%), by Application 2025 & 2033
- Figure 19: South America Low Loss Igbt Revenue (million), by Type 2025 & 2033
- Figure 20: South America Low Loss Igbt Volume (K), by Type 2025 & 2033
- Figure 21: South America Low Loss Igbt Revenue Share (%), by Type 2025 & 2033
- Figure 22: South America Low Loss Igbt Volume Share (%), by Type 2025 & 2033
- Figure 23: South America Low Loss Igbt Revenue (million), by Country 2025 & 2033
- Figure 24: South America Low Loss Igbt Volume (K), by Country 2025 & 2033
- Figure 25: South America Low Loss Igbt Revenue Share (%), by Country 2025 & 2033
- Figure 26: South America Low Loss Igbt Volume Share (%), by Country 2025 & 2033
- Figure 27: Europe Low Loss Igbt Revenue (million), by Application 2025 & 2033
- Figure 28: Europe Low Loss Igbt Volume (K), by Application 2025 & 2033
- Figure 29: Europe Low Loss Igbt Revenue Share (%), by Application 2025 & 2033
- Figure 30: Europe Low Loss Igbt Volume Share (%), by Application 2025 & 2033
- Figure 31: Europe Low Loss Igbt Revenue (million), by Type 2025 & 2033
- Figure 32: Europe Low Loss Igbt Volume (K), by Type 2025 & 2033
- Figure 33: Europe Low Loss Igbt Revenue Share (%), by Type 2025 & 2033
- Figure 34: Europe Low Loss Igbt Volume Share (%), by Type 2025 & 2033
- Figure 35: Europe Low Loss Igbt Revenue (million), by Country 2025 & 2033
- Figure 36: Europe Low Loss Igbt Volume (K), by Country 2025 & 2033
- Figure 37: Europe Low Loss Igbt Revenue Share (%), by Country 2025 & 2033
- Figure 38: Europe Low Loss Igbt Volume Share (%), by Country 2025 & 2033
- Figure 39: Middle East & Africa Low Loss Igbt Revenue (million), by Application 2025 & 2033
- Figure 40: Middle East & Africa Low Loss Igbt Volume (K), by Application 2025 & 2033
- Figure 41: Middle East & Africa Low Loss Igbt Revenue Share (%), by Application 2025 & 2033
- Figure 42: Middle East & Africa Low Loss Igbt Volume Share (%), by Application 2025 & 2033
- Figure 43: Middle East & Africa Low Loss Igbt Revenue (million), by Type 2025 & 2033
- Figure 44: Middle East & Africa Low Loss Igbt Volume (K), by Type 2025 & 2033
- Figure 45: Middle East & Africa Low Loss Igbt Revenue Share (%), by Type 2025 & 2033
- Figure 46: Middle East & Africa Low Loss Igbt Volume Share (%), by Type 2025 & 2033
- Figure 47: Middle East & Africa Low Loss Igbt Revenue (million), by Country 2025 & 2033
- Figure 48: Middle East & Africa Low Loss Igbt Volume (K), by Country 2025 & 2033
- Figure 49: Middle East & Africa Low Loss Igbt Revenue Share (%), by Country 2025 & 2033
- Figure 50: Middle East & Africa Low Loss Igbt Volume Share (%), by Country 2025 & 2033
- Figure 51: Asia Pacific Low Loss Igbt Revenue (million), by Application 2025 & 2033
- Figure 52: Asia Pacific Low Loss Igbt Volume (K), by Application 2025 & 2033
- Figure 53: Asia Pacific Low Loss Igbt Revenue Share (%), by Application 2025 & 2033
- Figure 54: Asia Pacific Low Loss Igbt Volume Share (%), by Application 2025 & 2033
- Figure 55: Asia Pacific Low Loss Igbt Revenue (million), by Type 2025 & 2033
- Figure 56: Asia Pacific Low Loss Igbt Volume (K), by Type 2025 & 2033
- Figure 57: Asia Pacific Low Loss Igbt Revenue Share (%), by Type 2025 & 2033
- Figure 58: Asia Pacific Low Loss Igbt Volume Share (%), by Type 2025 & 2033
- Figure 59: Asia Pacific Low Loss Igbt Revenue (million), by Country 2025 & 2033
- Figure 60: Asia Pacific Low Loss Igbt Volume (K), by Country 2025 & 2033
- Figure 61: Asia Pacific Low Loss Igbt Revenue Share (%), by Country 2025 & 2033
- Figure 62: Asia Pacific Low Loss Igbt Volume Share (%), by Country 2025 & 2033
List of Tables
- Table 1: Global Low Loss Igbt Revenue million Forecast, by Application 2020 & 2033
- Table 2: Global Low Loss Igbt Volume K Forecast, by Application 2020 & 2033
- Table 3: Global Low Loss Igbt Revenue million Forecast, by Type 2020 & 2033
- Table 4: Global Low Loss Igbt Volume K Forecast, by Type 2020 & 2033
- Table 5: Global Low Loss Igbt Revenue million Forecast, by Region 2020 & 2033
- Table 6: Global Low Loss Igbt Volume K Forecast, by Region 2020 & 2033
- Table 7: Global Low Loss Igbt Revenue million Forecast, by Application 2020 & 2033
- Table 8: Global Low Loss Igbt Volume K Forecast, by Application 2020 & 2033
- Table 9: Global Low Loss Igbt Revenue million Forecast, by Type 2020 & 2033
- Table 10: Global Low Loss Igbt Volume K Forecast, by Type 2020 & 2033
- Table 11: Global Low Loss Igbt Revenue million Forecast, by Country 2020 & 2033
- Table 12: Global Low Loss Igbt Volume K Forecast, by Country 2020 & 2033
- Table 13: United States Low Loss Igbt Revenue (million) Forecast, by Application 2020 & 2033
- Table 14: United States Low Loss Igbt Volume (K) Forecast, by Application 2020 & 2033
- Table 15: Canada Low Loss Igbt Revenue (million) Forecast, by Application 2020 & 2033
- Table 16: Canada Low Loss Igbt Volume (K) Forecast, by Application 2020 & 2033
- Table 17: Mexico Low Loss Igbt Revenue (million) Forecast, by Application 2020 & 2033
- Table 18: Mexico Low Loss Igbt Volume (K) Forecast, by Application 2020 & 2033
- Table 19: Global Low Loss Igbt Revenue million Forecast, by Application 2020 & 2033
- Table 20: Global Low Loss Igbt Volume K Forecast, by Application 2020 & 2033
- Table 21: Global Low Loss Igbt Revenue million Forecast, by Type 2020 & 2033
- Table 22: Global Low Loss Igbt Volume K Forecast, by Type 2020 & 2033
- Table 23: Global Low Loss Igbt Revenue million Forecast, by Country 2020 & 2033
- Table 24: Global Low Loss Igbt Volume K Forecast, by Country 2020 & 2033
- Table 25: Brazil Low Loss Igbt Revenue (million) Forecast, by Application 2020 & 2033
- Table 26: Brazil Low Loss Igbt Volume (K) Forecast, by Application 2020 & 2033
- Table 27: Argentina Low Loss Igbt Revenue (million) Forecast, by Application 2020 & 2033
- Table 28: Argentina Low Loss Igbt Volume (K) Forecast, by Application 2020 & 2033
- Table 29: Rest of South America Low Loss Igbt Revenue (million) Forecast, by Application 2020 & 2033
- Table 30: Rest of South America Low Loss Igbt Volume (K) Forecast, by Application 2020 & 2033
- Table 31: Global Low Loss Igbt Revenue million Forecast, by Application 2020 & 2033
- Table 32: Global Low Loss Igbt Volume K Forecast, by Application 2020 & 2033
- Table 33: Global Low Loss Igbt Revenue million Forecast, by Type 2020 & 2033
- Table 34: Global Low Loss Igbt Volume K Forecast, by Type 2020 & 2033
- Table 35: Global Low Loss Igbt Revenue million Forecast, by Country 2020 & 2033
- Table 36: Global Low Loss Igbt Volume K Forecast, by Country 2020 & 2033
- Table 37: United Kingdom Low Loss Igbt Revenue (million) Forecast, by Application 2020 & 2033
- Table 38: United Kingdom Low Loss Igbt Volume (K) Forecast, by Application 2020 & 2033
- Table 39: Germany Low Loss Igbt Revenue (million) Forecast, by Application 2020 & 2033
- Table 40: Germany Low Loss Igbt Volume (K) Forecast, by Application 2020 & 2033
- Table 41: France Low Loss Igbt Revenue (million) Forecast, by Application 2020 & 2033
- Table 42: France Low Loss Igbt Volume (K) Forecast, by Application 2020 & 2033
- Table 43: Italy Low Loss Igbt Revenue (million) Forecast, by Application 2020 & 2033
- Table 44: Italy Low Loss Igbt Volume (K) Forecast, by Application 2020 & 2033
- Table 45: Spain Low Loss Igbt Revenue (million) Forecast, by Application 2020 & 2033
- Table 46: Spain Low Loss Igbt Volume (K) Forecast, by Application 2020 & 2033
- Table 47: Russia Low Loss Igbt Revenue (million) Forecast, by Application 2020 & 2033
- Table 48: Russia Low Loss Igbt Volume (K) Forecast, by Application 2020 & 2033
- Table 49: Benelux Low Loss Igbt Revenue (million) Forecast, by Application 2020 & 2033
- Table 50: Benelux Low Loss Igbt Volume (K) Forecast, by Application 2020 & 2033
- Table 51: Nordics Low Loss Igbt Revenue (million) Forecast, by Application 2020 & 2033
- Table 52: Nordics Low Loss Igbt Volume (K) Forecast, by Application 2020 & 2033
- Table 53: Rest of Europe Low Loss Igbt Revenue (million) Forecast, by Application 2020 & 2033
- Table 54: Rest of Europe Low Loss Igbt Volume (K) Forecast, by Application 2020 & 2033
- Table 55: Global Low Loss Igbt Revenue million Forecast, by Application 2020 & 2033
- Table 56: Global Low Loss Igbt Volume K Forecast, by Application 2020 & 2033
- Table 57: Global Low Loss Igbt Revenue million Forecast, by Type 2020 & 2033
- Table 58: Global Low Loss Igbt Volume K Forecast, by Type 2020 & 2033
- Table 59: Global Low Loss Igbt Revenue million Forecast, by Country 2020 & 2033
- Table 60: Global Low Loss Igbt Volume K Forecast, by Country 2020 & 2033
- Table 61: Turkey Low Loss Igbt Revenue (million) Forecast, by Application 2020 & 2033
- Table 62: Turkey Low Loss Igbt Volume (K) Forecast, by Application 2020 & 2033
- Table 63: Israel Low Loss Igbt Revenue (million) Forecast, by Application 2020 & 2033
- Table 64: Israel Low Loss Igbt Volume (K) Forecast, by Application 2020 & 2033
- Table 65: GCC Low Loss Igbt Revenue (million) Forecast, by Application 2020 & 2033
- Table 66: GCC Low Loss Igbt Volume (K) Forecast, by Application 2020 & 2033
- Table 67: North Africa Low Loss Igbt Revenue (million) Forecast, by Application 2020 & 2033
- Table 68: North Africa Low Loss Igbt Volume (K) Forecast, by Application 2020 & 2033
- Table 69: South Africa Low Loss Igbt Revenue (million) Forecast, by Application 2020 & 2033
- Table 70: South Africa Low Loss Igbt Volume (K) Forecast, by Application 2020 & 2033
- Table 71: Rest of Middle East & Africa Low Loss Igbt Revenue (million) Forecast, by Application 2020 & 2033
- Table 72: Rest of Middle East & Africa Low Loss Igbt Volume (K) Forecast, by Application 2020 & 2033
- Table 73: Global Low Loss Igbt Revenue million Forecast, by Application 2020 & 2033
- Table 74: Global Low Loss Igbt Volume K Forecast, by Application 2020 & 2033
- Table 75: Global Low Loss Igbt Revenue million Forecast, by Type 2020 & 2033
- Table 76: Global Low Loss Igbt Volume K Forecast, by Type 2020 & 2033
- Table 77: Global Low Loss Igbt Revenue million Forecast, by Country 2020 & 2033
- Table 78: Global Low Loss Igbt Volume K Forecast, by Country 2020 & 2033
- Table 79: China Low Loss Igbt Revenue (million) Forecast, by Application 2020 & 2033
- Table 80: China Low Loss Igbt Volume (K) Forecast, by Application 2020 & 2033
- Table 81: India Low Loss Igbt Revenue (million) Forecast, by Application 2020 & 2033
- Table 82: India Low Loss Igbt Volume (K) Forecast, by Application 2020 & 2033
- Table 83: Japan Low Loss Igbt Revenue (million) Forecast, by Application 2020 & 2033
- Table 84: Japan Low Loss Igbt Volume (K) Forecast, by Application 2020 & 2033
- Table 85: South Korea Low Loss Igbt Revenue (million) Forecast, by Application 2020 & 2033
- Table 86: South Korea Low Loss Igbt Volume (K) Forecast, by Application 2020 & 2033
- Table 87: ASEAN Low Loss Igbt Revenue (million) Forecast, by Application 2020 & 2033
- Table 88: ASEAN Low Loss Igbt Volume (K) Forecast, by Application 2020 & 2033
- Table 89: Oceania Low Loss Igbt Revenue (million) Forecast, by Application 2020 & 2033
- Table 90: Oceania Low Loss Igbt Volume (K) Forecast, by Application 2020 & 2033
- Table 91: Rest of Asia Pacific Low Loss Igbt Revenue (million) Forecast, by Application 2020 & 2033
- Table 92: Rest of Asia Pacific Low Loss Igbt Volume (K) Forecast, by Application 2020 & 2033
Frequently Asked Questions
1. What is the projected Compound Annual Growth Rate (CAGR) of the Low Loss Igbt?
The projected CAGR is approximately 16.1%.
2. Which companies are prominent players in the Low Loss Igbt?
Key companies in the market include Toshiba, Infineon Technologies, STMicroelectronics, Fuji Electric, Mitsubishi Electric, Shenzhen China Micro Semicon, Renesas, Sanken Electric, BYD Semiconductor, StarPower Semiconductor, Onsemi, Yangzhou Yangjie Electronic Technology, ROHM, Toshiba.
3. What are the main segments of the Low Loss Igbt?
The market segments include Application, Type.
4. Can you provide details about the market size?
The market size is estimated to be USD 8176 million as of 2022.
5. What are some drivers contributing to market growth?
N/A
6. What are the notable trends driving market growth?
N/A
7. Are there any restraints impacting market growth?
N/A
8. Can you provide examples of recent developments in the market?
N/A
9. What pricing options are available for accessing the report?
Pricing options include single-user, multi-user, and enterprise licenses priced at USD 3950.00, USD 5925.00, and USD 7900.00 respectively.
10. Is the market size provided in terms of value or volume?
The market size is provided in terms of value, measured in million and volume, measured in K.
11. Are there any specific market keywords associated with the report?
Yes, the market keyword associated with the report is "Low Loss Igbt," which aids in identifying and referencing the specific market segment covered.
12. How do I determine which pricing option suits my needs best?
The pricing options vary based on user requirements and access needs. Individual users may opt for single-user licenses, while businesses requiring broader access may choose multi-user or enterprise licenses for cost-effective access to the report.
13. Are there any additional resources or data provided in the Low Loss Igbt report?
While the report offers comprehensive insights, it's advisable to review the specific contents or supplementary materials provided to ascertain if additional resources or data are available.
14. How can I stay updated on further developments or reports in the Low Loss Igbt?
To stay informed about further developments, trends, and reports in the Low Loss Igbt, consider subscribing to industry newsletters, following relevant companies and organizations, or regularly checking reputable industry news sources and publications.
Methodology
Step 1 - Identification of Relevant Samples Size from Population Database


Step 2 - Approaches for Defining Global Market Size (Value, Volume* & Price*)

Note*: In applicable scenarios
Step 3 - Data Sources
Primary Research
- Web Analytics
- Survey Reports
- Research Institute
- Latest Research Reports
- Opinion Leaders
Secondary Research
- Annual Reports
- White Paper
- Latest Press Release
- Industry Association
- Paid Database
- Investor Presentations

Step 4 - Data Triangulation
Involves using different sources of information in order to increase the validity of a study
These sources are likely to be stakeholders in a program - participants, other researchers, program staff, other community members, and so on.
Then we put all data in single framework & apply various statistical tools to find out the dynamic on the market.
During the analysis stage, feedback from the stakeholder groups would be compared to determine areas of agreement as well as areas of divergence