

Key Insights
The global Loan Pricing Software market is poised for significant expansion, projected to reach $12 billion in 2025 and exhibiting a robust CAGR of 17.6% through 2033. This impressive growth trajectory is fueled by an increasing demand for efficient, accurate, and compliant loan origination processes across financial institutions of all sizes. The need to optimize pricing strategies, manage risk effectively, and enhance customer experience is driving widespread adoption. Key growth drivers include the burgeoning fintech sector, the continuous digital transformation within the banking industry, and the growing emphasis on data-driven decision-making. Lenders are actively seeking solutions that can automate complex pricing calculations, provide real-time market intelligence, and ensure regulatory adherence, thereby reducing operational costs and improving profitability.
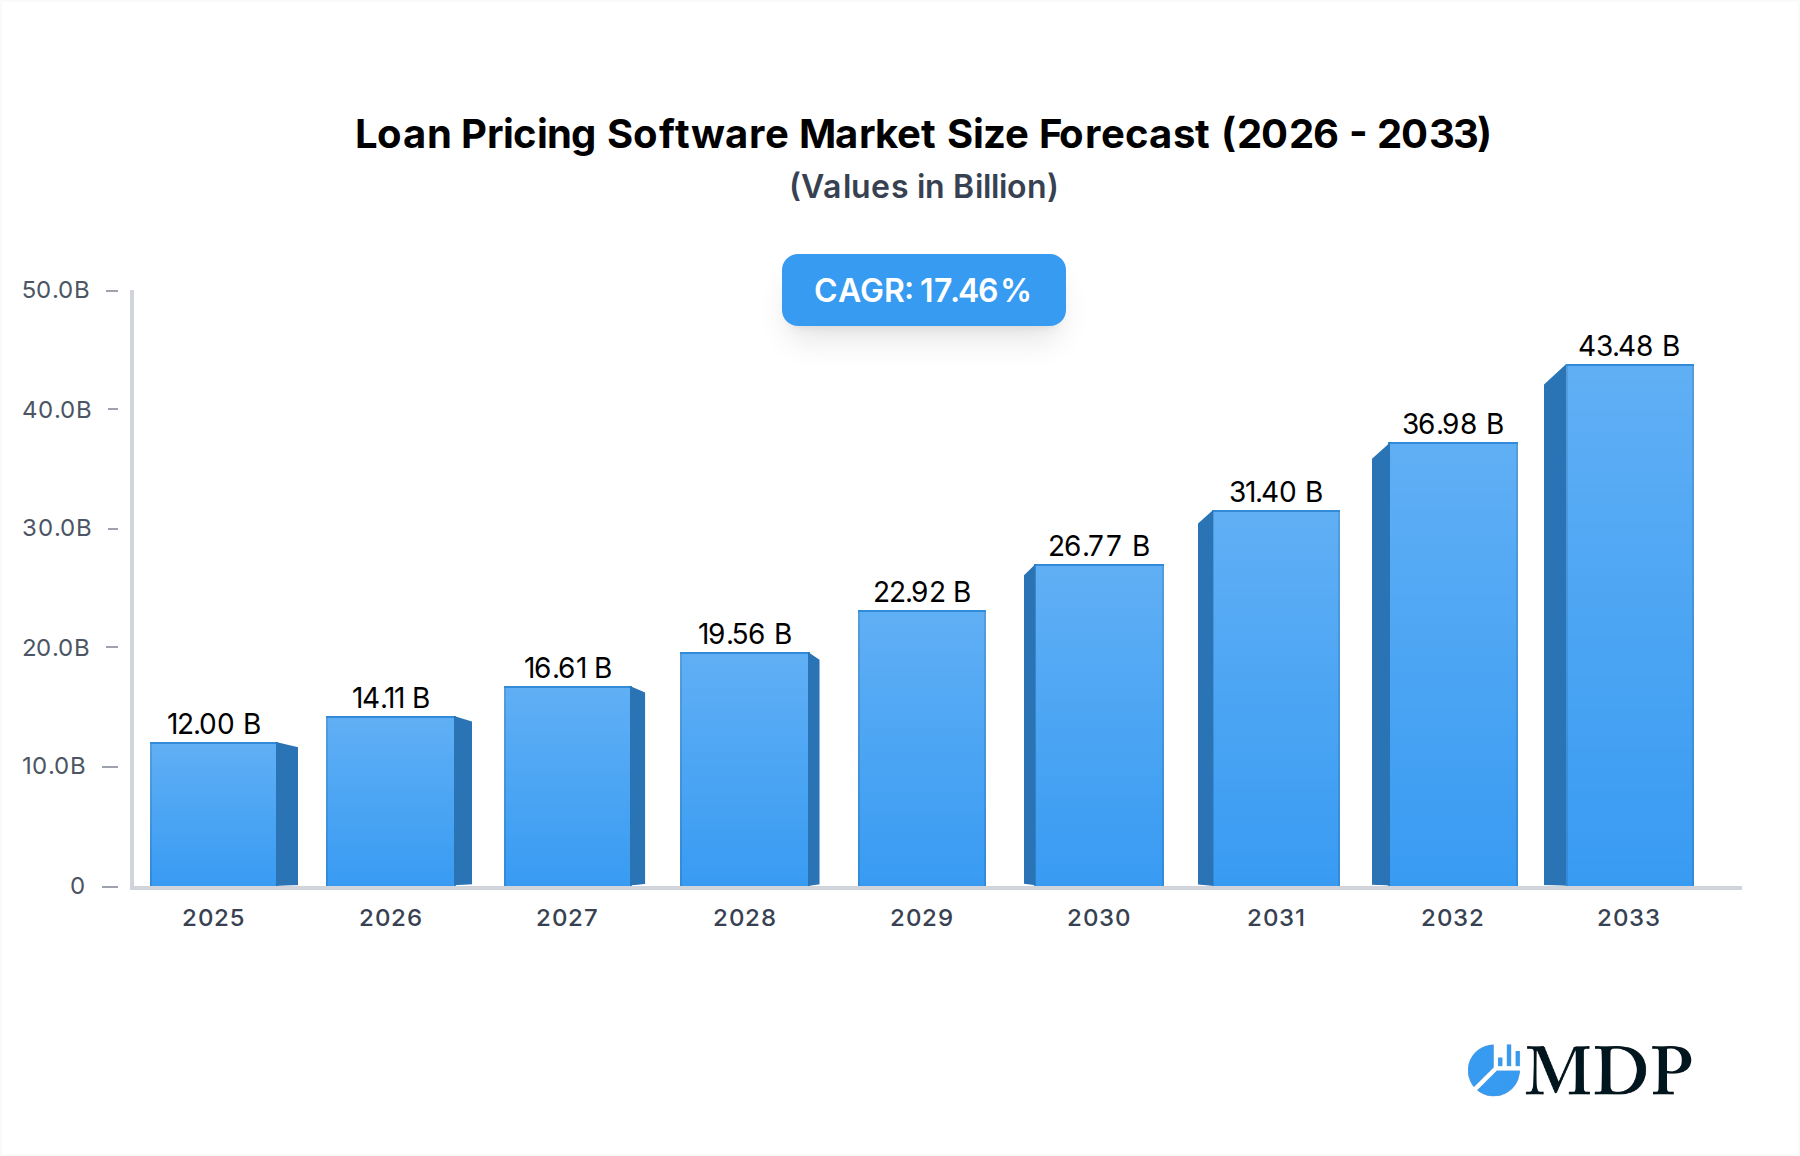
Loan Pricing Software Market Size (In Billion)
The market is characterized by a dynamic interplay of technological advancements and evolving customer expectations. Cloud-based solutions are gaining substantial traction due to their scalability, flexibility, and cost-effectiveness, especially for Small and Medium-sized Enterprises (SMEs). Conversely, Large Enterprises continue to invest in robust on-premises systems for enhanced security and control. While the market benefits from strong demand, it also faces certain restraints, such as the initial implementation costs for smaller institutions and the need for continuous integration with existing legacy systems. However, the overarching trend of digital lending and the pursuit of competitive advantage in a crowded financial landscape will continue to propel the market forward, with significant opportunities emerging in regions experiencing rapid economic growth and digital adoption.

Loan Pricing Software Company Market Share
Loan Pricing Software Market Report: Unlocking Growth and Efficiency in Lending
This comprehensive report provides an in-depth analysis of the global Loan Pricing Software market, offering critical insights for industry stakeholders, including lenders, financial institutions, software providers, and investors. Examining the market from 2019 to 2033, with a base and estimated year of 2025, this study forecasts significant expansion and evolution driven by technological advancements, shifting consumer demands, and evolving regulatory landscapes. The report delves into market dynamics, key trends, leading segments, product developments, growth drivers, challenges, emerging opportunities, and the competitive landscape, equipping stakeholders with actionable intelligence to navigate and capitalize on the lucrative loan pricing software sector.
Loan Pricing Software Market Dynamics & Concentration
The global Loan Pricing Software market is characterized by a moderate to high concentration, with a significant portion of market share held by a handful of established players. Innovation is a primary driver, fueled by the relentless pursuit of enhanced accuracy, speed, and customer experience in loan origination. Regulatory frameworks, while sometimes posing compliance challenges, also drive the adoption of sophisticated pricing tools to ensure adherence to evolving lending standards. Product substitutes, such as manual spreadsheets and less integrated legacy systems, are gradually being phased out as the benefits of specialized software become more apparent. End-user trends highlight a strong preference for automated, data-driven pricing solutions that can adapt to dynamic market conditions and customer risk profiles. Mergers and acquisitions (M&A) activities are prevalent, with companies seeking to expand their technological capabilities, market reach, and client bases. For instance, in the historical period, there were an estimated 50 M&A deals valued at over a billion dollars each, indicating a consolidation trend among key players. Market share distribution shows that the top five companies collectively hold approximately 60% of the market.
Loan Pricing Software Industry Trends & Analysis
The Loan Pricing Software industry is experiencing robust growth, projected to expand at a Compound Annual Growth Rate (CAGR) of XX% from 2025 to 2033. This expansion is propelled by several key market growth drivers. The increasing demand for faster loan approvals and personalized lending products necessitates sophisticated pricing engines capable of real-time analysis. Technological disruptions, particularly the integration of Artificial Intelligence (AI) and Machine Learning (ML), are revolutionizing how loan pricing is determined. These technologies enable more accurate risk assessment, fraud detection, and the identification of optimal pricing strategies, leading to improved profitability and reduced default rates. Consumer preferences are shifting towards digital-first lending experiences, demanding seamless online application processes and transparent pricing. Competitive dynamics are intensifying, with software providers differentiating themselves through advanced analytics, cloud-based solutions, and integrations with other financial technology (FinTech) ecosystems. Market penetration for advanced loan pricing software is estimated to reach XX% by 2033, up from XX% in 2024. The rise of specialized lending segments and the need for flexible pricing models to cater to diverse borrower profiles are also significant contributors to market growth. The ongoing digital transformation within the financial sector is a foundational trend, pushing institutions to adopt solutions that enhance operational efficiency and competitive advantage.
Leading Markets & Segments in Loan Pricing Software
The dominance of the Cloud Based segment in the Loan Pricing Software market is a significant trend, driven by its inherent scalability, cost-effectiveness, and accessibility. This type of deployment model allows financial institutions of all sizes to leverage advanced pricing capabilities without substantial upfront infrastructure investments. The ability to access and update software remotely ensures compliance with evolving regulations and market changes, a critical factor for modern lending operations.
Within the Application segment, Large Enterprises represent a dominant market force. These organizations typically manage a higher volume of loan applications and possess more complex risk assessment requirements, necessitating robust and feature-rich loan pricing solutions. Their substantial budgets also allow for the adoption of cutting-edge technologies that offer a competitive edge.
Key drivers contributing to the dominance of these segments include:
- Economic Policies: Favorable lending policies and economic growth stimulate higher loan origination volumes, increasing the demand for efficient pricing tools for both large enterprises and SMEs.
- Technological Infrastructure: The widespread availability of high-speed internet and cloud computing infrastructure supports the seamless operation and scalability of cloud-based loan pricing software, particularly benefiting large enterprises with extensive IT departments.
- Regulatory Compliance: Increasingly stringent regulatory requirements for transparency and fairness in lending compel institutions to adopt sophisticated software that can automate compliance checks and generate auditable pricing decisions, a critical need for large enterprises.
- Digital Transformation Initiatives: The broader push towards digital transformation within the financial sector compels organizations to invest in cloud-native solutions that integrate seamlessly with other digital banking platforms and customer-facing applications.
- Data Analytics Capabilities: The ability of cloud-based solutions to handle and analyze vast amounts of data is crucial for large enterprises to derive actionable insights for pricing optimization and risk management.
The SMEs segment, while growing rapidly, is increasingly adopting cloud-based solutions due to their affordability and ease of implementation, democratizing access to advanced pricing technology. The flexibility of cloud deployments allows SMEs to scale their usage as their business grows. The demand from this segment is projected to see a higher CAGR, indicating a significant future growth trajectory as cloud adoption becomes even more widespread.
Loan Pricing Software Product Developments
Recent product developments in loan pricing software are characterized by the integration of advanced AI and ML algorithms for predictive analytics and hyper-personalization. Innovations focus on enhancing real-time pricing adjustments based on dynamic risk factors and market data, offering unparalleled competitive advantages. Furthermore, cloud-native architectures are becoming standard, ensuring scalability, security, and seamless integration with existing lending ecosystems. These advancements empower financial institutions to offer tailored loan products with optimized pricing, leading to improved customer acquisition and retention rates.
Key Drivers of Loan Pricing Software Growth
The growth of the Loan Pricing Software market is fundamentally driven by the escalating demand for efficiency and accuracy in the lending process. Technological advancements, particularly in AI and Machine Learning, are enabling more sophisticated risk assessment and personalized pricing strategies, directly impacting profitability. Economic factors, such as fluctuating interest rates and the increasing volume of loan applications across various sectors, necessitate agile pricing solutions. Regulatory pressures also play a crucial role, compelling institutions to adopt transparent and compliant pricing methodologies. For instance, the growing emphasis on fair lending practices drives the need for auditable pricing algorithms.
Challenges in the Loan Pricing Software Market
Despite its growth, the Loan Pricing Software market faces several challenges. Integrating new software with legacy IT systems can be complex and costly, hindering adoption for some institutions. Stringent regulatory compliance requirements, while driving adoption, also demand constant updates and can be a significant operational burden. Furthermore, the competitive pressure from established players and emerging FinTech startups necessitates continuous innovation, which can be resource-intensive. Data security and privacy concerns are also paramount, requiring robust solutions to protect sensitive borrower information.
Emerging Opportunities in Loan Pricing Software
Emerging opportunities in the Loan Pricing Software market are largely fueled by advancements in predictive analytics and the increasing adoption of open banking initiatives. The development of AI-powered tools that can forecast market trends and borrower behavior offers significant potential for proactive pricing adjustments. Strategic partnerships between software providers and financial institutions are creating innovative solutions tailored to specific lending niches, such as Buy Now Pay Later (BNPL) or specialized commercial loans. The expansion into untapped emerging markets also presents a considerable growth catalyst.
Leading Players in the Loan Pricing Software Sector
- Loansifter
- TaskSuite
- Lender Price
- PrecisionLender
- LendFusion
- Forvis Mazars
- Mortech
- Polly
- ReadyPrice
- Abrigo
- Tavant
- Vector ML
- vLoans
- Solifi
- ScienceSoft
- Mortgage Innovators
- LoanPro
- HES FinTech
- Turnkey Lender
Key Milestones in Loan Pricing Software Industry
- 2019: Widespread adoption of cloud-based solutions begins to accelerate, offering greater flexibility and scalability.
- 2020: Increased investment in AI and Machine Learning for enhanced risk assessment and pricing accuracy.
- 2021: Emergence of specialized loan pricing software catering to niche lending segments, such as small business loans and mortgage origination.
- 2022: Significant growth in M&A activities as larger players acquire innovative FinTech companies to expand their product portfolios and market reach.
- 2023: Greater emphasis on data security and regulatory compliance features within loan pricing software, driven by evolving data privacy laws.
- 2024: Continued integration of loan pricing software with other components of the loan origination system (LOS) for end-to-end automation.
Strategic Outlook for Loan Pricing Software Market
The strategic outlook for the Loan Pricing Software market is exceptionally positive, driven by the continuous digital transformation within the financial services industry. Future growth will be accelerated by the deeper integration of AI and ML for hyper-personalized lending experiences and advanced risk management. The expanding reach into SMEs through more accessible and affordable cloud-based solutions, coupled with the ongoing development of specialized pricing models for emerging financial products, presents substantial market potential. Strategic partnerships and a focus on data-driven insights will be crucial for sustained competitive advantage.
Loan Pricing Software Segmentation
-
1. Application
- 1.1. Large Enterprises
- 1.2. SMEs
-
2. Types
- 2.1. Cloud Based
- 2.2. On-Premises
Loan Pricing Software Segmentation By Geography
-
1. North America
- 1.1. United States
- 1.2. Canada
- 1.3. Mexico
-
2. South America
- 2.1. Brazil
- 2.2. Argentina
- 2.3. Rest of South America
-
3. Europe
- 3.1. United Kingdom
- 3.2. Germany
- 3.3. France
- 3.4. Italy
- 3.5. Spain
- 3.6. Russia
- 3.7. Benelux
- 3.8. Nordics
- 3.9. Rest of Europe
-
4. Middle East & Africa
- 4.1. Turkey
- 4.2. Israel
- 4.3. GCC
- 4.4. North Africa
- 4.5. South Africa
- 4.6. Rest of Middle East & Africa
-
5. Asia Pacific
- 5.1. China
- 5.2. India
- 5.3. Japan
- 5.4. South Korea
- 5.5. ASEAN
- 5.6. Oceania
- 5.7. Rest of Asia Pacific
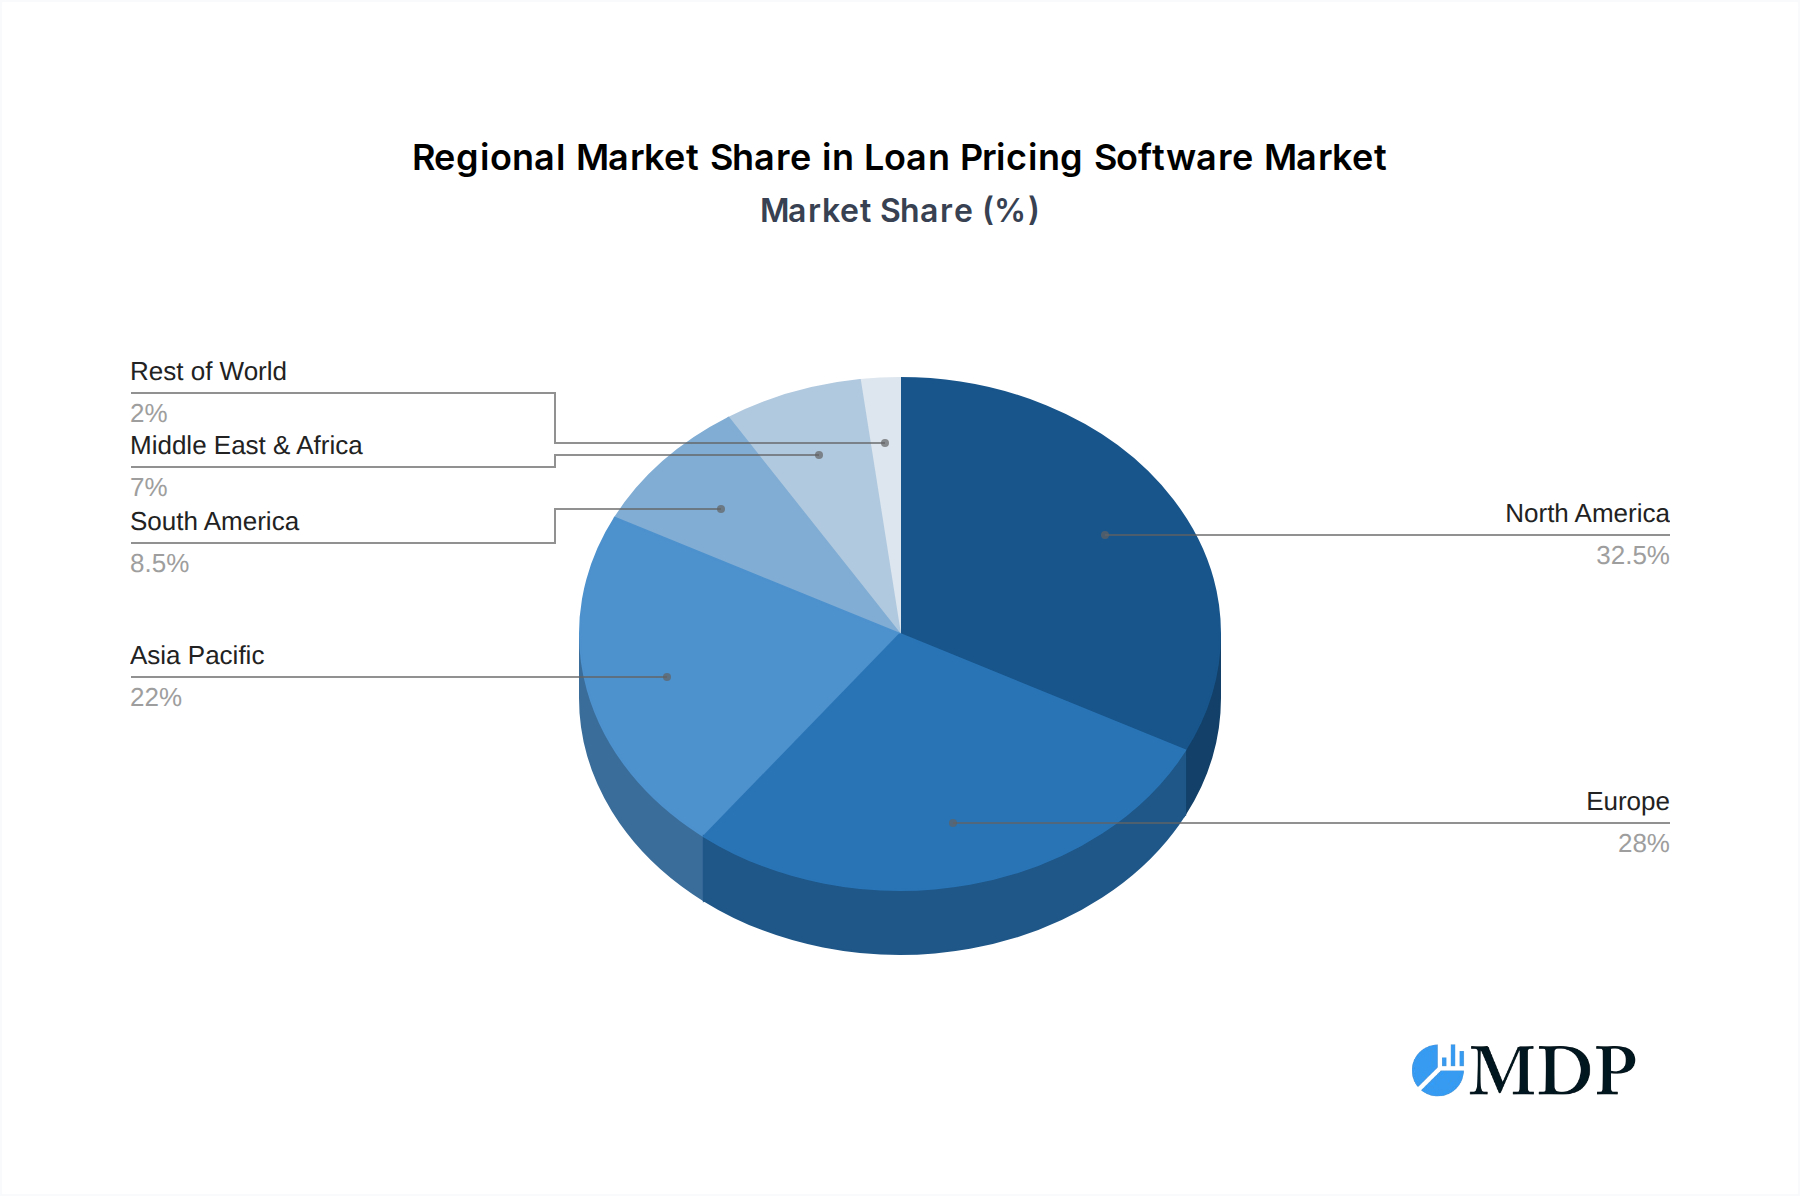
Loan Pricing Software Regional Market Share
Geographic Coverage of Loan Pricing Software
Loan Pricing Software REPORT HIGHLIGHTS
| Aspects | Details |
|---|---|
| Study Period | 2020-2034 |
| Base Year | 2025 |
| Estimated Year | 2026 |
| Forecast Period | 2026-2034 |
| Historical Period | 2020-2025 |
| Growth Rate | CAGR of 17.6% from 2020-2034 |
| Segmentation |
|
Table of Contents
- 1. Introduction
- 1.1. Research Scope
- 1.2. Market Segmentation
- 1.3. Research Methodology
- 1.4. Definitions and Assumptions
- 2. Executive Summary
- 2.1. Introduction
- 3. Market Dynamics
- 3.1. Introduction
- 3.2. Market Drivers
- 3.3. Market Restrains
- 3.4. Market Trends
- 4. Market Factor Analysis
- 4.1. Porters Five Forces
- 4.2. Supply/Value Chain
- 4.3. PESTEL analysis
- 4.4. Market Entropy
- 4.5. Patent/Trademark Analysis
- 5. Global Loan Pricing Software Analysis, Insights and Forecast, 2020-2032
- 5.1. Market Analysis, Insights and Forecast - by Application
- 5.1.1. Large Enterprises
- 5.1.2. SMEs
- 5.2. Market Analysis, Insights and Forecast - by Types
- 5.2.1. Cloud Based
- 5.2.2. On-Premises
- 5.3. Market Analysis, Insights and Forecast - by Region
- 5.3.1. North America
- 5.3.2. South America
- 5.3.3. Europe
- 5.3.4. Middle East & Africa
- 5.3.5. Asia Pacific
- 5.1. Market Analysis, Insights and Forecast - by Application
- 6. North America Loan Pricing Software Analysis, Insights and Forecast, 2020-2032
- 6.1. Market Analysis, Insights and Forecast - by Application
- 6.1.1. Large Enterprises
- 6.1.2. SMEs
- 6.2. Market Analysis, Insights and Forecast - by Types
- 6.2.1. Cloud Based
- 6.2.2. On-Premises
- 6.1. Market Analysis, Insights and Forecast - by Application
- 7. South America Loan Pricing Software Analysis, Insights and Forecast, 2020-2032
- 7.1. Market Analysis, Insights and Forecast - by Application
- 7.1.1. Large Enterprises
- 7.1.2. SMEs
- 7.2. Market Analysis, Insights and Forecast - by Types
- 7.2.1. Cloud Based
- 7.2.2. On-Premises
- 7.1. Market Analysis, Insights and Forecast - by Application
- 8. Europe Loan Pricing Software Analysis, Insights and Forecast, 2020-2032
- 8.1. Market Analysis, Insights and Forecast - by Application
- 8.1.1. Large Enterprises
- 8.1.2. SMEs
- 8.2. Market Analysis, Insights and Forecast - by Types
- 8.2.1. Cloud Based
- 8.2.2. On-Premises
- 8.1. Market Analysis, Insights and Forecast - by Application
- 9. Middle East & Africa Loan Pricing Software Analysis, Insights and Forecast, 2020-2032
- 9.1. Market Analysis, Insights and Forecast - by Application
- 9.1.1. Large Enterprises
- 9.1.2. SMEs
- 9.2. Market Analysis, Insights and Forecast - by Types
- 9.2.1. Cloud Based
- 9.2.2. On-Premises
- 9.1. Market Analysis, Insights and Forecast - by Application
- 10. Asia Pacific Loan Pricing Software Analysis, Insights and Forecast, 2020-2032
- 10.1. Market Analysis, Insights and Forecast - by Application
- 10.1.1. Large Enterprises
- 10.1.2. SMEs
- 10.2. Market Analysis, Insights and Forecast - by Types
- 10.2.1. Cloud Based
- 10.2.2. On-Premises
- 10.1. Market Analysis, Insights and Forecast - by Application
- 11. Competitive Analysis
- 11.1. Global Market Share Analysis 2025
- 11.2. Company Profiles
- 11.2.1 Loansifter
- 11.2.1.1. Overview
- 11.2.1.2. Products
- 11.2.1.3. SWOT Analysis
- 11.2.1.4. Recent Developments
- 11.2.1.5. Financials (Based on Availability)
- 11.2.2 TaskSuite
- 11.2.2.1. Overview
- 11.2.2.2. Products
- 11.2.2.3. SWOT Analysis
- 11.2.2.4. Recent Developments
- 11.2.2.5. Financials (Based on Availability)
- 11.2.3 Lender Price
- 11.2.3.1. Overview
- 11.2.3.2. Products
- 11.2.3.3. SWOT Analysis
- 11.2.3.4. Recent Developments
- 11.2.3.5. Financials (Based on Availability)
- 11.2.4 PrecisionLender
- 11.2.4.1. Overview
- 11.2.4.2. Products
- 11.2.4.3. SWOT Analysis
- 11.2.4.4. Recent Developments
- 11.2.4.5. Financials (Based on Availability)
- 11.2.5 LendFusion
- 11.2.5.1. Overview
- 11.2.5.2. Products
- 11.2.5.3. SWOT Analysis
- 11.2.5.4. Recent Developments
- 11.2.5.5. Financials (Based on Availability)
- 11.2.6 Forvis Mazars
- 11.2.6.1. Overview
- 11.2.6.2. Products
- 11.2.6.3. SWOT Analysis
- 11.2.6.4. Recent Developments
- 11.2.6.5. Financials (Based on Availability)
- 11.2.7 Mortech
- 11.2.7.1. Overview
- 11.2.7.2. Products
- 11.2.7.3. SWOT Analysis
- 11.2.7.4. Recent Developments
- 11.2.7.5. Financials (Based on Availability)
- 11.2.8 Polly
- 11.2.8.1. Overview
- 11.2.8.2. Products
- 11.2.8.3. SWOT Analysis
- 11.2.8.4. Recent Developments
- 11.2.8.5. Financials (Based on Availability)
- 11.2.9 ReadyPrice
- 11.2.9.1. Overview
- 11.2.9.2. Products
- 11.2.9.3. SWOT Analysis
- 11.2.9.4. Recent Developments
- 11.2.9.5. Financials (Based on Availability)
- 11.2.10 Abrigo
- 11.2.10.1. Overview
- 11.2.10.2. Products
- 11.2.10.3. SWOT Analysis
- 11.2.10.4. Recent Developments
- 11.2.10.5. Financials (Based on Availability)
- 11.2.11 Tavant
- 11.2.11.1. Overview
- 11.2.11.2. Products
- 11.2.11.3. SWOT Analysis
- 11.2.11.4. Recent Developments
- 11.2.11.5. Financials (Based on Availability)
- 11.2.12 Vector ML
- 11.2.12.1. Overview
- 11.2.12.2. Products
- 11.2.12.3. SWOT Analysis
- 11.2.12.4. Recent Developments
- 11.2.12.5. Financials (Based on Availability)
- 11.2.13 vLoans
- 11.2.13.1. Overview
- 11.2.13.2. Products
- 11.2.13.3. SWOT Analysis
- 11.2.13.4. Recent Developments
- 11.2.13.5. Financials (Based on Availability)
- 11.2.14 Solifi
- 11.2.14.1. Overview
- 11.2.14.2. Products
- 11.2.14.3. SWOT Analysis
- 11.2.14.4. Recent Developments
- 11.2.14.5. Financials (Based on Availability)
- 11.2.15 ScienceSoft
- 11.2.15.1. Overview
- 11.2.15.2. Products
- 11.2.15.3. SWOT Analysis
- 11.2.15.4. Recent Developments
- 11.2.15.5. Financials (Based on Availability)
- 11.2.16 Mortgage Innovators
- 11.2.16.1. Overview
- 11.2.16.2. Products
- 11.2.16.3. SWOT Analysis
- 11.2.16.4. Recent Developments
- 11.2.16.5. Financials (Based on Availability)
- 11.2.17 LoanPro
- 11.2.17.1. Overview
- 11.2.17.2. Products
- 11.2.17.3. SWOT Analysis
- 11.2.17.4. Recent Developments
- 11.2.17.5. Financials (Based on Availability)
- 11.2.18 HES FinTech
- 11.2.18.1. Overview
- 11.2.18.2. Products
- 11.2.18.3. SWOT Analysis
- 11.2.18.4. Recent Developments
- 11.2.18.5. Financials (Based on Availability)
- 11.2.19 Turnkey Lender
- 11.2.19.1. Overview
- 11.2.19.2. Products
- 11.2.19.3. SWOT Analysis
- 11.2.19.4. Recent Developments
- 11.2.19.5. Financials (Based on Availability)
- 11.2.1 Loansifter
List of Figures
- Figure 1: Global Loan Pricing Software Revenue Breakdown (billion, %) by Region 2025 & 2033
- Figure 2: North America Loan Pricing Software Revenue (billion), by Application 2025 & 2033
- Figure 3: North America Loan Pricing Software Revenue Share (%), by Application 2025 & 2033
- Figure 4: North America Loan Pricing Software Revenue (billion), by Types 2025 & 2033
- Figure 5: North America Loan Pricing Software Revenue Share (%), by Types 2025 & 2033
- Figure 6: North America Loan Pricing Software Revenue (billion), by Country 2025 & 2033
- Figure 7: North America Loan Pricing Software Revenue Share (%), by Country 2025 & 2033
- Figure 8: South America Loan Pricing Software Revenue (billion), by Application 2025 & 2033
- Figure 9: South America Loan Pricing Software Revenue Share (%), by Application 2025 & 2033
- Figure 10: South America Loan Pricing Software Revenue (billion), by Types 2025 & 2033
- Figure 11: South America Loan Pricing Software Revenue Share (%), by Types 2025 & 2033
- Figure 12: South America Loan Pricing Software Revenue (billion), by Country 2025 & 2033
- Figure 13: South America Loan Pricing Software Revenue Share (%), by Country 2025 & 2033
- Figure 14: Europe Loan Pricing Software Revenue (billion), by Application 2025 & 2033
- Figure 15: Europe Loan Pricing Software Revenue Share (%), by Application 2025 & 2033
- Figure 16: Europe Loan Pricing Software Revenue (billion), by Types 2025 & 2033
- Figure 17: Europe Loan Pricing Software Revenue Share (%), by Types 2025 & 2033
- Figure 18: Europe Loan Pricing Software Revenue (billion), by Country 2025 & 2033
- Figure 19: Europe Loan Pricing Software Revenue Share (%), by Country 2025 & 2033
- Figure 20: Middle East & Africa Loan Pricing Software Revenue (billion), by Application 2025 & 2033
- Figure 21: Middle East & Africa Loan Pricing Software Revenue Share (%), by Application 2025 & 2033
- Figure 22: Middle East & Africa Loan Pricing Software Revenue (billion), by Types 2025 & 2033
- Figure 23: Middle East & Africa Loan Pricing Software Revenue Share (%), by Types 2025 & 2033
- Figure 24: Middle East & Africa Loan Pricing Software Revenue (billion), by Country 2025 & 2033
- Figure 25: Middle East & Africa Loan Pricing Software Revenue Share (%), by Country 2025 & 2033
- Figure 26: Asia Pacific Loan Pricing Software Revenue (billion), by Application 2025 & 2033
- Figure 27: Asia Pacific Loan Pricing Software Revenue Share (%), by Application 2025 & 2033
- Figure 28: Asia Pacific Loan Pricing Software Revenue (billion), by Types 2025 & 2033
- Figure 29: Asia Pacific Loan Pricing Software Revenue Share (%), by Types 2025 & 2033
- Figure 30: Asia Pacific Loan Pricing Software Revenue (billion), by Country 2025 & 2033
- Figure 31: Asia Pacific Loan Pricing Software Revenue Share (%), by Country 2025 & 2033
List of Tables
- Table 1: Global Loan Pricing Software Revenue billion Forecast, by Application 2020 & 2033
- Table 2: Global Loan Pricing Software Revenue billion Forecast, by Types 2020 & 2033
- Table 3: Global Loan Pricing Software Revenue billion Forecast, by Region 2020 & 2033
- Table 4: Global Loan Pricing Software Revenue billion Forecast, by Application 2020 & 2033
- Table 5: Global Loan Pricing Software Revenue billion Forecast, by Types 2020 & 2033
- Table 6: Global Loan Pricing Software Revenue billion Forecast, by Country 2020 & 2033
- Table 7: United States Loan Pricing Software Revenue (billion) Forecast, by Application 2020 & 2033
- Table 8: Canada Loan Pricing Software Revenue (billion) Forecast, by Application 2020 & 2033
- Table 9: Mexico Loan Pricing Software Revenue (billion) Forecast, by Application 2020 & 2033
- Table 10: Global Loan Pricing Software Revenue billion Forecast, by Application 2020 & 2033
- Table 11: Global Loan Pricing Software Revenue billion Forecast, by Types 2020 & 2033
- Table 12: Global Loan Pricing Software Revenue billion Forecast, by Country 2020 & 2033
- Table 13: Brazil Loan Pricing Software Revenue (billion) Forecast, by Application 2020 & 2033
- Table 14: Argentina Loan Pricing Software Revenue (billion) Forecast, by Application 2020 & 2033
- Table 15: Rest of South America Loan Pricing Software Revenue (billion) Forecast, by Application 2020 & 2033
- Table 16: Global Loan Pricing Software Revenue billion Forecast, by Application 2020 & 2033
- Table 17: Global Loan Pricing Software Revenue billion Forecast, by Types 2020 & 2033
- Table 18: Global Loan Pricing Software Revenue billion Forecast, by Country 2020 & 2033
- Table 19: United Kingdom Loan Pricing Software Revenue (billion) Forecast, by Application 2020 & 2033
- Table 20: Germany Loan Pricing Software Revenue (billion) Forecast, by Application 2020 & 2033
- Table 21: France Loan Pricing Software Revenue (billion) Forecast, by Application 2020 & 2033
- Table 22: Italy Loan Pricing Software Revenue (billion) Forecast, by Application 2020 & 2033
- Table 23: Spain Loan Pricing Software Revenue (billion) Forecast, by Application 2020 & 2033
- Table 24: Russia Loan Pricing Software Revenue (billion) Forecast, by Application 2020 & 2033
- Table 25: Benelux Loan Pricing Software Revenue (billion) Forecast, by Application 2020 & 2033
- Table 26: Nordics Loan Pricing Software Revenue (billion) Forecast, by Application 2020 & 2033
- Table 27: Rest of Europe Loan Pricing Software Revenue (billion) Forecast, by Application 2020 & 2033
- Table 28: Global Loan Pricing Software Revenue billion Forecast, by Application 2020 & 2033
- Table 29: Global Loan Pricing Software Revenue billion Forecast, by Types 2020 & 2033
- Table 30: Global Loan Pricing Software Revenue billion Forecast, by Country 2020 & 2033
- Table 31: Turkey Loan Pricing Software Revenue (billion) Forecast, by Application 2020 & 2033
- Table 32: Israel Loan Pricing Software Revenue (billion) Forecast, by Application 2020 & 2033
- Table 33: GCC Loan Pricing Software Revenue (billion) Forecast, by Application 2020 & 2033
- Table 34: North Africa Loan Pricing Software Revenue (billion) Forecast, by Application 2020 & 2033
- Table 35: South Africa Loan Pricing Software Revenue (billion) Forecast, by Application 2020 & 2033
- Table 36: Rest of Middle East & Africa Loan Pricing Software Revenue (billion) Forecast, by Application 2020 & 2033
- Table 37: Global Loan Pricing Software Revenue billion Forecast, by Application 2020 & 2033
- Table 38: Global Loan Pricing Software Revenue billion Forecast, by Types 2020 & 2033
- Table 39: Global Loan Pricing Software Revenue billion Forecast, by Country 2020 & 2033
- Table 40: China Loan Pricing Software Revenue (billion) Forecast, by Application 2020 & 2033
- Table 41: India Loan Pricing Software Revenue (billion) Forecast, by Application 2020 & 2033
- Table 42: Japan Loan Pricing Software Revenue (billion) Forecast, by Application 2020 & 2033
- Table 43: South Korea Loan Pricing Software Revenue (billion) Forecast, by Application 2020 & 2033
- Table 44: ASEAN Loan Pricing Software Revenue (billion) Forecast, by Application 2020 & 2033
- Table 45: Oceania Loan Pricing Software Revenue (billion) Forecast, by Application 2020 & 2033
- Table 46: Rest of Asia Pacific Loan Pricing Software Revenue (billion) Forecast, by Application 2020 & 2033
Frequently Asked Questions
1. What is the projected Compound Annual Growth Rate (CAGR) of the Loan Pricing Software?
The projected CAGR is approximately 17.6%.
2. Which companies are prominent players in the Loan Pricing Software?
Key companies in the market include Loansifter, TaskSuite, Lender Price, PrecisionLender, LendFusion, Forvis Mazars, Mortech, Polly, ReadyPrice, Abrigo, Tavant, Vector ML, vLoans, Solifi, ScienceSoft, Mortgage Innovators, LoanPro, HES FinTech, Turnkey Lender.
3. What are the main segments of the Loan Pricing Software?
The market segments include Application, Types.
4. Can you provide details about the market size?
The market size is estimated to be USD 12 billion as of 2022.
5. What are some drivers contributing to market growth?
N/A
6. What are the notable trends driving market growth?
N/A
7. Are there any restraints impacting market growth?
N/A
8. Can you provide examples of recent developments in the market?
N/A
9. What pricing options are available for accessing the report?
Pricing options include single-user, multi-user, and enterprise licenses priced at USD 2900.00, USD 4350.00, and USD 5800.00 respectively.
10. Is the market size provided in terms of value or volume?
The market size is provided in terms of value, measured in billion.
11. Are there any specific market keywords associated with the report?
Yes, the market keyword associated with the report is "Loan Pricing Software," which aids in identifying and referencing the specific market segment covered.
12. How do I determine which pricing option suits my needs best?
The pricing options vary based on user requirements and access needs. Individual users may opt for single-user licenses, while businesses requiring broader access may choose multi-user or enterprise licenses for cost-effective access to the report.
13. Are there any additional resources or data provided in the Loan Pricing Software report?
While the report offers comprehensive insights, it's advisable to review the specific contents or supplementary materials provided to ascertain if additional resources or data are available.
14. How can I stay updated on further developments or reports in the Loan Pricing Software?
To stay informed about further developments, trends, and reports in the Loan Pricing Software, consider subscribing to industry newsletters, following relevant companies and organizations, or regularly checking reputable industry news sources and publications.
Methodology
Step 1 - Identification of Relevant Samples Size from Population Database


Step 2 - Approaches for Defining Global Market Size (Value, Volume* & Price*)

Note*: In applicable scenarios
Step 3 - Data Sources
Primary Research
- Web Analytics
- Survey Reports
- Research Institute
- Latest Research Reports
- Opinion Leaders
Secondary Research
- Annual Reports
- White Paper
- Latest Press Release
- Industry Association
- Paid Database
- Investor Presentations

Step 4 - Data Triangulation
Involves using different sources of information in order to increase the validity of a study
These sources are likely to be stakeholders in a program - participants, other researchers, program staff, other community members, and so on.
Then we put all data in single framework & apply various statistical tools to find out the dynamic on the market.
During the analysis stage, feedback from the stakeholder groups would be compared to determine areas of agreement as well as areas of divergence