

Key Insights
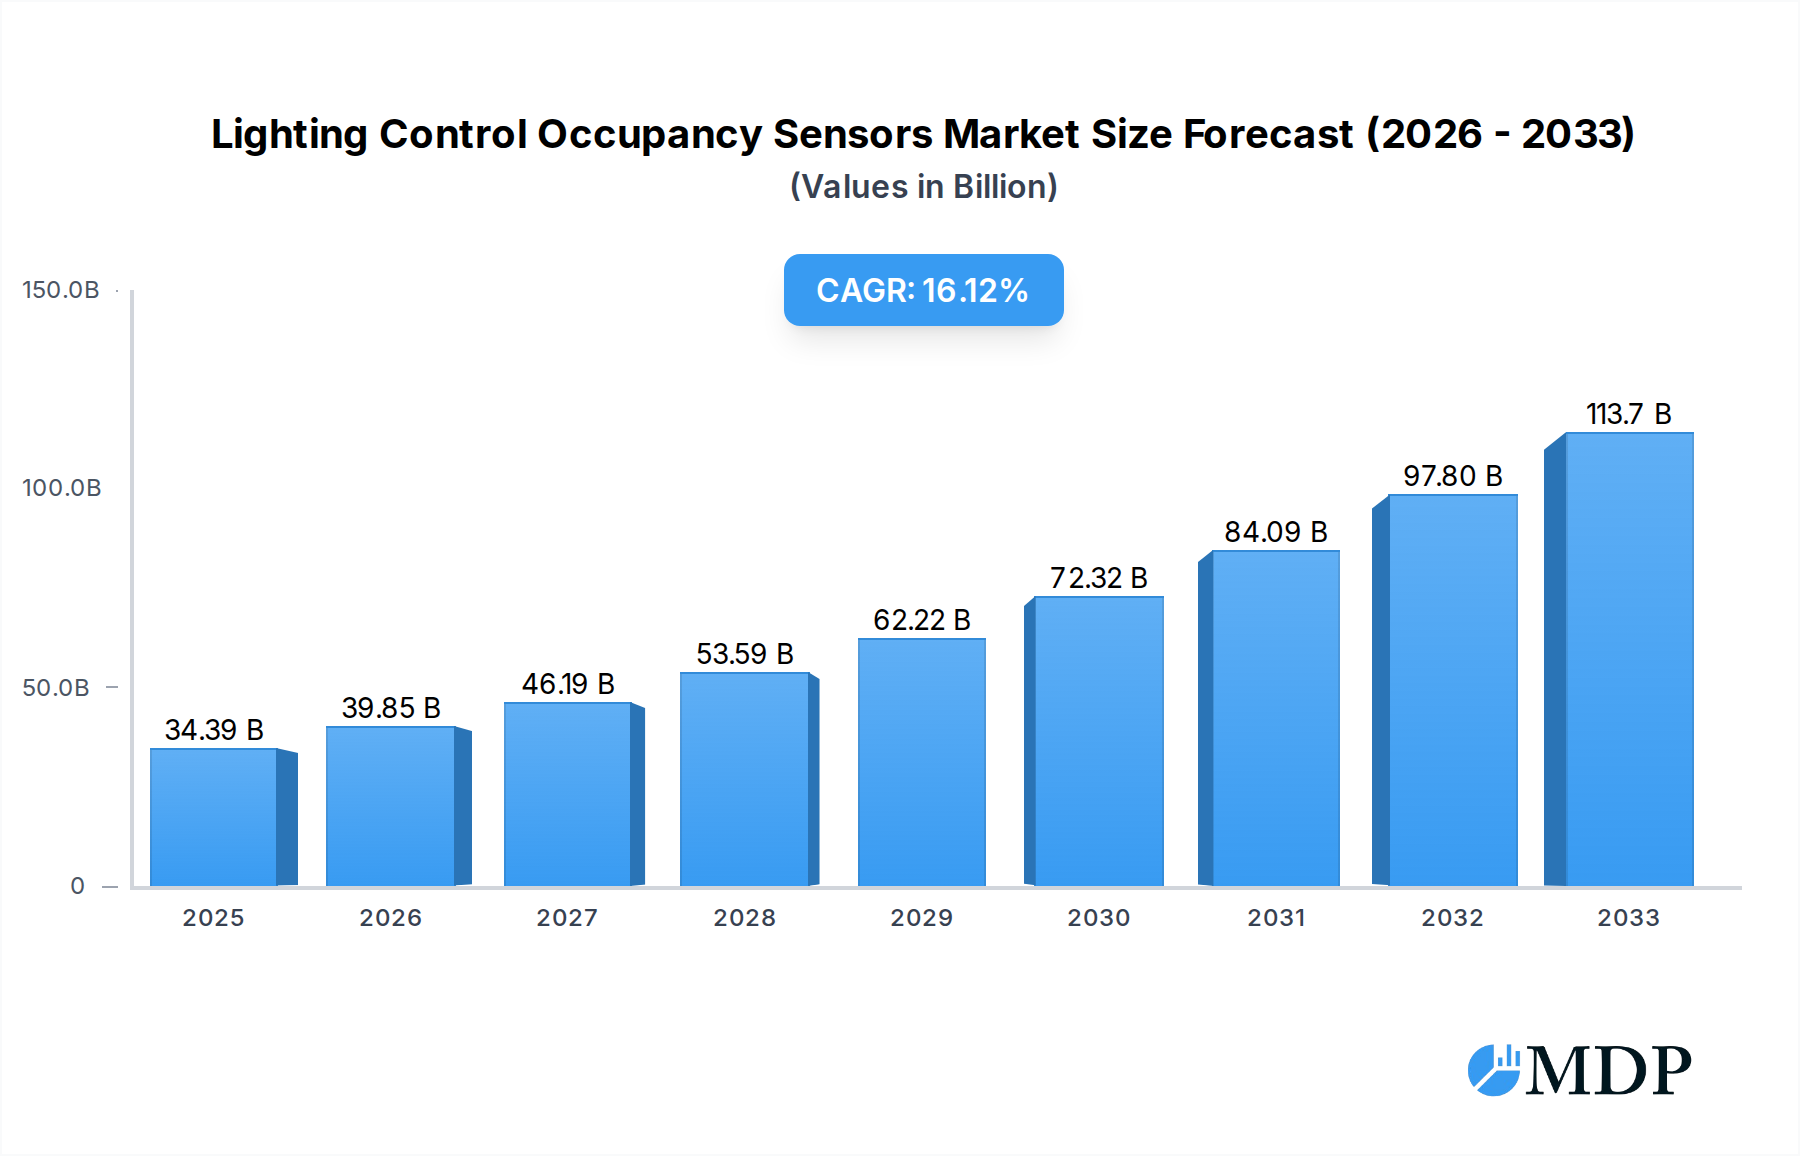
The global Lighting Control Occupancy Sensors market is poised for substantial growth, estimated to reach $34,393.9 million in 2025, driven by an anticipated CAGR of 15.9% from 2025 to 2033. This robust expansion is primarily fueled by the escalating demand for energy efficiency and sustainability across residential and non-residential sectors. Governments worldwide are implementing stringent energy regulations, mandating the use of smart lighting solutions that incorporate occupancy sensing technology to reduce unnecessary energy consumption. Furthermore, the increasing adoption of smart home and smart building technologies, coupled with advancements in sensor technology offering enhanced accuracy and integration capabilities, are key growth accelerators. The residential segment, benefiting from increasing consumer awareness of energy savings and the convenience offered by automated lighting, is a significant contributor. Simultaneously, the non-residential sector, encompassing commercial, industrial, and institutional buildings, is witnessing widespread adoption due to significant operational cost reductions and improved occupant comfort and productivity. Innovations in Passive Infrared (PIR) sensors, Ultrasonic Sensors, and Dual-technology Occupancy Sensors are expanding application possibilities and improving performance.

Lighting Control Occupancy Sensors Market Size (In Billion)
The market is characterized by a competitive landscape with major players like Signify, Schneider Electric, Honeywell, and Johnson Controls actively innovating and expanding their product portfolios. These companies are focusing on developing intelligent, connected occupancy sensors that seamlessly integrate with building management systems (BMS) and IoT platforms. Key trends include the rise of wireless sensor networks, miniaturization of sensors for discrete integration, and the development of sensors with enhanced detection capabilities and longer lifespans. While the market exhibits strong growth potential, certain factors could pose challenges. High initial installation costs for sophisticated systems in some regions, coupled with the need for skilled installation and maintenance, might present adoption hurdles. However, the long-term benefits of energy savings and compliance with evolving environmental standards are expected to outweigh these concerns, ensuring a positive trajectory for the Lighting Control Occupancy Sensors market throughout the forecast period. The Asia Pacific region, particularly China and India, is anticipated to be a significant growth engine due to rapid urbanization and increasing investments in smart infrastructure.
Lighting Control Occupancy Sensors Company Market Share
Lighting Control Occupancy Sensors Market Report: Comprehensive Analysis and Future Outlook (2019-2033)
This in-depth report provides a comprehensive analysis of the global Lighting Control Occupancy Sensors market, a critical component in modern energy-efficient building management. With extensive coverage from 2019 to 2033, including historical data, base year insights for 2025, and a detailed forecast period of 2025-2033, this report is indispensable for industry stakeholders seeking to understand market dynamics, identify growth opportunities, and navigate competitive landscapes. The study analyzes key segments including Residential and Non-residential applications, and sensor types such as PIR (Passive Infrared) Sensors, Ultrasonic Sensors, and Dual-technology Occupancy Sensors. Key industry developments and strategic insights from major players like Signify, Schneider Electric, Honeywell, GE Current, Johnson Controls, Legrand, Crestron Electronics, Lutron Electronics, Acuity Brands, OPTEX, Leviton Manufacturing Co., Inc, Enerlites, Hubbell, are incorporated. This report aims to equip businesses with actionable intelligence for strategic planning and market penetration.
Lighting Control Occupancy Sensors Market Dynamics & Concentration
The lighting control occupancy sensors market is characterized by a moderate to high level of concentration, with leading players like Signify, Schneider Electric, and Lutron Electronics holding significant market share, estimated to be over 30% collectively. Innovation drivers are primarily fueled by the increasing demand for energy efficiency, smart building integration, and government regulations mandating energy savings. Regulatory frameworks, such as building energy codes and environmental standards, play a crucial role in shaping market growth. Product substitutes exist, including simple timers and manual controls, but occupancy sensors offer superior automation and energy savings. End-user trends are shifting towards smart home and smart building solutions, emphasizing convenience, comfort, and cost reduction. Mergers and Acquisitions (M&A) activities, with an estimated 15-20 significant deals recorded during the historical period, are crucial for market consolidation and technology acquisition, with Johnson Controls and Honeywell being active participants. The market is projected to witness continued M&A, with an anticipated 25-30 deals over the forecast period, underscoring the strategic importance of this sector.
Lighting Control Occupancy Sensors Industry Trends & Analysis
The lighting control occupancy sensors industry is poised for robust growth, driven by an escalating global imperative for energy conservation and the burgeoning adoption of smart building technologies. Market growth is significantly propelled by increasing awareness of the environmental impact of energy consumption and the resultant economic benefits of reducing electricity bills. Technological disruptions, particularly in the realm of IoT integration and AI-powered sensing capabilities, are revolutionizing the functionality and precision of occupancy sensors. These advancements enable seamless integration with other building management systems, offering sophisticated automation and predictive energy management. Consumer preferences are increasingly leaning towards automated, intuitive, and cost-effective solutions. The residential sector, in particular, is experiencing a surge in demand for smart home devices, including occupancy sensors that enhance convenience and contribute to energy savings. In the non-residential sector, commercial buildings, offices, and industrial facilities are adopting these sensors to comply with stringent energy efficiency regulations and to optimize operational costs. The competitive dynamics within the market are intense, with established players investing heavily in R&D to develop more advanced, user-friendly, and cost-effective sensor solutions. The market penetration of occupancy sensors, currently estimated at around 40% in developed non-residential markets, is projected to increase significantly, reaching an estimated 65% by 2033. The compound annual growth rate (CAGR) for the global lighting control occupancy sensors market is conservatively estimated at 8.5% for the forecast period (2025-2033). This sustained growth trajectory is underpinned by continuous innovation, favorable government policies, and a growing demand for sustainable building solutions. The market size is expected to grow from approximately $2,000 million in the base year 2025 to over $3,800 million by 2033.
Leading Markets & Segments in Lighting Control Occupancy Sensors
The lighting control occupancy sensors market showcases distinct regional dominance and segment preferences. North America, driven by early adoption of smart technologies and stringent energy efficiency standards, currently represents the largest market, accounting for an estimated 35% of the global market share. The United States, in particular, leads with a strong focus on both residential and non-residential applications.
Application Segments:
- Non-residential: This segment is the dominant force, driven by substantial demand from commercial offices, retail spaces, educational institutions, and healthcare facilities. Key drivers include:
- Cost Savings: Significant reduction in electricity bills through automated lighting control.
- Regulatory Compliance: Adherence to building energy codes and sustainability mandates.
- Occupant Comfort & Productivity: Optimized lighting conditions for enhanced well-being and performance.
- Smart Building Integration: Seamless integration with broader Building Management Systems (BMS) for holistic control.
- Residential: This segment is experiencing rapid growth, fueled by the smart home revolution and increasing consumer awareness of energy conservation. Key drivers include:
- Convenience: Automated lighting that responds to presence.
- Energy Efficiency: Reduced energy consumption and lower utility bills.
- Aesthetic Appeal: Integration with smart home ecosystems for enhanced living spaces.
- Technological Advancements: Availability of user-friendly, wirelessly connected sensors.
Sensor Type Segments:
- PIR (Passive Infrared) Sensors: These remain the most widely adopted type due to their cost-effectiveness and reliability for detecting human motion based on body heat. Their dominance is attributed to their widespread application in standard commercial and residential settings.
- Ultrasonic Sensors: Offering higher sensitivity and the ability to detect motion behind obstacles, ultrasonic sensors are gaining traction in larger spaces and areas with irregular occupancy patterns.
- Dual-technology Occupancy Sensors: Combining PIR and ultrasonic technologies, these offer superior accuracy and reduced false triggers, making them ideal for complex environments like large meeting rooms or warehouses. Their growing adoption reflects a demand for advanced performance.
- Others: This category includes advanced sensing technologies like microwave and infrared beam break sensors, which cater to niche applications requiring specialized detection capabilities.
The strong performance of the non-residential segment, particularly in North America and Europe, combined with the rapid expansion of the residential segment fueled by smart home trends, forms the core of the market's growth. The dominance of PIR sensors, while still significant, is gradually being complemented by the increasing adoption of dual-technology sensors as users seek enhanced reliability and performance. The market size for non-residential applications is projected to be over $2,800 million by 2033, while the residential segment is expected to reach over $1,000 million by the same year.
Lighting Control Occupancy Sensors Product Developments
The lighting control occupancy sensors market is witnessing continuous product innovation focused on enhanced accuracy, interoperability, and user experience. Key developments include the integration of advanced AI algorithms for more intelligent presence detection, reducing false triggers and optimizing energy savings. Product offerings are increasingly incorporating wireless connectivity protocols like Zigbee, Z-Wave, and Wi-Fi for seamless integration into smart home and smart building ecosystems. Furthermore, manufacturers are developing sensors with sleeker designs, easier installation, and extended battery life. Competitive advantages are being built around features such as daylight harvesting capabilities, granular control over lighting zones, and remote monitoring and management through mobile applications. The market is also seeing a trend towards miniaturization and discreet sensor designs for aesthetic appeal in both residential and commercial spaces.
Key Drivers of Lighting Control Occupancy Sensors Growth
The growth of the lighting control occupancy sensors market is propelled by a confluence of technological, economic, and regulatory factors.
- Energy Efficiency Mandates: Government regulations and sustainability initiatives worldwide are increasingly pushing for energy conservation, making occupancy sensors a vital tool for compliance and cost reduction.
- Smart Building and IoT Adoption: The widespread integration of the Internet of Things (IoT) in buildings is driving demand for connected devices, including occupancy sensors, that contribute to automated and intelligent building management.
- Cost Savings and ROI: The tangible economic benefits of reduced electricity consumption and lower operational costs present a compelling return on investment for businesses and homeowners, accelerating adoption.
- Technological Advancements: Continuous improvements in sensor technology, such as enhanced accuracy, wireless connectivity, and AI integration, are making occupancy sensors more effective and user-friendly.
Challenges in the Lighting Control Occupancy Sensors Market
Despite its promising growth, the lighting control occupancy sensors market faces several challenges that could restrain its full potential.
- Initial Installation Cost: The upfront investment for sophisticated occupancy sensor systems can be a barrier, particularly for smaller businesses or budget-conscious homeowners.
- Complexity of Integration: Integrating occupancy sensors with existing building management systems can sometimes be complex, requiring specialized knowledge and technical expertise.
- False Triggering and User Perception: While improving, instances of false triggering (lights turning off unexpectedly) or non-triggering can lead to user dissatisfaction and a perception of unreliability.
- Supply Chain Volatility: Global supply chain disruptions and component shortages can impact manufacturing timelines and product availability, potentially leading to price fluctuations. The estimated impact of these challenges could lead to a 5-10% slower growth rate in specific sub-segments without proactive mitigation.
Emerging Opportunities in Lighting Control Occupancy Sensors
The lighting control occupancy sensors market is ripe with emerging opportunities driven by technological innovation and evolving market demands. The increasing sophistication of AI and machine learning algorithms presents an opportunity for "predictive occupancy" sensing, anticipating user needs and optimizing energy usage even before direct detection. Strategic partnerships between sensor manufacturers and smart home/building platform providers can unlock new market segments and enhance product integration. Furthermore, the growing global emphasis on sustainable building practices and green certifications creates a fertile ground for occupancy sensors, particularly in emerging economies where adoption is still nascent. Expansion into niche applications such as smart retail analytics, elder care monitoring, and industrial automation also offers significant untapped potential, with an estimated market expansion opportunity exceeding $500 million in these areas over the forecast period.
Leading Players in the Lighting Control Occupancy Sensors Sector
- Signify
- Schneider Electric
- Honeywell
- GE Current
- Johnson Controls
- Legrand
- Crestron Electronics
- Lutron Electronics
- Acuity Brands
- OPTEX
- Leviton Manufacturing Co., Inc
- Enerlites
- Hubbell
Key Milestones in Lighting Control Occupancy Sensors Industry
- 2019: Increased adoption of wireless protocols like Zigbee and Z-Wave for occupancy sensors, enhancing smart home integration.
- 2020: Growing demand for dual-technology sensors due to improved accuracy and reduced false triggers in commercial spaces.
- 2021: Significant advancements in AI and machine learning integration for more intelligent presence detection.
- 2022: Expansion of smart building standards (e.g., BACnet, KNX) to better accommodate occupancy sensor data.
- 2023: Introduction of energy-harvesting technologies for battery-less occupancy sensors in select applications.
- 2024: Increased focus on cybersecurity for connected occupancy sensor systems.
Strategic Outlook for Lighting Control Occupancy Sensors Market
The lighting control occupancy sensors market is set for continued expansion, driven by the persistent demand for energy efficiency and the unstoppable march of smart technology. Future growth will be accelerated by advancements in AI-powered sensing for predictive occupancy management, enabling even greater energy savings and user convenience. Strategic emphasis on seamless integration with broader smart building ecosystems, including HVAC and security systems, will be crucial for market leadership. Manufacturers that focus on developing user-friendly interfaces, robust data analytics capabilities, and sustainable product lifecycles will be well-positioned to capitalize on the evolving market landscape. The market is projected to see an expansion of over 50% in value by 2033, presenting substantial opportunities for innovation and market penetration.
Lighting Control Occupancy Sensors Segmentation
-
1. Application
- 1.1. Residential
- 1.2. Non-residential
-
2. Types
- 2.1. PIR (Passive Infrared) Sensors
- 2.2. Ultrasonic Sensors
- 2.3. Dual-technology Occupancy Sensors
- 2.4. Others
Lighting Control Occupancy Sensors Segmentation By Geography
-
1. North America
- 1.1. United States
- 1.2. Canada
- 1.3. Mexico
-
2. South America
- 2.1. Brazil
- 2.2. Argentina
- 2.3. Rest of South America
-
3. Europe
- 3.1. United Kingdom
- 3.2. Germany
- 3.3. France
- 3.4. Italy
- 3.5. Spain
- 3.6. Russia
- 3.7. Benelux
- 3.8. Nordics
- 3.9. Rest of Europe
-
4. Middle East & Africa
- 4.1. Turkey
- 4.2. Israel
- 4.3. GCC
- 4.4. North Africa
- 4.5. South Africa
- 4.6. Rest of Middle East & Africa
-
5. Asia Pacific
- 5.1. China
- 5.2. India
- 5.3. Japan
- 5.4. South Korea
- 5.5. ASEAN
- 5.6. Oceania
- 5.7. Rest of Asia Pacific
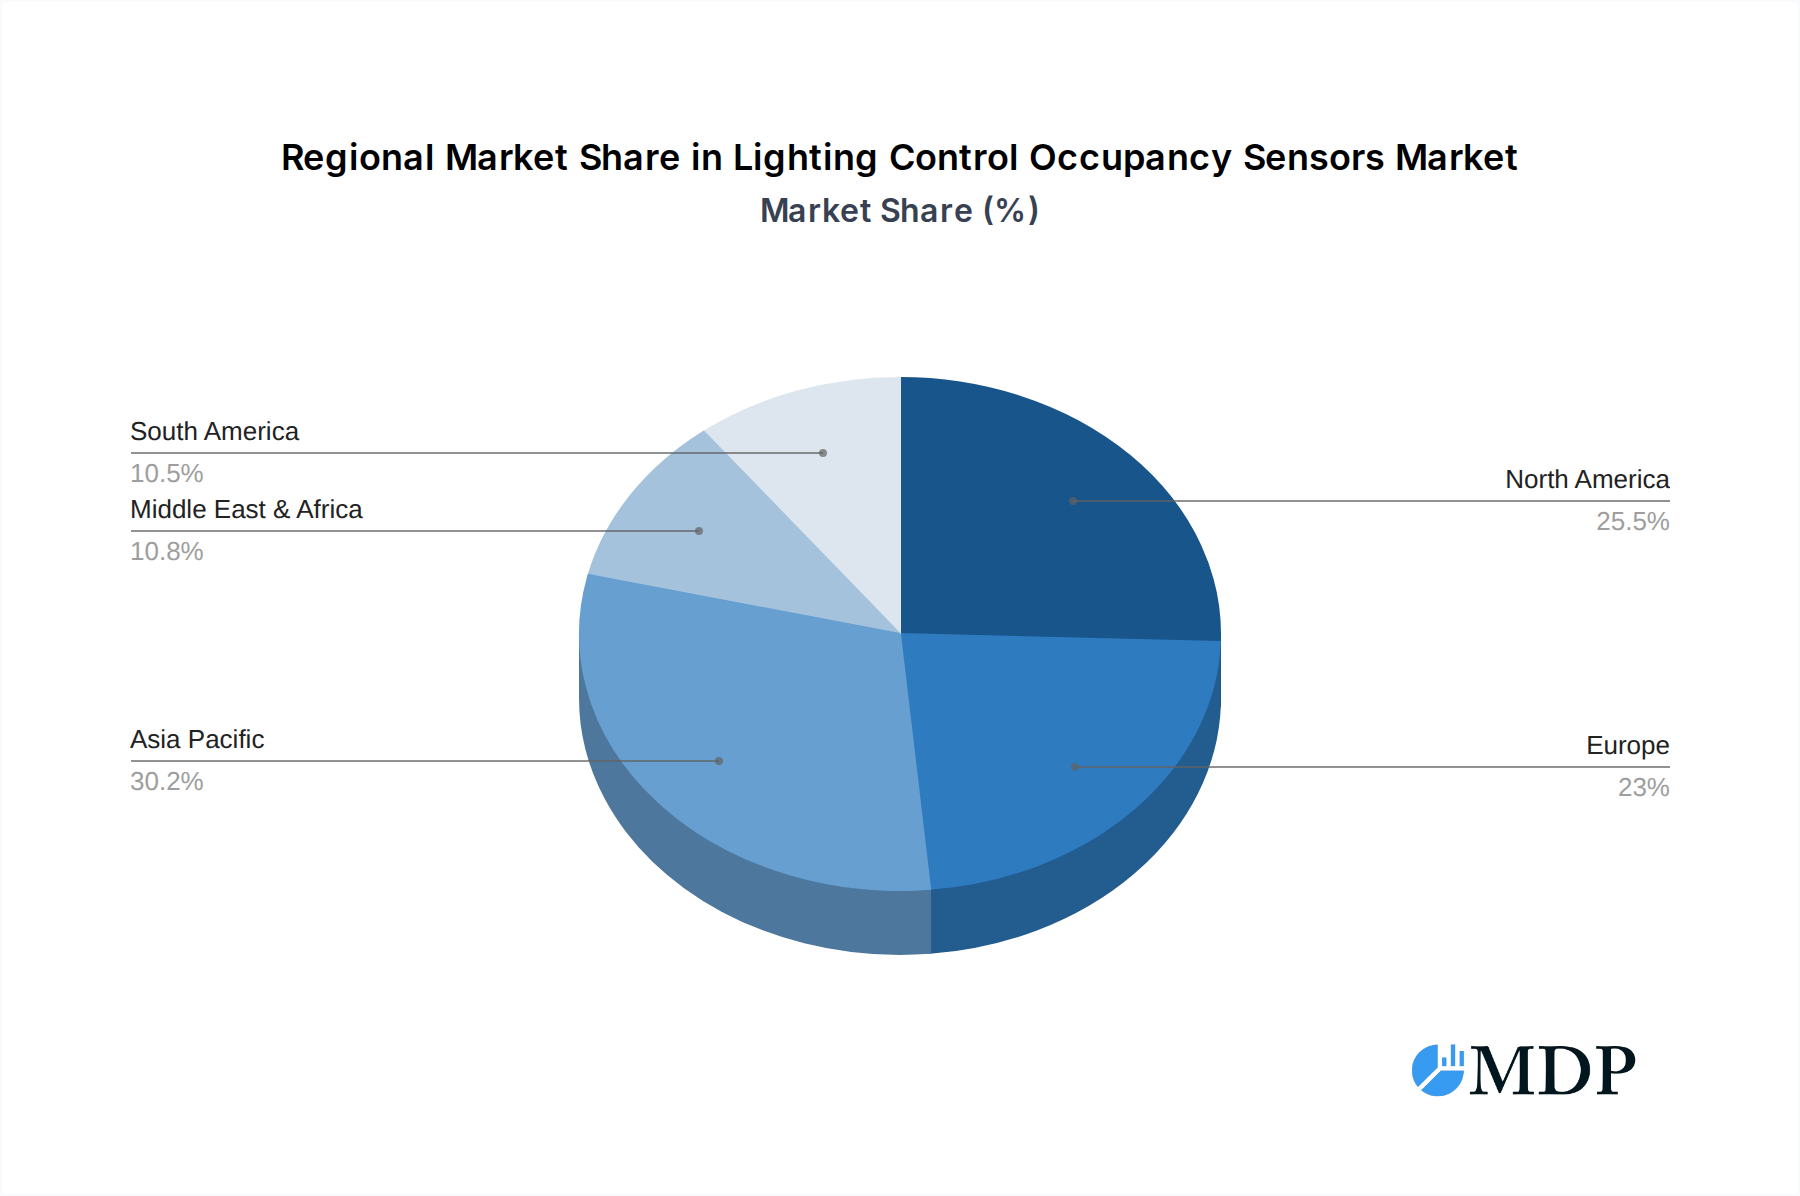
Lighting Control Occupancy Sensors Regional Market Share
Geographic Coverage of Lighting Control Occupancy Sensors
Lighting Control Occupancy Sensors REPORT HIGHLIGHTS
| Aspects | Details |
|---|---|
| Study Period | 2020-2034 |
| Base Year | 2025 |
| Estimated Year | 2026 |
| Forecast Period | 2026-2034 |
| Historical Period | 2020-2025 |
| Growth Rate | CAGR of 15.9% from 2020-2034 |
| Segmentation |
|
Table of Contents
- 1. Introduction
- 1.1. Research Scope
- 1.2. Market Segmentation
- 1.3. Research Methodology
- 1.4. Definitions and Assumptions
- 2. Executive Summary
- 2.1. Introduction
- 3. Market Dynamics
- 3.1. Introduction
- 3.2. Market Drivers
- 3.3. Market Restrains
- 3.4. Market Trends
- 4. Market Factor Analysis
- 4.1. Porters Five Forces
- 4.2. Supply/Value Chain
- 4.3. PESTEL analysis
- 4.4. Market Entropy
- 4.5. Patent/Trademark Analysis
- 5. Global Lighting Control Occupancy Sensors Analysis, Insights and Forecast, 2020-2032
- 5.1. Market Analysis, Insights and Forecast - by Application
- 5.1.1. Residential
- 5.1.2. Non-residential
- 5.2. Market Analysis, Insights and Forecast - by Types
- 5.2.1. PIR (Passive Infrared) Sensors
- 5.2.2. Ultrasonic Sensors
- 5.2.3. Dual-technology Occupancy Sensors
- 5.2.4. Others
- 5.3. Market Analysis, Insights and Forecast - by Region
- 5.3.1. North America
- 5.3.2. South America
- 5.3.3. Europe
- 5.3.4. Middle East & Africa
- 5.3.5. Asia Pacific
- 5.1. Market Analysis, Insights and Forecast - by Application
- 6. North America Lighting Control Occupancy Sensors Analysis, Insights and Forecast, 2020-2032
- 6.1. Market Analysis, Insights and Forecast - by Application
- 6.1.1. Residential
- 6.1.2. Non-residential
- 6.2. Market Analysis, Insights and Forecast - by Types
- 6.2.1. PIR (Passive Infrared) Sensors
- 6.2.2. Ultrasonic Sensors
- 6.2.3. Dual-technology Occupancy Sensors
- 6.2.4. Others
- 6.1. Market Analysis, Insights and Forecast - by Application
- 7. South America Lighting Control Occupancy Sensors Analysis, Insights and Forecast, 2020-2032
- 7.1. Market Analysis, Insights and Forecast - by Application
- 7.1.1. Residential
- 7.1.2. Non-residential
- 7.2. Market Analysis, Insights and Forecast - by Types
- 7.2.1. PIR (Passive Infrared) Sensors
- 7.2.2. Ultrasonic Sensors
- 7.2.3. Dual-technology Occupancy Sensors
- 7.2.4. Others
- 7.1. Market Analysis, Insights and Forecast - by Application
- 8. Europe Lighting Control Occupancy Sensors Analysis, Insights and Forecast, 2020-2032
- 8.1. Market Analysis, Insights and Forecast - by Application
- 8.1.1. Residential
- 8.1.2. Non-residential
- 8.2. Market Analysis, Insights and Forecast - by Types
- 8.2.1. PIR (Passive Infrared) Sensors
- 8.2.2. Ultrasonic Sensors
- 8.2.3. Dual-technology Occupancy Sensors
- 8.2.4. Others
- 8.1. Market Analysis, Insights and Forecast - by Application
- 9. Middle East & Africa Lighting Control Occupancy Sensors Analysis, Insights and Forecast, 2020-2032
- 9.1. Market Analysis, Insights and Forecast - by Application
- 9.1.1. Residential
- 9.1.2. Non-residential
- 9.2. Market Analysis, Insights and Forecast - by Types
- 9.2.1. PIR (Passive Infrared) Sensors
- 9.2.2. Ultrasonic Sensors
- 9.2.3. Dual-technology Occupancy Sensors
- 9.2.4. Others
- 9.1. Market Analysis, Insights and Forecast - by Application
- 10. Asia Pacific Lighting Control Occupancy Sensors Analysis, Insights and Forecast, 2020-2032
- 10.1. Market Analysis, Insights and Forecast - by Application
- 10.1.1. Residential
- 10.1.2. Non-residential
- 10.2. Market Analysis, Insights and Forecast - by Types
- 10.2.1. PIR (Passive Infrared) Sensors
- 10.2.2. Ultrasonic Sensors
- 10.2.3. Dual-technology Occupancy Sensors
- 10.2.4. Others
- 10.1. Market Analysis, Insights and Forecast - by Application
- 11. Competitive Analysis
- 11.1. Global Market Share Analysis 2025
- 11.2. Company Profiles
- 11.2.1 Signify
- 11.2.1.1. Overview
- 11.2.1.2. Products
- 11.2.1.3. SWOT Analysis
- 11.2.1.4. Recent Developments
- 11.2.1.5. Financials (Based on Availability)
- 11.2.2 Schneider Electric
- 11.2.2.1. Overview
- 11.2.2.2. Products
- 11.2.2.3. SWOT Analysis
- 11.2.2.4. Recent Developments
- 11.2.2.5. Financials (Based on Availability)
- 11.2.3 Honeywell
- 11.2.3.1. Overview
- 11.2.3.2. Products
- 11.2.3.3. SWOT Analysis
- 11.2.3.4. Recent Developments
- 11.2.3.5. Financials (Based on Availability)
- 11.2.4 GE Current
- 11.2.4.1. Overview
- 11.2.4.2. Products
- 11.2.4.3. SWOT Analysis
- 11.2.4.4. Recent Developments
- 11.2.4.5. Financials (Based on Availability)
- 11.2.5 Johnson Controls
- 11.2.5.1. Overview
- 11.2.5.2. Products
- 11.2.5.3. SWOT Analysis
- 11.2.5.4. Recent Developments
- 11.2.5.5. Financials (Based on Availability)
- 11.2.6 Legrand
- 11.2.6.1. Overview
- 11.2.6.2. Products
- 11.2.6.3. SWOT Analysis
- 11.2.6.4. Recent Developments
- 11.2.6.5. Financials (Based on Availability)
- 11.2.7 Crestron Electronics
- 11.2.7.1. Overview
- 11.2.7.2. Products
- 11.2.7.3. SWOT Analysis
- 11.2.7.4. Recent Developments
- 11.2.7.5. Financials (Based on Availability)
- 11.2.8 Lutron Electronics
- 11.2.8.1. Overview
- 11.2.8.2. Products
- 11.2.8.3. SWOT Analysis
- 11.2.8.4. Recent Developments
- 11.2.8.5. Financials (Based on Availability)
- 11.2.9 Acuity Brands
- 11.2.9.1. Overview
- 11.2.9.2. Products
- 11.2.9.3. SWOT Analysis
- 11.2.9.4. Recent Developments
- 11.2.9.5. Financials (Based on Availability)
- 11.2.10 OPTEX
- 11.2.10.1. Overview
- 11.2.10.2. Products
- 11.2.10.3. SWOT Analysis
- 11.2.10.4. Recent Developments
- 11.2.10.5. Financials (Based on Availability)
- 11.2.11 Leviton Manufacturing Co.
- 11.2.11.1. Overview
- 11.2.11.2. Products
- 11.2.11.3. SWOT Analysis
- 11.2.11.4. Recent Developments
- 11.2.11.5. Financials (Based on Availability)
- 11.2.12 Inc
- 11.2.12.1. Overview
- 11.2.12.2. Products
- 11.2.12.3. SWOT Analysis
- 11.2.12.4. Recent Developments
- 11.2.12.5. Financials (Based on Availability)
- 11.2.13 Enerlites
- 11.2.13.1. Overview
- 11.2.13.2. Products
- 11.2.13.3. SWOT Analysis
- 11.2.13.4. Recent Developments
- 11.2.13.5. Financials (Based on Availability)
- 11.2.14 Hubbell
- 11.2.14.1. Overview
- 11.2.14.2. Products
- 11.2.14.3. SWOT Analysis
- 11.2.14.4. Recent Developments
- 11.2.14.5. Financials (Based on Availability)
- 11.2.1 Signify
List of Figures
- Figure 1: Global Lighting Control Occupancy Sensors Revenue Breakdown (million, %) by Region 2025 & 2033
- Figure 2: North America Lighting Control Occupancy Sensors Revenue (million), by Application 2025 & 2033
- Figure 3: North America Lighting Control Occupancy Sensors Revenue Share (%), by Application 2025 & 2033
- Figure 4: North America Lighting Control Occupancy Sensors Revenue (million), by Types 2025 & 2033
- Figure 5: North America Lighting Control Occupancy Sensors Revenue Share (%), by Types 2025 & 2033
- Figure 6: North America Lighting Control Occupancy Sensors Revenue (million), by Country 2025 & 2033
- Figure 7: North America Lighting Control Occupancy Sensors Revenue Share (%), by Country 2025 & 2033
- Figure 8: South America Lighting Control Occupancy Sensors Revenue (million), by Application 2025 & 2033
- Figure 9: South America Lighting Control Occupancy Sensors Revenue Share (%), by Application 2025 & 2033
- Figure 10: South America Lighting Control Occupancy Sensors Revenue (million), by Types 2025 & 2033
- Figure 11: South America Lighting Control Occupancy Sensors Revenue Share (%), by Types 2025 & 2033
- Figure 12: South America Lighting Control Occupancy Sensors Revenue (million), by Country 2025 & 2033
- Figure 13: South America Lighting Control Occupancy Sensors Revenue Share (%), by Country 2025 & 2033
- Figure 14: Europe Lighting Control Occupancy Sensors Revenue (million), by Application 2025 & 2033
- Figure 15: Europe Lighting Control Occupancy Sensors Revenue Share (%), by Application 2025 & 2033
- Figure 16: Europe Lighting Control Occupancy Sensors Revenue (million), by Types 2025 & 2033
- Figure 17: Europe Lighting Control Occupancy Sensors Revenue Share (%), by Types 2025 & 2033
- Figure 18: Europe Lighting Control Occupancy Sensors Revenue (million), by Country 2025 & 2033
- Figure 19: Europe Lighting Control Occupancy Sensors Revenue Share (%), by Country 2025 & 2033
- Figure 20: Middle East & Africa Lighting Control Occupancy Sensors Revenue (million), by Application 2025 & 2033
- Figure 21: Middle East & Africa Lighting Control Occupancy Sensors Revenue Share (%), by Application 2025 & 2033
- Figure 22: Middle East & Africa Lighting Control Occupancy Sensors Revenue (million), by Types 2025 & 2033
- Figure 23: Middle East & Africa Lighting Control Occupancy Sensors Revenue Share (%), by Types 2025 & 2033
- Figure 24: Middle East & Africa Lighting Control Occupancy Sensors Revenue (million), by Country 2025 & 2033
- Figure 25: Middle East & Africa Lighting Control Occupancy Sensors Revenue Share (%), by Country 2025 & 2033
- Figure 26: Asia Pacific Lighting Control Occupancy Sensors Revenue (million), by Application 2025 & 2033
- Figure 27: Asia Pacific Lighting Control Occupancy Sensors Revenue Share (%), by Application 2025 & 2033
- Figure 28: Asia Pacific Lighting Control Occupancy Sensors Revenue (million), by Types 2025 & 2033
- Figure 29: Asia Pacific Lighting Control Occupancy Sensors Revenue Share (%), by Types 2025 & 2033
- Figure 30: Asia Pacific Lighting Control Occupancy Sensors Revenue (million), by Country 2025 & 2033
- Figure 31: Asia Pacific Lighting Control Occupancy Sensors Revenue Share (%), by Country 2025 & 2033
List of Tables
- Table 1: Global Lighting Control Occupancy Sensors Revenue million Forecast, by Application 2020 & 2033
- Table 2: Global Lighting Control Occupancy Sensors Revenue million Forecast, by Types 2020 & 2033
- Table 3: Global Lighting Control Occupancy Sensors Revenue million Forecast, by Region 2020 & 2033
- Table 4: Global Lighting Control Occupancy Sensors Revenue million Forecast, by Application 2020 & 2033
- Table 5: Global Lighting Control Occupancy Sensors Revenue million Forecast, by Types 2020 & 2033
- Table 6: Global Lighting Control Occupancy Sensors Revenue million Forecast, by Country 2020 & 2033
- Table 7: United States Lighting Control Occupancy Sensors Revenue (million) Forecast, by Application 2020 & 2033
- Table 8: Canada Lighting Control Occupancy Sensors Revenue (million) Forecast, by Application 2020 & 2033
- Table 9: Mexico Lighting Control Occupancy Sensors Revenue (million) Forecast, by Application 2020 & 2033
- Table 10: Global Lighting Control Occupancy Sensors Revenue million Forecast, by Application 2020 & 2033
- Table 11: Global Lighting Control Occupancy Sensors Revenue million Forecast, by Types 2020 & 2033
- Table 12: Global Lighting Control Occupancy Sensors Revenue million Forecast, by Country 2020 & 2033
- Table 13: Brazil Lighting Control Occupancy Sensors Revenue (million) Forecast, by Application 2020 & 2033
- Table 14: Argentina Lighting Control Occupancy Sensors Revenue (million) Forecast, by Application 2020 & 2033
- Table 15: Rest of South America Lighting Control Occupancy Sensors Revenue (million) Forecast, by Application 2020 & 2033
- Table 16: Global Lighting Control Occupancy Sensors Revenue million Forecast, by Application 2020 & 2033
- Table 17: Global Lighting Control Occupancy Sensors Revenue million Forecast, by Types 2020 & 2033
- Table 18: Global Lighting Control Occupancy Sensors Revenue million Forecast, by Country 2020 & 2033
- Table 19: United Kingdom Lighting Control Occupancy Sensors Revenue (million) Forecast, by Application 2020 & 2033
- Table 20: Germany Lighting Control Occupancy Sensors Revenue (million) Forecast, by Application 2020 & 2033
- Table 21: France Lighting Control Occupancy Sensors Revenue (million) Forecast, by Application 2020 & 2033
- Table 22: Italy Lighting Control Occupancy Sensors Revenue (million) Forecast, by Application 2020 & 2033
- Table 23: Spain Lighting Control Occupancy Sensors Revenue (million) Forecast, by Application 2020 & 2033
- Table 24: Russia Lighting Control Occupancy Sensors Revenue (million) Forecast, by Application 2020 & 2033
- Table 25: Benelux Lighting Control Occupancy Sensors Revenue (million) Forecast, by Application 2020 & 2033
- Table 26: Nordics Lighting Control Occupancy Sensors Revenue (million) Forecast, by Application 2020 & 2033
- Table 27: Rest of Europe Lighting Control Occupancy Sensors Revenue (million) Forecast, by Application 2020 & 2033
- Table 28: Global Lighting Control Occupancy Sensors Revenue million Forecast, by Application 2020 & 2033
- Table 29: Global Lighting Control Occupancy Sensors Revenue million Forecast, by Types 2020 & 2033
- Table 30: Global Lighting Control Occupancy Sensors Revenue million Forecast, by Country 2020 & 2033
- Table 31: Turkey Lighting Control Occupancy Sensors Revenue (million) Forecast, by Application 2020 & 2033
- Table 32: Israel Lighting Control Occupancy Sensors Revenue (million) Forecast, by Application 2020 & 2033
- Table 33: GCC Lighting Control Occupancy Sensors Revenue (million) Forecast, by Application 2020 & 2033
- Table 34: North Africa Lighting Control Occupancy Sensors Revenue (million) Forecast, by Application 2020 & 2033
- Table 35: South Africa Lighting Control Occupancy Sensors Revenue (million) Forecast, by Application 2020 & 2033
- Table 36: Rest of Middle East & Africa Lighting Control Occupancy Sensors Revenue (million) Forecast, by Application 2020 & 2033
- Table 37: Global Lighting Control Occupancy Sensors Revenue million Forecast, by Application 2020 & 2033
- Table 38: Global Lighting Control Occupancy Sensors Revenue million Forecast, by Types 2020 & 2033
- Table 39: Global Lighting Control Occupancy Sensors Revenue million Forecast, by Country 2020 & 2033
- Table 40: China Lighting Control Occupancy Sensors Revenue (million) Forecast, by Application 2020 & 2033
- Table 41: India Lighting Control Occupancy Sensors Revenue (million) Forecast, by Application 2020 & 2033
- Table 42: Japan Lighting Control Occupancy Sensors Revenue (million) Forecast, by Application 2020 & 2033
- Table 43: South Korea Lighting Control Occupancy Sensors Revenue (million) Forecast, by Application 2020 & 2033
- Table 44: ASEAN Lighting Control Occupancy Sensors Revenue (million) Forecast, by Application 2020 & 2033
- Table 45: Oceania Lighting Control Occupancy Sensors Revenue (million) Forecast, by Application 2020 & 2033
- Table 46: Rest of Asia Pacific Lighting Control Occupancy Sensors Revenue (million) Forecast, by Application 2020 & 2033
Frequently Asked Questions
1. What is the projected Compound Annual Growth Rate (CAGR) of the Lighting Control Occupancy Sensors?
The projected CAGR is approximately 15.9%.
2. Which companies are prominent players in the Lighting Control Occupancy Sensors?
Key companies in the market include Signify, Schneider Electric, Honeywell, GE Current, Johnson Controls, Legrand, Crestron Electronics, Lutron Electronics, Acuity Brands, OPTEX, Leviton Manufacturing Co., Inc, Enerlites, Hubbell.
3. What are the main segments of the Lighting Control Occupancy Sensors?
The market segments include Application, Types.
4. Can you provide details about the market size?
The market size is estimated to be USD 34393.9 million as of 2022.
5. What are some drivers contributing to market growth?
N/A
6. What are the notable trends driving market growth?
N/A
7. Are there any restraints impacting market growth?
N/A
8. Can you provide examples of recent developments in the market?
N/A
9. What pricing options are available for accessing the report?
Pricing options include single-user, multi-user, and enterprise licenses priced at USD 2900.00, USD 4350.00, and USD 5800.00 respectively.
10. Is the market size provided in terms of value or volume?
The market size is provided in terms of value, measured in million.
11. Are there any specific market keywords associated with the report?
Yes, the market keyword associated with the report is "Lighting Control Occupancy Sensors," which aids in identifying and referencing the specific market segment covered.
12. How do I determine which pricing option suits my needs best?
The pricing options vary based on user requirements and access needs. Individual users may opt for single-user licenses, while businesses requiring broader access may choose multi-user or enterprise licenses for cost-effective access to the report.
13. Are there any additional resources or data provided in the Lighting Control Occupancy Sensors report?
While the report offers comprehensive insights, it's advisable to review the specific contents or supplementary materials provided to ascertain if additional resources or data are available.
14. How can I stay updated on further developments or reports in the Lighting Control Occupancy Sensors?
To stay informed about further developments, trends, and reports in the Lighting Control Occupancy Sensors, consider subscribing to industry newsletters, following relevant companies and organizations, or regularly checking reputable industry news sources and publications.
Methodology
Step 1 - Identification of Relevant Samples Size from Population Database


Step 2 - Approaches for Defining Global Market Size (Value, Volume* & Price*)

Note*: In applicable scenarios
Step 3 - Data Sources
Primary Research
- Web Analytics
- Survey Reports
- Research Institute
- Latest Research Reports
- Opinion Leaders
Secondary Research
- Annual Reports
- White Paper
- Latest Press Release
- Industry Association
- Paid Database
- Investor Presentations

Step 4 - Data Triangulation
Involves using different sources of information in order to increase the validity of a study
These sources are likely to be stakeholders in a program - participants, other researchers, program staff, other community members, and so on.
Then we put all data in single framework & apply various statistical tools to find out the dynamic on the market.
During the analysis stage, feedback from the stakeholder groups would be compared to determine areas of agreement as well as areas of divergence