

Key Insights
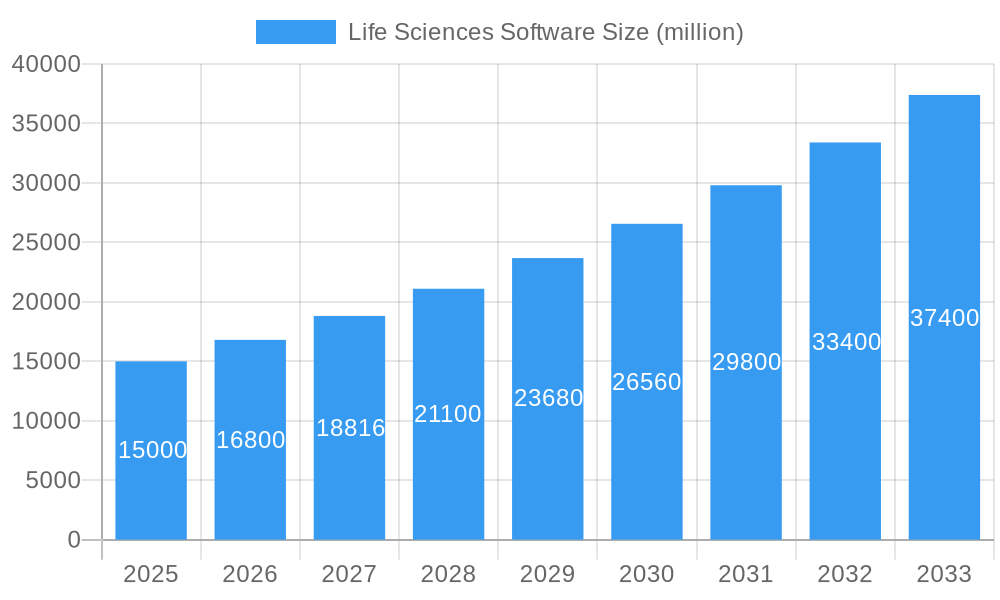
The Life Sciences Software market is experiencing significant expansion, driven by the imperative for enhanced data management, stringent regulatory adherence, and accelerated drug development lifecycles. The market, valued at 17.69 billion in the base year of 2025, is projected to achieve a Compound Annual Growth Rate (CAGR) of 10.8% from 2025 to 2033. This growth trajectory is underpinned by several critical factors. The increasing adoption of cloud-based solutions is enhancing accessibility, scalability, and collaborative capabilities across pharmaceutical and biotechnology enterprises. Concurrently, the escalating complexity of clinical trials and evolving regulatory landscapes mandate sophisticated software to optimize processes and safeguard data integrity. Furthermore, the burgeoning integration of data analytics and Artificial Intelligence (AI) within life sciences is spurring demand for advanced software solutions capable of processing extensive datasets and delivering actionable intelligence for expedited drug discovery and development. Leading industry participants, including Veeva Systems, Medidata Solutions, and Dassault Systèmes, are pivotal in driving innovation through continuous product enhancement.
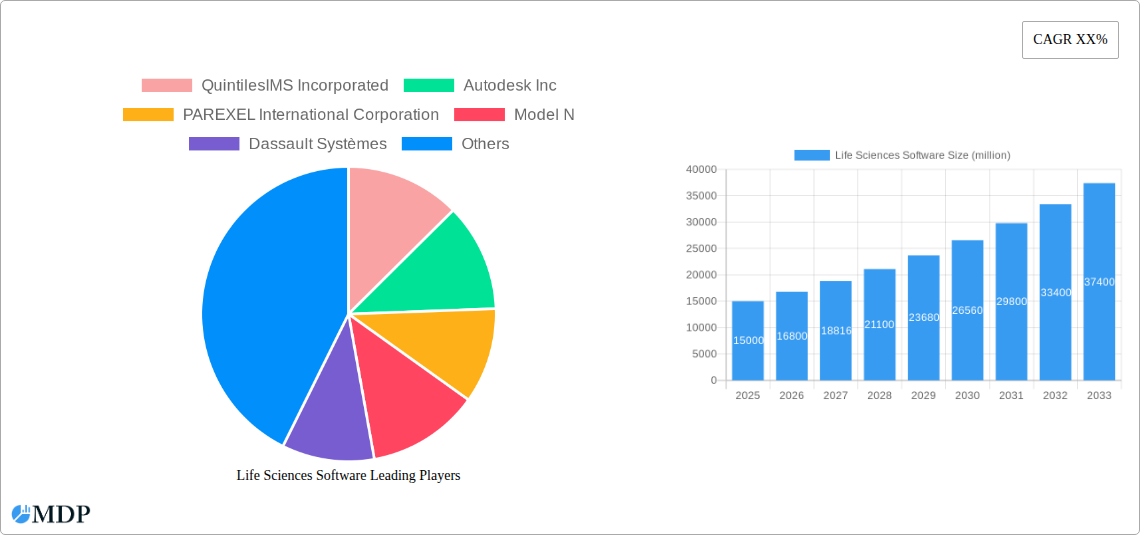
Life Sciences Software Market Size (In Billion)
Notwithstanding this positive market outlook, certain challenges persist. Substantial implementation expenditures and the requirement for specialized IT infrastructure can impede adoption, particularly for smaller organizations. Moreover, ensuring robust data security and compliance with rigorous regulatory frameworks such as GDPR and HIPAA remains a paramount concern for all stakeholders. To address these obstacles, market players are prioritizing user-friendly interfaces, integrated solutions, and fortified security protocols. Market segmentation highlights a strong emphasis on Clinical Trial Management Systems (CTMS), Regulatory Information Management (RIM), and Laboratory Information Management Systems (LIMS). Future market expansion will be significantly influenced by advancements in AI and machine learning, fostering predictive analytics and personalized medicine initiatives within the life sciences sector. Geographically, while North America and Europe exhibit strong market concentration, emerging economies in the Asia-Pacific and Latin America regions represent substantial untapped opportunities.
Life Sciences Software Company Market Share
Life Sciences Software Market Report: 2019-2033 - A Comprehensive Analysis
This comprehensive report provides an in-depth analysis of the Life Sciences Software market, projecting a market value exceeding $XX million by 2033. The study covers the period from 2019 to 2033, with a focus on the forecast period of 2025-2033 and a base year of 2025. This report is essential for industry stakeholders, investors, and businesses seeking to understand the market dynamics, key players, and future growth opportunities in this rapidly evolving sector.
Life Sciences Software Market Dynamics & Concentration
The Life Sciences Software market exhibits a moderately consolidated structure, with several major players controlling significant market share. In 2024, the top five companies held an estimated xx% of the market share. This concentration is influenced by factors such as high barriers to entry (significant R&D investment, regulatory approvals), the need for specialized expertise, and the prevalence of mergers and acquisitions (M&A). Innovation is a key driver, with companies continuously developing advanced analytics, AI-powered solutions, and cloud-based platforms. Regulatory frameworks, particularly concerning data privacy and security (e.g., GDPR, HIPAA), significantly impact market dynamics. Product substitutes, while limited, include in-house developed systems, though these often lack the scalability and advanced features of commercial software. End-user trends show a growing preference for cloud-based solutions and integrated platforms, facilitating streamlined workflows and data management. M&A activity has been robust in recent years, with an estimated xx M&A deals between 2019 and 2024, aiming to expand market reach and product portfolios.
- Market Share Concentration (2024): Top 5 companies – xx%
- M&A Deals (2019-2024): Estimated xx deals
- Key Innovation Drivers: AI, Cloud Computing, Advanced Analytics
- Regulatory Impacts: GDPR, HIPAA
Life Sciences Software Industry Trends & Analysis
The Life Sciences Software market is experiencing significant growth, driven by several factors. The compound annual growth rate (CAGR) is projected to be xx% during the forecast period (2025-2033). Increased adoption of cloud-based solutions, driven by cost-effectiveness and scalability, is a major trend. The rising demand for data-driven insights and advanced analytics is another key driver, enabling personalized medicine and improved R&D efficiency. Technological disruptions, particularly in areas such as AI and machine learning, are revolutionizing drug discovery, clinical trials, and regulatory compliance. Consumer preferences are shifting towards user-friendly, integrated platforms offering enhanced data visualization and collaboration tools. Competitive dynamics are intense, with companies focusing on innovation, strategic partnerships, and M&A to gain a competitive edge. Market penetration is gradually increasing across various segments, particularly in regions with robust healthcare infrastructure and high R&D spending.
Leading Markets & Segments in Life Sciences Software
North America currently dominates the Life Sciences Software market, driven by high healthcare expenditure, advanced technological infrastructure, and a large number of pharmaceutical and biotech companies.
- Key Drivers in North America:
- High R&D Spending
- Advanced Healthcare Infrastructure
- Stringent Regulatory Framework (driving software adoption for compliance)
- Presence of Major Pharmaceutical & Biotech Companies
This dominance is expected to continue throughout the forecast period. However, growth in other regions, particularly Asia-Pacific, fueled by increasing healthcare investments and rising adoption of advanced technologies, will challenge North America's leading position. The clinical trial management segment exhibits strong growth, fueled by the increasing complexity and scale of clinical trials, demanding efficient management and data analysis tools.
Life Sciences Software Product Developments
Recent product innovations include AI-powered drug discovery platforms, advanced clinical trial management systems with integrated data analytics, and cloud-based solutions for regulatory compliance. These innovations offer significant competitive advantages by improving efficiency, accelerating development timelines, and enhancing data security. The market trend favors integrated platforms that seamlessly connect different stages of the drug development and commercialization lifecycle. This trend improves data flow and reduces redundancy.
Key Drivers of Life Sciences Software Growth
The Life Sciences Software market is propelled by several factors. Technological advancements, such as AI and machine learning, are revolutionizing drug discovery and clinical trials. Increasing healthcare spending globally is driving the demand for efficient software solutions. Stringent regulatory requirements necessitate the use of compliant software for data management and reporting. The growing need for personalized medicine is further fueling market expansion.
Challenges in the Life Sciences Software Market
The market faces challenges, including the high cost of implementation and maintenance of advanced software solutions. Integration with legacy systems can pose difficulties. The complexity of regulatory compliance and data security requirements creates barriers to entry. Intense competition among established players and new entrants is a significant factor. Supply chain disruptions, particularly related to hardware and specialized talent, can impact market growth.
Emerging Opportunities in Life Sciences Software
Emerging opportunities arise from advancements in AI and machine learning which promise further automation in drug discovery and clinical trials. Strategic partnerships between software companies and pharmaceutical giants will lead to innovative solutions. Market expansion into emerging economies with growing healthcare sectors presents substantial opportunities for growth. The increasing focus on real-world evidence (RWE) and its integration into clinical research is creating new demand for software solutions.
Leading Players in the Life Sciences Software Sector
Key Milestones in Life Sciences Software Industry
- 2020: Launch of several cloud-based clinical trial management platforms.
- 2021: Increased adoption of AI in drug discovery initiatives by major pharmaceutical companies.
- 2022: Several significant mergers and acquisitions consolidating market share.
- 2023: Introduction of advanced data analytics solutions for real-world evidence generation.
- 2024: Emphasis on regulatory compliance leading to increased software adoption in pharmaceutical companies.
Strategic Outlook for Life Sciences Software Market
The Life Sciences Software market is poised for substantial growth, driven by technological innovations and evolving healthcare needs. Strategic opportunities lie in developing AI-powered solutions, enhancing data security and compliance features, and expanding into emerging markets. Partnerships and collaborations will be crucial for success in this competitive landscape. Companies focusing on integrated platforms and user-friendly interfaces will gain a significant advantage. The future of the market will be defined by the ability to harness data, streamline processes, and accelerate innovation within the life sciences industry.
Life Sciences Software Segmentation
-
1. Application
- 1.1. Pharmaceuticals
- 1.2. Biotechnology
- 1.3. Others
-
2. Types
- 2.1. Cloud-based
- 2.2. On-premises
Life Sciences Software Segmentation By Geography
-
1. North America
- 1.1. United States
- 1.2. Canada
- 1.3. Mexico
-
2. South America
- 2.1. Brazil
- 2.2. Argentina
- 2.3. Rest of South America
-
3. Europe
- 3.1. United Kingdom
- 3.2. Germany
- 3.3. France
- 3.4. Italy
- 3.5. Spain
- 3.6. Russia
- 3.7. Benelux
- 3.8. Nordics
- 3.9. Rest of Europe
-
4. Middle East & Africa
- 4.1. Turkey
- 4.2. Israel
- 4.3. GCC
- 4.4. North Africa
- 4.5. South Africa
- 4.6. Rest of Middle East & Africa
-
5. Asia Pacific
- 5.1. China
- 5.2. India
- 5.3. Japan
- 5.4. South Korea
- 5.5. ASEAN
- 5.6. Oceania
- 5.7. Rest of Asia Pacific
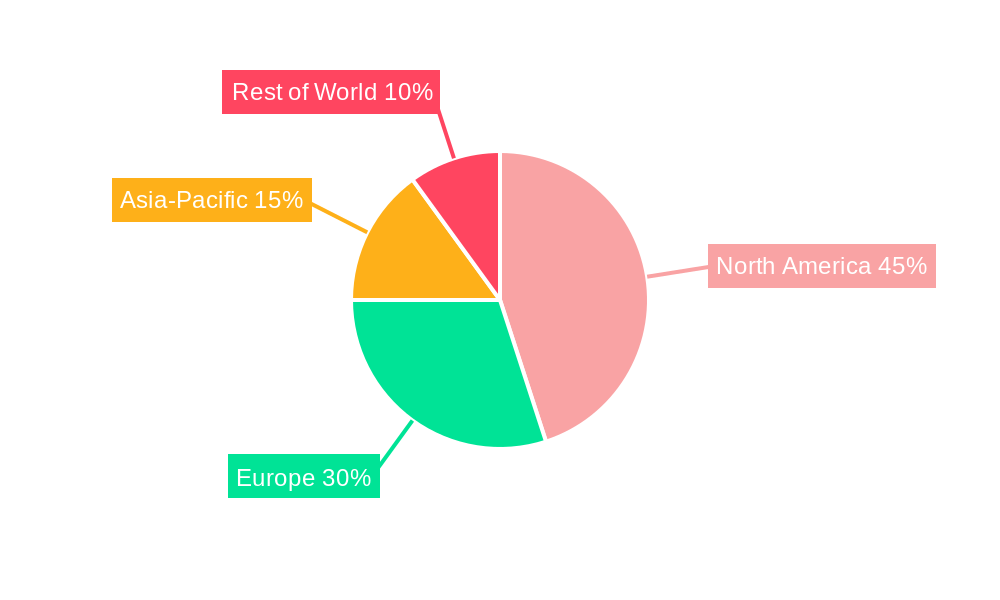
Life Sciences Software Regional Market Share
Geographic Coverage of Life Sciences Software
Life Sciences Software REPORT HIGHLIGHTS
| Aspects | Details |
|---|---|
| Study Period | 2020-2034 |
| Base Year | 2025 |
| Estimated Year | 2026 |
| Forecast Period | 2026-2034 |
| Historical Period | 2020-2025 |
| Growth Rate | CAGR of 10.8% from 2020-2034 |
| Segmentation |
|
Table of Contents
- 1. Introduction
- 1.1. Research Scope
- 1.2. Market Segmentation
- 1.3. Research Methodology
- 1.4. Definitions and Assumptions
- 2. Executive Summary
- 2.1. Introduction
- 3. Market Dynamics
- 3.1. Introduction
- 3.2. Market Drivers
- 3.3. Market Restrains
- 3.4. Market Trends
- 4. Market Factor Analysis
- 4.1. Porters Five Forces
- 4.2. Supply/Value Chain
- 4.3. PESTEL analysis
- 4.4. Market Entropy
- 4.5. Patent/Trademark Analysis
- 5. Global Life Sciences Software Analysis, Insights and Forecast, 2020-2032
- 5.1. Market Analysis, Insights and Forecast - by Application
- 5.1.1. Pharmaceuticals
- 5.1.2. Biotechnology
- 5.1.3. Others
- 5.2. Market Analysis, Insights and Forecast - by Types
- 5.2.1. Cloud-based
- 5.2.2. On-premises
- 5.3. Market Analysis, Insights and Forecast - by Region
- 5.3.1. North America
- 5.3.2. South America
- 5.3.3. Europe
- 5.3.4. Middle East & Africa
- 5.3.5. Asia Pacific
- 5.1. Market Analysis, Insights and Forecast - by Application
- 6. North America Life Sciences Software Analysis, Insights and Forecast, 2020-2032
- 6.1. Market Analysis, Insights and Forecast - by Application
- 6.1.1. Pharmaceuticals
- 6.1.2. Biotechnology
- 6.1.3. Others
- 6.2. Market Analysis, Insights and Forecast - by Types
- 6.2.1. Cloud-based
- 6.2.2. On-premises
- 6.1. Market Analysis, Insights and Forecast - by Application
- 7. South America Life Sciences Software Analysis, Insights and Forecast, 2020-2032
- 7.1. Market Analysis, Insights and Forecast - by Application
- 7.1.1. Pharmaceuticals
- 7.1.2. Biotechnology
- 7.1.3. Others
- 7.2. Market Analysis, Insights and Forecast - by Types
- 7.2.1. Cloud-based
- 7.2.2. On-premises
- 7.1. Market Analysis, Insights and Forecast - by Application
- 8. Europe Life Sciences Software Analysis, Insights and Forecast, 2020-2032
- 8.1. Market Analysis, Insights and Forecast - by Application
- 8.1.1. Pharmaceuticals
- 8.1.2. Biotechnology
- 8.1.3. Others
- 8.2. Market Analysis, Insights and Forecast - by Types
- 8.2.1. Cloud-based
- 8.2.2. On-premises
- 8.1. Market Analysis, Insights and Forecast - by Application
- 9. Middle East & Africa Life Sciences Software Analysis, Insights and Forecast, 2020-2032
- 9.1. Market Analysis, Insights and Forecast - by Application
- 9.1.1. Pharmaceuticals
- 9.1.2. Biotechnology
- 9.1.3. Others
- 9.2. Market Analysis, Insights and Forecast - by Types
- 9.2.1. Cloud-based
- 9.2.2. On-premises
- 9.1. Market Analysis, Insights and Forecast - by Application
- 10. Asia Pacific Life Sciences Software Analysis, Insights and Forecast, 2020-2032
- 10.1. Market Analysis, Insights and Forecast - by Application
- 10.1.1. Pharmaceuticals
- 10.1.2. Biotechnology
- 10.1.3. Others
- 10.2. Market Analysis, Insights and Forecast - by Types
- 10.2.1. Cloud-based
- 10.2.2. On-premises
- 10.1. Market Analysis, Insights and Forecast - by Application
- 11. Competitive Analysis
- 11.1. Global Market Share Analysis 2025
- 11.2. Company Profiles
- 11.2.1 QuintilesIMS Incorporated
- 11.2.1.1. Overview
- 11.2.1.2. Products
- 11.2.1.3. SWOT Analysis
- 11.2.1.4. Recent Developments
- 11.2.1.5. Financials (Based on Availability)
- 11.2.2 Autodesk Inc
- 11.2.2.1. Overview
- 11.2.2.2. Products
- 11.2.2.3. SWOT Analysis
- 11.2.2.4. Recent Developments
- 11.2.2.5. Financials (Based on Availability)
- 11.2.3 PAREXEL International Corporation
- 11.2.3.1. Overview
- 11.2.3.2. Products
- 11.2.3.3. SWOT Analysis
- 11.2.3.4. Recent Developments
- 11.2.3.5. Financials (Based on Availability)
- 11.2.4 Model N
- 11.2.4.1. Overview
- 11.2.4.2. Products
- 11.2.4.3. SWOT Analysis
- 11.2.4.4. Recent Developments
- 11.2.4.5. Financials (Based on Availability)
- 11.2.5 Dassault Systèmes
- 11.2.5.1. Overview
- 11.2.5.2. Products
- 11.2.5.3. SWOT Analysis
- 11.2.5.4. Recent Developments
- 11.2.5.5. Financials (Based on Availability)
- 11.2.6 CSC
- 11.2.6.1. Overview
- 11.2.6.2. Products
- 11.2.6.3. SWOT Analysis
- 11.2.6.4. Recent Developments
- 11.2.6.5. Financials (Based on Availability)
- 11.2.7 International Business Machines Corp
- 11.2.7.1. Overview
- 11.2.7.2. Products
- 11.2.7.3. SWOT Analysis
- 11.2.7.4. Recent Developments
- 11.2.7.5. Financials (Based on Availability)
- 11.2.8 SAP SE
- 11.2.8.1. Overview
- 11.2.8.2. Products
- 11.2.8.3. SWOT Analysis
- 11.2.8.4. Recent Developments
- 11.2.8.5. Financials (Based on Availability)
- 11.2.9 Veeva Systems
- 11.2.9.1. Overview
- 11.2.9.2. Products
- 11.2.9.3. SWOT Analysis
- 11.2.9.4. Recent Developments
- 11.2.9.5. Financials (Based on Availability)
- 11.2.10 Medidata Solutions
- 11.2.10.1. Overview
- 11.2.10.2. Products
- 11.2.10.3. SWOT Analysis
- 11.2.10.4. Recent Developments
- 11.2.10.5. Financials (Based on Availability)
- 11.2.11 Inc
- 11.2.11.1. Overview
- 11.2.11.2. Products
- 11.2.11.3. SWOT Analysis
- 11.2.11.4. Recent Developments
- 11.2.11.5. Financials (Based on Availability)
- 11.2.1 QuintilesIMS Incorporated
List of Figures
- Figure 1: Global Life Sciences Software Revenue Breakdown (billion, %) by Region 2025 & 2033
- Figure 2: North America Life Sciences Software Revenue (billion), by Application 2025 & 2033
- Figure 3: North America Life Sciences Software Revenue Share (%), by Application 2025 & 2033
- Figure 4: North America Life Sciences Software Revenue (billion), by Types 2025 & 2033
- Figure 5: North America Life Sciences Software Revenue Share (%), by Types 2025 & 2033
- Figure 6: North America Life Sciences Software Revenue (billion), by Country 2025 & 2033
- Figure 7: North America Life Sciences Software Revenue Share (%), by Country 2025 & 2033
- Figure 8: South America Life Sciences Software Revenue (billion), by Application 2025 & 2033
- Figure 9: South America Life Sciences Software Revenue Share (%), by Application 2025 & 2033
- Figure 10: South America Life Sciences Software Revenue (billion), by Types 2025 & 2033
- Figure 11: South America Life Sciences Software Revenue Share (%), by Types 2025 & 2033
- Figure 12: South America Life Sciences Software Revenue (billion), by Country 2025 & 2033
- Figure 13: South America Life Sciences Software Revenue Share (%), by Country 2025 & 2033
- Figure 14: Europe Life Sciences Software Revenue (billion), by Application 2025 & 2033
- Figure 15: Europe Life Sciences Software Revenue Share (%), by Application 2025 & 2033
- Figure 16: Europe Life Sciences Software Revenue (billion), by Types 2025 & 2033
- Figure 17: Europe Life Sciences Software Revenue Share (%), by Types 2025 & 2033
- Figure 18: Europe Life Sciences Software Revenue (billion), by Country 2025 & 2033
- Figure 19: Europe Life Sciences Software Revenue Share (%), by Country 2025 & 2033
- Figure 20: Middle East & Africa Life Sciences Software Revenue (billion), by Application 2025 & 2033
- Figure 21: Middle East & Africa Life Sciences Software Revenue Share (%), by Application 2025 & 2033
- Figure 22: Middle East & Africa Life Sciences Software Revenue (billion), by Types 2025 & 2033
- Figure 23: Middle East & Africa Life Sciences Software Revenue Share (%), by Types 2025 & 2033
- Figure 24: Middle East & Africa Life Sciences Software Revenue (billion), by Country 2025 & 2033
- Figure 25: Middle East & Africa Life Sciences Software Revenue Share (%), by Country 2025 & 2033
- Figure 26: Asia Pacific Life Sciences Software Revenue (billion), by Application 2025 & 2033
- Figure 27: Asia Pacific Life Sciences Software Revenue Share (%), by Application 2025 & 2033
- Figure 28: Asia Pacific Life Sciences Software Revenue (billion), by Types 2025 & 2033
- Figure 29: Asia Pacific Life Sciences Software Revenue Share (%), by Types 2025 & 2033
- Figure 30: Asia Pacific Life Sciences Software Revenue (billion), by Country 2025 & 2033
- Figure 31: Asia Pacific Life Sciences Software Revenue Share (%), by Country 2025 & 2033
List of Tables
- Table 1: Global Life Sciences Software Revenue billion Forecast, by Application 2020 & 2033
- Table 2: Global Life Sciences Software Revenue billion Forecast, by Types 2020 & 2033
- Table 3: Global Life Sciences Software Revenue billion Forecast, by Region 2020 & 2033
- Table 4: Global Life Sciences Software Revenue billion Forecast, by Application 2020 & 2033
- Table 5: Global Life Sciences Software Revenue billion Forecast, by Types 2020 & 2033
- Table 6: Global Life Sciences Software Revenue billion Forecast, by Country 2020 & 2033
- Table 7: United States Life Sciences Software Revenue (billion) Forecast, by Application 2020 & 2033
- Table 8: Canada Life Sciences Software Revenue (billion) Forecast, by Application 2020 & 2033
- Table 9: Mexico Life Sciences Software Revenue (billion) Forecast, by Application 2020 & 2033
- Table 10: Global Life Sciences Software Revenue billion Forecast, by Application 2020 & 2033
- Table 11: Global Life Sciences Software Revenue billion Forecast, by Types 2020 & 2033
- Table 12: Global Life Sciences Software Revenue billion Forecast, by Country 2020 & 2033
- Table 13: Brazil Life Sciences Software Revenue (billion) Forecast, by Application 2020 & 2033
- Table 14: Argentina Life Sciences Software Revenue (billion) Forecast, by Application 2020 & 2033
- Table 15: Rest of South America Life Sciences Software Revenue (billion) Forecast, by Application 2020 & 2033
- Table 16: Global Life Sciences Software Revenue billion Forecast, by Application 2020 & 2033
- Table 17: Global Life Sciences Software Revenue billion Forecast, by Types 2020 & 2033
- Table 18: Global Life Sciences Software Revenue billion Forecast, by Country 2020 & 2033
- Table 19: United Kingdom Life Sciences Software Revenue (billion) Forecast, by Application 2020 & 2033
- Table 20: Germany Life Sciences Software Revenue (billion) Forecast, by Application 2020 & 2033
- Table 21: France Life Sciences Software Revenue (billion) Forecast, by Application 2020 & 2033
- Table 22: Italy Life Sciences Software Revenue (billion) Forecast, by Application 2020 & 2033
- Table 23: Spain Life Sciences Software Revenue (billion) Forecast, by Application 2020 & 2033
- Table 24: Russia Life Sciences Software Revenue (billion) Forecast, by Application 2020 & 2033
- Table 25: Benelux Life Sciences Software Revenue (billion) Forecast, by Application 2020 & 2033
- Table 26: Nordics Life Sciences Software Revenue (billion) Forecast, by Application 2020 & 2033
- Table 27: Rest of Europe Life Sciences Software Revenue (billion) Forecast, by Application 2020 & 2033
- Table 28: Global Life Sciences Software Revenue billion Forecast, by Application 2020 & 2033
- Table 29: Global Life Sciences Software Revenue billion Forecast, by Types 2020 & 2033
- Table 30: Global Life Sciences Software Revenue billion Forecast, by Country 2020 & 2033
- Table 31: Turkey Life Sciences Software Revenue (billion) Forecast, by Application 2020 & 2033
- Table 32: Israel Life Sciences Software Revenue (billion) Forecast, by Application 2020 & 2033
- Table 33: GCC Life Sciences Software Revenue (billion) Forecast, by Application 2020 & 2033
- Table 34: North Africa Life Sciences Software Revenue (billion) Forecast, by Application 2020 & 2033
- Table 35: South Africa Life Sciences Software Revenue (billion) Forecast, by Application 2020 & 2033
- Table 36: Rest of Middle East & Africa Life Sciences Software Revenue (billion) Forecast, by Application 2020 & 2033
- Table 37: Global Life Sciences Software Revenue billion Forecast, by Application 2020 & 2033
- Table 38: Global Life Sciences Software Revenue billion Forecast, by Types 2020 & 2033
- Table 39: Global Life Sciences Software Revenue billion Forecast, by Country 2020 & 2033
- Table 40: China Life Sciences Software Revenue (billion) Forecast, by Application 2020 & 2033
- Table 41: India Life Sciences Software Revenue (billion) Forecast, by Application 2020 & 2033
- Table 42: Japan Life Sciences Software Revenue (billion) Forecast, by Application 2020 & 2033
- Table 43: South Korea Life Sciences Software Revenue (billion) Forecast, by Application 2020 & 2033
- Table 44: ASEAN Life Sciences Software Revenue (billion) Forecast, by Application 2020 & 2033
- Table 45: Oceania Life Sciences Software Revenue (billion) Forecast, by Application 2020 & 2033
- Table 46: Rest of Asia Pacific Life Sciences Software Revenue (billion) Forecast, by Application 2020 & 2033
Frequently Asked Questions
1. What is the projected Compound Annual Growth Rate (CAGR) of the Life Sciences Software?
The projected CAGR is approximately 10.8%.
2. Which companies are prominent players in the Life Sciences Software?
Key companies in the market include QuintilesIMS Incorporated, Autodesk Inc, PAREXEL International Corporation, Model N, Dassault Systèmes, CSC, International Business Machines Corp, SAP SE, Veeva Systems, Medidata Solutions, Inc.
3. What are the main segments of the Life Sciences Software?
The market segments include Application, Types.
4. Can you provide details about the market size?
The market size is estimated to be USD 17.69 billion as of 2022.
5. What are some drivers contributing to market growth?
N/A
6. What are the notable trends driving market growth?
N/A
7. Are there any restraints impacting market growth?
N/A
8. Can you provide examples of recent developments in the market?
N/A
9. What pricing options are available for accessing the report?
Pricing options include single-user, multi-user, and enterprise licenses priced at USD 3950.00, USD 5925.00, and USD 7900.00 respectively.
10. Is the market size provided in terms of value or volume?
The market size is provided in terms of value, measured in billion.
11. Are there any specific market keywords associated with the report?
Yes, the market keyword associated with the report is "Life Sciences Software," which aids in identifying and referencing the specific market segment covered.
12. How do I determine which pricing option suits my needs best?
The pricing options vary based on user requirements and access needs. Individual users may opt for single-user licenses, while businesses requiring broader access may choose multi-user or enterprise licenses for cost-effective access to the report.
13. Are there any additional resources or data provided in the Life Sciences Software report?
While the report offers comprehensive insights, it's advisable to review the specific contents or supplementary materials provided to ascertain if additional resources or data are available.
14. How can I stay updated on further developments or reports in the Life Sciences Software?
To stay informed about further developments, trends, and reports in the Life Sciences Software, consider subscribing to industry newsletters, following relevant companies and organizations, or regularly checking reputable industry news sources and publications.
Methodology
Step 1 - Identification of Relevant Samples Size from Population Database


Step 2 - Approaches for Defining Global Market Size (Value, Volume* & Price*)

Note*: In applicable scenarios
Step 3 - Data Sources
Primary Research
- Web Analytics
- Survey Reports
- Research Institute
- Latest Research Reports
- Opinion Leaders
Secondary Research
- Annual Reports
- White Paper
- Latest Press Release
- Industry Association
- Paid Database
- Investor Presentations

Step 4 - Data Triangulation
Involves using different sources of information in order to increase the validity of a study
These sources are likely to be stakeholders in a program - participants, other researchers, program staff, other community members, and so on.
Then we put all data in single framework & apply various statistical tools to find out the dynamic on the market.
During the analysis stage, feedback from the stakeholder groups would be compared to determine areas of agreement as well as areas of divergence