

Key Insights
The global LED Interactive Touch Screen market is poised for robust expansion, projected to reach USD 48.29 billion in 2025, driven by an impressive CAGR of 8.09% through 2033. This significant growth is fueled by an increasing demand for immersive and collaborative display solutions across diverse sectors. Education is a primary driver, with interactive touch screens revolutionizing learning environments by fostering engagement and personalized instruction. Businesses are adopting these displays for enhanced presentations, video conferencing, and collaborative brainstorming sessions, boosting productivity and streamlining operations. The healthcare sector is also leveraging this technology for patient education, remote diagnostics, and surgical planning, leading to improved patient care and outcomes. Furthermore, industrial applications are seeing increased adoption for control systems, data visualization, and training, optimizing efficiency and safety on the factory floor.

LED Interactive Touch Screen Market Size (In Billion)
The market is characterized by a growing preference for higher resolutions, with 4K displays gaining significant traction due to their superior clarity and detail, especially in professional and entertainment settings. While the initial investment can be a consideration, the long-term benefits of enhanced user experience, improved collaboration, and operational efficiencies are compelling businesses and institutions to integrate these advanced display solutions. Technological advancements in touch sensitivity, durability, and smart features are continuously expanding the capabilities and appeal of LED interactive touch screens. Key players like Samsung, LG, Panasonic, and Dell are at the forefront of innovation, introducing cutting-edge products that cater to evolving market needs. The widespread adoption across North America, Europe, and the rapidly growing Asia Pacific region underscores the global significance and future potential of this dynamic market.

LED Interactive Touch Screen Company Market Share
This comprehensive report delves deep into the burgeoning global LED Interactive Touch Screen market, providing an in-depth analysis from 2019 to 2033. Covering historical trends, current dynamics, and future projections, this study is an indispensable resource for industry stakeholders seeking to navigate this rapidly evolving landscape. With an estimated market size projected to reach billions in the coming years, understanding the key drivers, challenges, and opportunities is paramount for strategic decision-making. Our analysis spans critical segments including Education, Business, Industrial, Healthcare, and Others, with a granular examination of 2K, 4K, and other display resolutions. We also explore key industry developments that are shaping the future of interactive displays.
LED Interactive Touch Screen Market Dynamics & Concentration
The LED Interactive Touch Screen market exhibits a dynamic interplay of innovation, competition, and evolving end-user demands, with a global market share anticipated to grow significantly, projected to reach XX billion by the forecast year. Market concentration is characterized by a blend of established global giants and agile regional players, with key companies like Samsung, LG, and Panasonic vying for dominance through continuous product development and strategic market penetration. The number of M&A activities is expected to rise by XX% over the forecast period, as larger entities seek to acquire innovative technologies and expand their market reach. Drivers of innovation are primarily fueled by advancements in touch sensor technology, display resolution, and integrated software solutions, enabling more intuitive and collaborative user experiences. Regulatory frameworks, while generally supportive of technological adoption, can vary across regions, impacting market entry and product certifications. Product substitutes, such as traditional whiteboards and projectors, are steadily losing ground to the superior functionality and engagement offered by LED interactive touch screens. End-user trends clearly indicate a growing preference for interactive and immersive learning and working environments, driving demand across all application segments.
LED Interactive Touch Screen Industry Trends & Analysis
The global LED Interactive Touch Screen industry is experiencing robust growth, propelled by a convergence of technological advancements, shifting consumer preferences, and increasing digitalization across various sectors. Market growth drivers are manifold, including the escalating demand for enhanced collaboration and communication tools in corporate settings, the transformative impact of interactive learning technologies in education, and the growing need for precise and dynamic display solutions in industrial and healthcare environments. The compound annual growth rate (CAGR) for this market is projected to be a substantial XX% over the forecast period of 2025–2033, indicating a strong upward trajectory. Technological disruptions, such as the integration of AI-powered features, advanced haptic feedback, and ultra-high definition (4K and 8K) resolutions, are continuously redefining the capabilities and applications of these displays. Consumer preferences are leaning towards larger screen sizes, seamless connectivity, and intuitive user interfaces that facilitate real-time data sharing and interactive presentations. Competitive dynamics are intense, with companies consistently investing in research and development to introduce next-generation products that offer superior performance, energy efficiency, and cost-effectiveness. Market penetration is steadily increasing as businesses and educational institutions recognize the significant return on investment derived from these interactive solutions, leading to wider adoption and integration into daily operations. The shift towards hybrid work models and remote learning further accentuates the need for effective collaborative tools, directly benefiting the LED interactive touch screen market. Furthermore, government initiatives promoting digital transformation in public sectors are also contributing to sustained market expansion. The integration of IoT capabilities within interactive touch screens is also emerging as a significant trend, enabling seamless connectivity with other smart devices and creating more comprehensive digital ecosystems.
Leading Markets & Segments in LED Interactive Touch Screen
The Business segment is projected to hold the dominant market share within the LED Interactive Touch Screen landscape, driven by the global push for enhanced productivity, collaboration, and digital transformation in corporate environments. The 4K resolution type is anticipated to lead segment growth, offering unparalleled clarity and detail essential for professional presentations, data visualization, and collaborative design processes. Economically, the robust growth of the global business sector, coupled with significant IT spending by enterprises, directly fuels the adoption of advanced display technologies. Infrastructure development in smart offices and conference rooms further supports the integration of these screens.
Business Application Dominance:
- Key Drivers: Increased adoption of hybrid work models, demand for seamless remote collaboration, need for engaging client presentations, and integration with videoconferencing systems.
- Detailed Analysis: Businesses are increasingly investing in interactive touch screens for meeting rooms, huddle spaces, and reception areas to foster better teamwork and client engagement. The ability to share screens, annotate in real-time, and access cloud-based documents directly on the display significantly boosts efficiency. The projected market size for the business segment is estimated to reach XX billion by 2033.
4K Resolution Leadership:
- Key Drivers: Superior visual fidelity for complex data, high-definition content playback, and immersive user experiences crucial for design, engineering, and data analysis.
- Detailed Analysis: As the cost of 4K displays continues to decrease, their adoption is becoming more widespread across various business applications. The enhanced detail and vibrant colors offered by 4K resolution are vital for industries requiring precise visual representation, from architectural design to medical imaging.
Regional Dominance: North America and Europe are expected to remain leading regions due to high disposable incomes, strong technological infrastructure, and early adoption of advanced technologies by businesses and educational institutions.
LED Interactive Touch Screen Product Developments
Recent product developments in the LED Interactive Touch Screen market are characterized by a relentless pursuit of enhanced user experience and functionality. Innovations include advanced multi-touch capabilities, improved latency for fluid drawing and annotation, and the integration of AI-driven features for intelligent content recognition and personalized interactions. Companies are focusing on developing thinner, lighter, and more energy-efficient displays with enhanced durability for industrial and public settings. The competitive advantage lies in seamless software integration, robust connectivity options (Wi-Fi, Bluetooth, USB-C), and the ability to offer tailored solutions for specific application needs, such as interactive whiteboards for education or digital signage for retail.
Key Drivers of LED Interactive Touch Screen Growth
The growth of the LED Interactive Touch Screen market is significantly propelled by several key factors. Technological advancements in LED display technology, including higher resolutions (4K and beyond), improved touch accuracy, and faster response times, are making these devices more appealing. The increasing demand for interactive and collaborative learning environments in the education sector is a major driver, as institutions seek to engage students more effectively. In the business world, the rise of hybrid work models and the need for enhanced remote collaboration are boosting adoption. Economic factors such as increased IT spending by enterprises and government initiatives promoting digital transformation further accelerate growth. Regulatory support for technology adoption in public sectors and growing awareness of the benefits of interactive displays also contribute to market expansion.
Challenges in the LED Interactive Touch Screen Market
Despite the positive growth trajectory, the LED Interactive Touch Screen market faces several challenges. High initial investment costs can be a significant barrier, particularly for smaller businesses and educational institutions with limited budgets. Intense competition among manufacturers can lead to price wars, impacting profit margins. Supply chain disruptions and the availability of critical components can affect production and lead times, leading to potential project delays. Furthermore, the need for continuous software updates and technical support can be a challenge for some end-users. Cybersecurity concerns related to connected interactive displays also require careful consideration and robust protective measures, with estimated security breaches costing the industry XX billion annually.
Emerging Opportunities in LED Interactive Touch Screen
Emerging opportunities in the LED Interactive Touch Screen market are vast and diverse. The growing adoption of the Internet of Things (IoT) allows for the integration of interactive displays into smart building ecosystems, creating intelligent and responsive environments. The expansion of the remote work and hybrid learning trends presents a significant opportunity for enhanced collaborative solutions. Furthermore, advancements in augmented reality (AR) and virtual reality (VR) integration with touch screens can open up new immersive application possibilities. Emerging markets in developing economies, with their increasing focus on digitalization, offer substantial untapped potential. Strategic partnerships between hardware manufacturers, software developers, and content providers are crucial for unlocking these opportunities and delivering comprehensive solutions.
Leading Players in the LED Interactive Touch Screen Sector
- Panasonic
- Samsung
- Sharp
- LG
- ViewSonic
- Dell
- Philips
- Parrot Products
- Cetrix Technologies
- Shenzhen Fangcheng
- Speechi
- Pro Display
- Returnstar Interactive Technology
- SoftLogic
- Ricoh
Key Milestones in LED Interactive Touch Screen Industry
- 2019: Introduction of advanced AI-powered annotation features in commercial displays.
- 2020: Significant surge in demand for interactive whiteboards for remote education due to the global pandemic.
- 2021: Launch of ultra-high definition (8K) interactive touch screens for professional visualization.
- 2022: Increased integration of cloud-based collaboration platforms directly into interactive screen operating systems.
- 2023: Development of more energy-efficient LED display technologies, reducing operational costs.
- 2024: Growing trend towards seamless integration of interactive screens with IoT devices and smart home/office ecosystems.
Strategic Outlook for LED Interactive Touch Screen Market
The strategic outlook for the LED Interactive Touch Screen market is exceptionally promising, with continued innovation and expanding applications set to drive substantial growth. The focus will increasingly be on developing intelligent, connected displays that seamlessly integrate with existing digital infrastructures. Strategic opportunities lie in catering to niche markets, such as specialized industrial control rooms and advanced healthcare diagnostics. The development of more sustainable and eco-friendly manufacturing processes will also be a key differentiator. Continued investment in research and development, coupled with strategic alliances, will be crucial for market leaders to maintain their competitive edge and capitalize on the projected market expansion, estimated to reach XX billion by 2033.
LED Interactive Touch Screen Segmentation
-
1. Application
- 1.1. Education
- 1.2. Business
- 1.3. Industrial
- 1.4. Healthcare
- 1.5. Others
-
2. Types
- 2.1. 2K
- 2.2. 4K
- 2.3. Others
LED Interactive Touch Screen Segmentation By Geography
-
1. North America
- 1.1. United States
- 1.2. Canada
- 1.3. Mexico
-
2. South America
- 2.1. Brazil
- 2.2. Argentina
- 2.3. Rest of South America
-
3. Europe
- 3.1. United Kingdom
- 3.2. Germany
- 3.3. France
- 3.4. Italy
- 3.5. Spain
- 3.6. Russia
- 3.7. Benelux
- 3.8. Nordics
- 3.9. Rest of Europe
-
4. Middle East & Africa
- 4.1. Turkey
- 4.2. Israel
- 4.3. GCC
- 4.4. North Africa
- 4.5. South Africa
- 4.6. Rest of Middle East & Africa
-
5. Asia Pacific
- 5.1. China
- 5.2. India
- 5.3. Japan
- 5.4. South Korea
- 5.5. ASEAN
- 5.6. Oceania
- 5.7. Rest of Asia Pacific
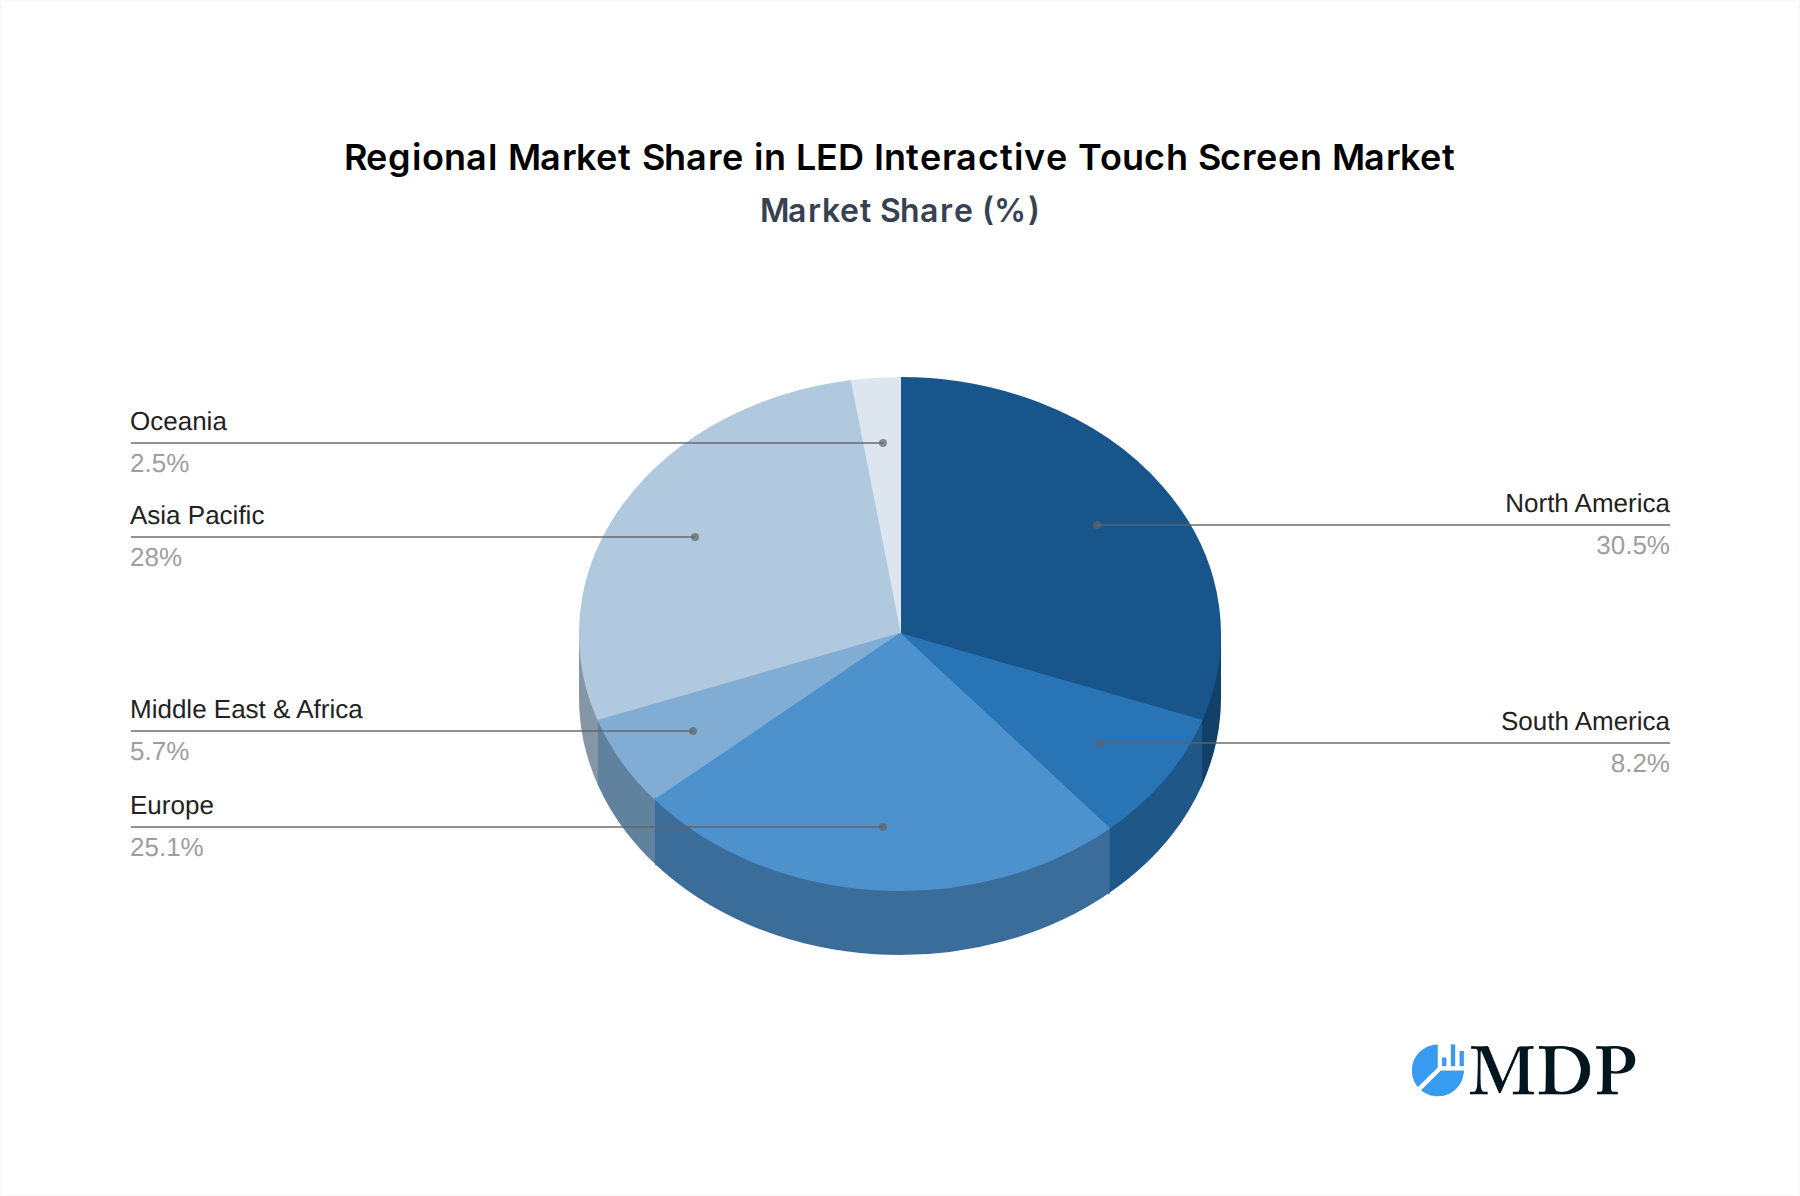
LED Interactive Touch Screen Regional Market Share
Geographic Coverage of LED Interactive Touch Screen
LED Interactive Touch Screen REPORT HIGHLIGHTS
| Aspects | Details |
|---|---|
| Study Period | 2020-2034 |
| Base Year | 2025 |
| Estimated Year | 2026 |
| Forecast Period | 2026-2034 |
| Historical Period | 2020-2025 |
| Growth Rate | CAGR of 8.09% from 2020-2034 |
| Segmentation |
|
Table of Contents
- 1. Introduction
- 1.1. Research Scope
- 1.2. Market Segmentation
- 1.3. Research Methodology
- 1.4. Definitions and Assumptions
- 2. Executive Summary
- 2.1. Introduction
- 3. Market Dynamics
- 3.1. Introduction
- 3.2. Market Drivers
- 3.3. Market Restrains
- 3.4. Market Trends
- 4. Market Factor Analysis
- 4.1. Porters Five Forces
- 4.2. Supply/Value Chain
- 4.3. PESTEL analysis
- 4.4. Market Entropy
- 4.5. Patent/Trademark Analysis
- 5. Global LED Interactive Touch Screen Analysis, Insights and Forecast, 2020-2032
- 5.1. Market Analysis, Insights and Forecast - by Application
- 5.1.1. Education
- 5.1.2. Business
- 5.1.3. Industrial
- 5.1.4. Healthcare
- 5.1.5. Others
- 5.2. Market Analysis, Insights and Forecast - by Types
- 5.2.1. 2K
- 5.2.2. 4K
- 5.2.3. Others
- 5.3. Market Analysis, Insights and Forecast - by Region
- 5.3.1. North America
- 5.3.2. South America
- 5.3.3. Europe
- 5.3.4. Middle East & Africa
- 5.3.5. Asia Pacific
- 5.1. Market Analysis, Insights and Forecast - by Application
- 6. North America LED Interactive Touch Screen Analysis, Insights and Forecast, 2020-2032
- 6.1. Market Analysis, Insights and Forecast - by Application
- 6.1.1. Education
- 6.1.2. Business
- 6.1.3. Industrial
- 6.1.4. Healthcare
- 6.1.5. Others
- 6.2. Market Analysis, Insights and Forecast - by Types
- 6.2.1. 2K
- 6.2.2. 4K
- 6.2.3. Others
- 6.1. Market Analysis, Insights and Forecast - by Application
- 7. South America LED Interactive Touch Screen Analysis, Insights and Forecast, 2020-2032
- 7.1. Market Analysis, Insights and Forecast - by Application
- 7.1.1. Education
- 7.1.2. Business
- 7.1.3. Industrial
- 7.1.4. Healthcare
- 7.1.5. Others
- 7.2. Market Analysis, Insights and Forecast - by Types
- 7.2.1. 2K
- 7.2.2. 4K
- 7.2.3. Others
- 7.1. Market Analysis, Insights and Forecast - by Application
- 8. Europe LED Interactive Touch Screen Analysis, Insights and Forecast, 2020-2032
- 8.1. Market Analysis, Insights and Forecast - by Application
- 8.1.1. Education
- 8.1.2. Business
- 8.1.3. Industrial
- 8.1.4. Healthcare
- 8.1.5. Others
- 8.2. Market Analysis, Insights and Forecast - by Types
- 8.2.1. 2K
- 8.2.2. 4K
- 8.2.3. Others
- 8.1. Market Analysis, Insights and Forecast - by Application
- 9. Middle East & Africa LED Interactive Touch Screen Analysis, Insights and Forecast, 2020-2032
- 9.1. Market Analysis, Insights and Forecast - by Application
- 9.1.1. Education
- 9.1.2. Business
- 9.1.3. Industrial
- 9.1.4. Healthcare
- 9.1.5. Others
- 9.2. Market Analysis, Insights and Forecast - by Types
- 9.2.1. 2K
- 9.2.2. 4K
- 9.2.3. Others
- 9.1. Market Analysis, Insights and Forecast - by Application
- 10. Asia Pacific LED Interactive Touch Screen Analysis, Insights and Forecast, 2020-2032
- 10.1. Market Analysis, Insights and Forecast - by Application
- 10.1.1. Education
- 10.1.2. Business
- 10.1.3. Industrial
- 10.1.4. Healthcare
- 10.1.5. Others
- 10.2. Market Analysis, Insights and Forecast - by Types
- 10.2.1. 2K
- 10.2.2. 4K
- 10.2.3. Others
- 10.1. Market Analysis, Insights and Forecast - by Application
- 11. Competitive Analysis
- 11.1. Global Market Share Analysis 2025
- 11.2. Company Profiles
- 11.2.1 Panasonic
- 11.2.1.1. Overview
- 11.2.1.2. Products
- 11.2.1.3. SWOT Analysis
- 11.2.1.4. Recent Developments
- 11.2.1.5. Financials (Based on Availability)
- 11.2.2 Samsung
- 11.2.2.1. Overview
- 11.2.2.2. Products
- 11.2.2.3. SWOT Analysis
- 11.2.2.4. Recent Developments
- 11.2.2.5. Financials (Based on Availability)
- 11.2.3 Sharp
- 11.2.3.1. Overview
- 11.2.3.2. Products
- 11.2.3.3. SWOT Analysis
- 11.2.3.4. Recent Developments
- 11.2.3.5. Financials (Based on Availability)
- 11.2.4 LG
- 11.2.4.1. Overview
- 11.2.4.2. Products
- 11.2.4.3. SWOT Analysis
- 11.2.4.4. Recent Developments
- 11.2.4.5. Financials (Based on Availability)
- 11.2.5 ViewSonic
- 11.2.5.1. Overview
- 11.2.5.2. Products
- 11.2.5.3. SWOT Analysis
- 11.2.5.4. Recent Developments
- 11.2.5.5. Financials (Based on Availability)
- 11.2.6 Dell
- 11.2.6.1. Overview
- 11.2.6.2. Products
- 11.2.6.3. SWOT Analysis
- 11.2.6.4. Recent Developments
- 11.2.6.5. Financials (Based on Availability)
- 11.2.7 Philips
- 11.2.7.1. Overview
- 11.2.7.2. Products
- 11.2.7.3. SWOT Analysis
- 11.2.7.4. Recent Developments
- 11.2.7.5. Financials (Based on Availability)
- 11.2.8 Parrot Products
- 11.2.8.1. Overview
- 11.2.8.2. Products
- 11.2.8.3. SWOT Analysis
- 11.2.8.4. Recent Developments
- 11.2.8.5. Financials (Based on Availability)
- 11.2.9 Cetrix Technologies
- 11.2.9.1. Overview
- 11.2.9.2. Products
- 11.2.9.3. SWOT Analysis
- 11.2.9.4. Recent Developments
- 11.2.9.5. Financials (Based on Availability)
- 11.2.10 Shenzhen Fangcheng
- 11.2.10.1. Overview
- 11.2.10.2. Products
- 11.2.10.3. SWOT Analysis
- 11.2.10.4. Recent Developments
- 11.2.10.5. Financials (Based on Availability)
- 11.2.11 Speechi
- 11.2.11.1. Overview
- 11.2.11.2. Products
- 11.2.11.3. SWOT Analysis
- 11.2.11.4. Recent Developments
- 11.2.11.5. Financials (Based on Availability)
- 11.2.12 Pro Display
- 11.2.12.1. Overview
- 11.2.12.2. Products
- 11.2.12.3. SWOT Analysis
- 11.2.12.4. Recent Developments
- 11.2.12.5. Financials (Based on Availability)
- 11.2.13 Returnstar Interactive Technology
- 11.2.13.1. Overview
- 11.2.13.2. Products
- 11.2.13.3. SWOT Analysis
- 11.2.13.4. Recent Developments
- 11.2.13.5. Financials (Based on Availability)
- 11.2.14 SoftLogic
- 11.2.14.1. Overview
- 11.2.14.2. Products
- 11.2.14.3. SWOT Analysis
- 11.2.14.4. Recent Developments
- 11.2.14.5. Financials (Based on Availability)
- 11.2.15 Ricoh
- 11.2.15.1. Overview
- 11.2.15.2. Products
- 11.2.15.3. SWOT Analysis
- 11.2.15.4. Recent Developments
- 11.2.15.5. Financials (Based on Availability)
- 11.2.1 Panasonic
List of Figures
- Figure 1: Global LED Interactive Touch Screen Revenue Breakdown (billion, %) by Region 2025 & 2033
- Figure 2: Global LED Interactive Touch Screen Volume Breakdown (K, %) by Region 2025 & 2033
- Figure 3: North America LED Interactive Touch Screen Revenue (billion), by Application 2025 & 2033
- Figure 4: North America LED Interactive Touch Screen Volume (K), by Application 2025 & 2033
- Figure 5: North America LED Interactive Touch Screen Revenue Share (%), by Application 2025 & 2033
- Figure 6: North America LED Interactive Touch Screen Volume Share (%), by Application 2025 & 2033
- Figure 7: North America LED Interactive Touch Screen Revenue (billion), by Types 2025 & 2033
- Figure 8: North America LED Interactive Touch Screen Volume (K), by Types 2025 & 2033
- Figure 9: North America LED Interactive Touch Screen Revenue Share (%), by Types 2025 & 2033
- Figure 10: North America LED Interactive Touch Screen Volume Share (%), by Types 2025 & 2033
- Figure 11: North America LED Interactive Touch Screen Revenue (billion), by Country 2025 & 2033
- Figure 12: North America LED Interactive Touch Screen Volume (K), by Country 2025 & 2033
- Figure 13: North America LED Interactive Touch Screen Revenue Share (%), by Country 2025 & 2033
- Figure 14: North America LED Interactive Touch Screen Volume Share (%), by Country 2025 & 2033
- Figure 15: South America LED Interactive Touch Screen Revenue (billion), by Application 2025 & 2033
- Figure 16: South America LED Interactive Touch Screen Volume (K), by Application 2025 & 2033
- Figure 17: South America LED Interactive Touch Screen Revenue Share (%), by Application 2025 & 2033
- Figure 18: South America LED Interactive Touch Screen Volume Share (%), by Application 2025 & 2033
- Figure 19: South America LED Interactive Touch Screen Revenue (billion), by Types 2025 & 2033
- Figure 20: South America LED Interactive Touch Screen Volume (K), by Types 2025 & 2033
- Figure 21: South America LED Interactive Touch Screen Revenue Share (%), by Types 2025 & 2033
- Figure 22: South America LED Interactive Touch Screen Volume Share (%), by Types 2025 & 2033
- Figure 23: South America LED Interactive Touch Screen Revenue (billion), by Country 2025 & 2033
- Figure 24: South America LED Interactive Touch Screen Volume (K), by Country 2025 & 2033
- Figure 25: South America LED Interactive Touch Screen Revenue Share (%), by Country 2025 & 2033
- Figure 26: South America LED Interactive Touch Screen Volume Share (%), by Country 2025 & 2033
- Figure 27: Europe LED Interactive Touch Screen Revenue (billion), by Application 2025 & 2033
- Figure 28: Europe LED Interactive Touch Screen Volume (K), by Application 2025 & 2033
- Figure 29: Europe LED Interactive Touch Screen Revenue Share (%), by Application 2025 & 2033
- Figure 30: Europe LED Interactive Touch Screen Volume Share (%), by Application 2025 & 2033
- Figure 31: Europe LED Interactive Touch Screen Revenue (billion), by Types 2025 & 2033
- Figure 32: Europe LED Interactive Touch Screen Volume (K), by Types 2025 & 2033
- Figure 33: Europe LED Interactive Touch Screen Revenue Share (%), by Types 2025 & 2033
- Figure 34: Europe LED Interactive Touch Screen Volume Share (%), by Types 2025 & 2033
- Figure 35: Europe LED Interactive Touch Screen Revenue (billion), by Country 2025 & 2033
- Figure 36: Europe LED Interactive Touch Screen Volume (K), by Country 2025 & 2033
- Figure 37: Europe LED Interactive Touch Screen Revenue Share (%), by Country 2025 & 2033
- Figure 38: Europe LED Interactive Touch Screen Volume Share (%), by Country 2025 & 2033
- Figure 39: Middle East & Africa LED Interactive Touch Screen Revenue (billion), by Application 2025 & 2033
- Figure 40: Middle East & Africa LED Interactive Touch Screen Volume (K), by Application 2025 & 2033
- Figure 41: Middle East & Africa LED Interactive Touch Screen Revenue Share (%), by Application 2025 & 2033
- Figure 42: Middle East & Africa LED Interactive Touch Screen Volume Share (%), by Application 2025 & 2033
- Figure 43: Middle East & Africa LED Interactive Touch Screen Revenue (billion), by Types 2025 & 2033
- Figure 44: Middle East & Africa LED Interactive Touch Screen Volume (K), by Types 2025 & 2033
- Figure 45: Middle East & Africa LED Interactive Touch Screen Revenue Share (%), by Types 2025 & 2033
- Figure 46: Middle East & Africa LED Interactive Touch Screen Volume Share (%), by Types 2025 & 2033
- Figure 47: Middle East & Africa LED Interactive Touch Screen Revenue (billion), by Country 2025 & 2033
- Figure 48: Middle East & Africa LED Interactive Touch Screen Volume (K), by Country 2025 & 2033
- Figure 49: Middle East & Africa LED Interactive Touch Screen Revenue Share (%), by Country 2025 & 2033
- Figure 50: Middle East & Africa LED Interactive Touch Screen Volume Share (%), by Country 2025 & 2033
- Figure 51: Asia Pacific LED Interactive Touch Screen Revenue (billion), by Application 2025 & 2033
- Figure 52: Asia Pacific LED Interactive Touch Screen Volume (K), by Application 2025 & 2033
- Figure 53: Asia Pacific LED Interactive Touch Screen Revenue Share (%), by Application 2025 & 2033
- Figure 54: Asia Pacific LED Interactive Touch Screen Volume Share (%), by Application 2025 & 2033
- Figure 55: Asia Pacific LED Interactive Touch Screen Revenue (billion), by Types 2025 & 2033
- Figure 56: Asia Pacific LED Interactive Touch Screen Volume (K), by Types 2025 & 2033
- Figure 57: Asia Pacific LED Interactive Touch Screen Revenue Share (%), by Types 2025 & 2033
- Figure 58: Asia Pacific LED Interactive Touch Screen Volume Share (%), by Types 2025 & 2033
- Figure 59: Asia Pacific LED Interactive Touch Screen Revenue (billion), by Country 2025 & 2033
- Figure 60: Asia Pacific LED Interactive Touch Screen Volume (K), by Country 2025 & 2033
- Figure 61: Asia Pacific LED Interactive Touch Screen Revenue Share (%), by Country 2025 & 2033
- Figure 62: Asia Pacific LED Interactive Touch Screen Volume Share (%), by Country 2025 & 2033
List of Tables
- Table 1: Global LED Interactive Touch Screen Revenue billion Forecast, by Application 2020 & 2033
- Table 2: Global LED Interactive Touch Screen Volume K Forecast, by Application 2020 & 2033
- Table 3: Global LED Interactive Touch Screen Revenue billion Forecast, by Types 2020 & 2033
- Table 4: Global LED Interactive Touch Screen Volume K Forecast, by Types 2020 & 2033
- Table 5: Global LED Interactive Touch Screen Revenue billion Forecast, by Region 2020 & 2033
- Table 6: Global LED Interactive Touch Screen Volume K Forecast, by Region 2020 & 2033
- Table 7: Global LED Interactive Touch Screen Revenue billion Forecast, by Application 2020 & 2033
- Table 8: Global LED Interactive Touch Screen Volume K Forecast, by Application 2020 & 2033
- Table 9: Global LED Interactive Touch Screen Revenue billion Forecast, by Types 2020 & 2033
- Table 10: Global LED Interactive Touch Screen Volume K Forecast, by Types 2020 & 2033
- Table 11: Global LED Interactive Touch Screen Revenue billion Forecast, by Country 2020 & 2033
- Table 12: Global LED Interactive Touch Screen Volume K Forecast, by Country 2020 & 2033
- Table 13: United States LED Interactive Touch Screen Revenue (billion) Forecast, by Application 2020 & 2033
- Table 14: United States LED Interactive Touch Screen Volume (K) Forecast, by Application 2020 & 2033
- Table 15: Canada LED Interactive Touch Screen Revenue (billion) Forecast, by Application 2020 & 2033
- Table 16: Canada LED Interactive Touch Screen Volume (K) Forecast, by Application 2020 & 2033
- Table 17: Mexico LED Interactive Touch Screen Revenue (billion) Forecast, by Application 2020 & 2033
- Table 18: Mexico LED Interactive Touch Screen Volume (K) Forecast, by Application 2020 & 2033
- Table 19: Global LED Interactive Touch Screen Revenue billion Forecast, by Application 2020 & 2033
- Table 20: Global LED Interactive Touch Screen Volume K Forecast, by Application 2020 & 2033
- Table 21: Global LED Interactive Touch Screen Revenue billion Forecast, by Types 2020 & 2033
- Table 22: Global LED Interactive Touch Screen Volume K Forecast, by Types 2020 & 2033
- Table 23: Global LED Interactive Touch Screen Revenue billion Forecast, by Country 2020 & 2033
- Table 24: Global LED Interactive Touch Screen Volume K Forecast, by Country 2020 & 2033
- Table 25: Brazil LED Interactive Touch Screen Revenue (billion) Forecast, by Application 2020 & 2033
- Table 26: Brazil LED Interactive Touch Screen Volume (K) Forecast, by Application 2020 & 2033
- Table 27: Argentina LED Interactive Touch Screen Revenue (billion) Forecast, by Application 2020 & 2033
- Table 28: Argentina LED Interactive Touch Screen Volume (K) Forecast, by Application 2020 & 2033
- Table 29: Rest of South America LED Interactive Touch Screen Revenue (billion) Forecast, by Application 2020 & 2033
- Table 30: Rest of South America LED Interactive Touch Screen Volume (K) Forecast, by Application 2020 & 2033
- Table 31: Global LED Interactive Touch Screen Revenue billion Forecast, by Application 2020 & 2033
- Table 32: Global LED Interactive Touch Screen Volume K Forecast, by Application 2020 & 2033
- Table 33: Global LED Interactive Touch Screen Revenue billion Forecast, by Types 2020 & 2033
- Table 34: Global LED Interactive Touch Screen Volume K Forecast, by Types 2020 & 2033
- Table 35: Global LED Interactive Touch Screen Revenue billion Forecast, by Country 2020 & 2033
- Table 36: Global LED Interactive Touch Screen Volume K Forecast, by Country 2020 & 2033
- Table 37: United Kingdom LED Interactive Touch Screen Revenue (billion) Forecast, by Application 2020 & 2033
- Table 38: United Kingdom LED Interactive Touch Screen Volume (K) Forecast, by Application 2020 & 2033
- Table 39: Germany LED Interactive Touch Screen Revenue (billion) Forecast, by Application 2020 & 2033
- Table 40: Germany LED Interactive Touch Screen Volume (K) Forecast, by Application 2020 & 2033
- Table 41: France LED Interactive Touch Screen Revenue (billion) Forecast, by Application 2020 & 2033
- Table 42: France LED Interactive Touch Screen Volume (K) Forecast, by Application 2020 & 2033
- Table 43: Italy LED Interactive Touch Screen Revenue (billion) Forecast, by Application 2020 & 2033
- Table 44: Italy LED Interactive Touch Screen Volume (K) Forecast, by Application 2020 & 2033
- Table 45: Spain LED Interactive Touch Screen Revenue (billion) Forecast, by Application 2020 & 2033
- Table 46: Spain LED Interactive Touch Screen Volume (K) Forecast, by Application 2020 & 2033
- Table 47: Russia LED Interactive Touch Screen Revenue (billion) Forecast, by Application 2020 & 2033
- Table 48: Russia LED Interactive Touch Screen Volume (K) Forecast, by Application 2020 & 2033
- Table 49: Benelux LED Interactive Touch Screen Revenue (billion) Forecast, by Application 2020 & 2033
- Table 50: Benelux LED Interactive Touch Screen Volume (K) Forecast, by Application 2020 & 2033
- Table 51: Nordics LED Interactive Touch Screen Revenue (billion) Forecast, by Application 2020 & 2033
- Table 52: Nordics LED Interactive Touch Screen Volume (K) Forecast, by Application 2020 & 2033
- Table 53: Rest of Europe LED Interactive Touch Screen Revenue (billion) Forecast, by Application 2020 & 2033
- Table 54: Rest of Europe LED Interactive Touch Screen Volume (K) Forecast, by Application 2020 & 2033
- Table 55: Global LED Interactive Touch Screen Revenue billion Forecast, by Application 2020 & 2033
- Table 56: Global LED Interactive Touch Screen Volume K Forecast, by Application 2020 & 2033
- Table 57: Global LED Interactive Touch Screen Revenue billion Forecast, by Types 2020 & 2033
- Table 58: Global LED Interactive Touch Screen Volume K Forecast, by Types 2020 & 2033
- Table 59: Global LED Interactive Touch Screen Revenue billion Forecast, by Country 2020 & 2033
- Table 60: Global LED Interactive Touch Screen Volume K Forecast, by Country 2020 & 2033
- Table 61: Turkey LED Interactive Touch Screen Revenue (billion) Forecast, by Application 2020 & 2033
- Table 62: Turkey LED Interactive Touch Screen Volume (K) Forecast, by Application 2020 & 2033
- Table 63: Israel LED Interactive Touch Screen Revenue (billion) Forecast, by Application 2020 & 2033
- Table 64: Israel LED Interactive Touch Screen Volume (K) Forecast, by Application 2020 & 2033
- Table 65: GCC LED Interactive Touch Screen Revenue (billion) Forecast, by Application 2020 & 2033
- Table 66: GCC LED Interactive Touch Screen Volume (K) Forecast, by Application 2020 & 2033
- Table 67: North Africa LED Interactive Touch Screen Revenue (billion) Forecast, by Application 2020 & 2033
- Table 68: North Africa LED Interactive Touch Screen Volume (K) Forecast, by Application 2020 & 2033
- Table 69: South Africa LED Interactive Touch Screen Revenue (billion) Forecast, by Application 2020 & 2033
- Table 70: South Africa LED Interactive Touch Screen Volume (K) Forecast, by Application 2020 & 2033
- Table 71: Rest of Middle East & Africa LED Interactive Touch Screen Revenue (billion) Forecast, by Application 2020 & 2033
- Table 72: Rest of Middle East & Africa LED Interactive Touch Screen Volume (K) Forecast, by Application 2020 & 2033
- Table 73: Global LED Interactive Touch Screen Revenue billion Forecast, by Application 2020 & 2033
- Table 74: Global LED Interactive Touch Screen Volume K Forecast, by Application 2020 & 2033
- Table 75: Global LED Interactive Touch Screen Revenue billion Forecast, by Types 2020 & 2033
- Table 76: Global LED Interactive Touch Screen Volume K Forecast, by Types 2020 & 2033
- Table 77: Global LED Interactive Touch Screen Revenue billion Forecast, by Country 2020 & 2033
- Table 78: Global LED Interactive Touch Screen Volume K Forecast, by Country 2020 & 2033
- Table 79: China LED Interactive Touch Screen Revenue (billion) Forecast, by Application 2020 & 2033
- Table 80: China LED Interactive Touch Screen Volume (K) Forecast, by Application 2020 & 2033
- Table 81: India LED Interactive Touch Screen Revenue (billion) Forecast, by Application 2020 & 2033
- Table 82: India LED Interactive Touch Screen Volume (K) Forecast, by Application 2020 & 2033
- Table 83: Japan LED Interactive Touch Screen Revenue (billion) Forecast, by Application 2020 & 2033
- Table 84: Japan LED Interactive Touch Screen Volume (K) Forecast, by Application 2020 & 2033
- Table 85: South Korea LED Interactive Touch Screen Revenue (billion) Forecast, by Application 2020 & 2033
- Table 86: South Korea LED Interactive Touch Screen Volume (K) Forecast, by Application 2020 & 2033
- Table 87: ASEAN LED Interactive Touch Screen Revenue (billion) Forecast, by Application 2020 & 2033
- Table 88: ASEAN LED Interactive Touch Screen Volume (K) Forecast, by Application 2020 & 2033
- Table 89: Oceania LED Interactive Touch Screen Revenue (billion) Forecast, by Application 2020 & 2033
- Table 90: Oceania LED Interactive Touch Screen Volume (K) Forecast, by Application 2020 & 2033
- Table 91: Rest of Asia Pacific LED Interactive Touch Screen Revenue (billion) Forecast, by Application 2020 & 2033
- Table 92: Rest of Asia Pacific LED Interactive Touch Screen Volume (K) Forecast, by Application 2020 & 2033
Frequently Asked Questions
1. What is the projected Compound Annual Growth Rate (CAGR) of the LED Interactive Touch Screen?
The projected CAGR is approximately 8.09%.
2. Which companies are prominent players in the LED Interactive Touch Screen?
Key companies in the market include Panasonic, Samsung, Sharp, LG, ViewSonic, Dell, Philips, Parrot Products, Cetrix Technologies, Shenzhen Fangcheng, Speechi, Pro Display, Returnstar Interactive Technology, SoftLogic, Ricoh.
3. What are the main segments of the LED Interactive Touch Screen?
The market segments include Application, Types.
4. Can you provide details about the market size?
The market size is estimated to be USD 48.29 billion as of 2022.
5. What are some drivers contributing to market growth?
N/A
6. What are the notable trends driving market growth?
N/A
7. Are there any restraints impacting market growth?
N/A
8. Can you provide examples of recent developments in the market?
N/A
9. What pricing options are available for accessing the report?
Pricing options include single-user, multi-user, and enterprise licenses priced at USD 3350.00, USD 5025.00, and USD 6700.00 respectively.
10. Is the market size provided in terms of value or volume?
The market size is provided in terms of value, measured in billion and volume, measured in K.
11. Are there any specific market keywords associated with the report?
Yes, the market keyword associated with the report is "LED Interactive Touch Screen," which aids in identifying and referencing the specific market segment covered.
12. How do I determine which pricing option suits my needs best?
The pricing options vary based on user requirements and access needs. Individual users may opt for single-user licenses, while businesses requiring broader access may choose multi-user or enterprise licenses for cost-effective access to the report.
13. Are there any additional resources or data provided in the LED Interactive Touch Screen report?
While the report offers comprehensive insights, it's advisable to review the specific contents or supplementary materials provided to ascertain if additional resources or data are available.
14. How can I stay updated on further developments or reports in the LED Interactive Touch Screen?
To stay informed about further developments, trends, and reports in the LED Interactive Touch Screen, consider subscribing to industry newsletters, following relevant companies and organizations, or regularly checking reputable industry news sources and publications.
Methodology
Step 1 - Identification of Relevant Samples Size from Population Database


Step 2 - Approaches for Defining Global Market Size (Value, Volume* & Price*)

Note*: In applicable scenarios
Step 3 - Data Sources
Primary Research
- Web Analytics
- Survey Reports
- Research Institute
- Latest Research Reports
- Opinion Leaders
Secondary Research
- Annual Reports
- White Paper
- Latest Press Release
- Industry Association
- Paid Database
- Investor Presentations

Step 4 - Data Triangulation
Involves using different sources of information in order to increase the validity of a study
These sources are likely to be stakeholders in a program - participants, other researchers, program staff, other community members, and so on.
Then we put all data in single framework & apply various statistical tools to find out the dynamic on the market.
During the analysis stage, feedback from the stakeholder groups would be compared to determine areas of agreement as well as areas of divergence