

Key Insights
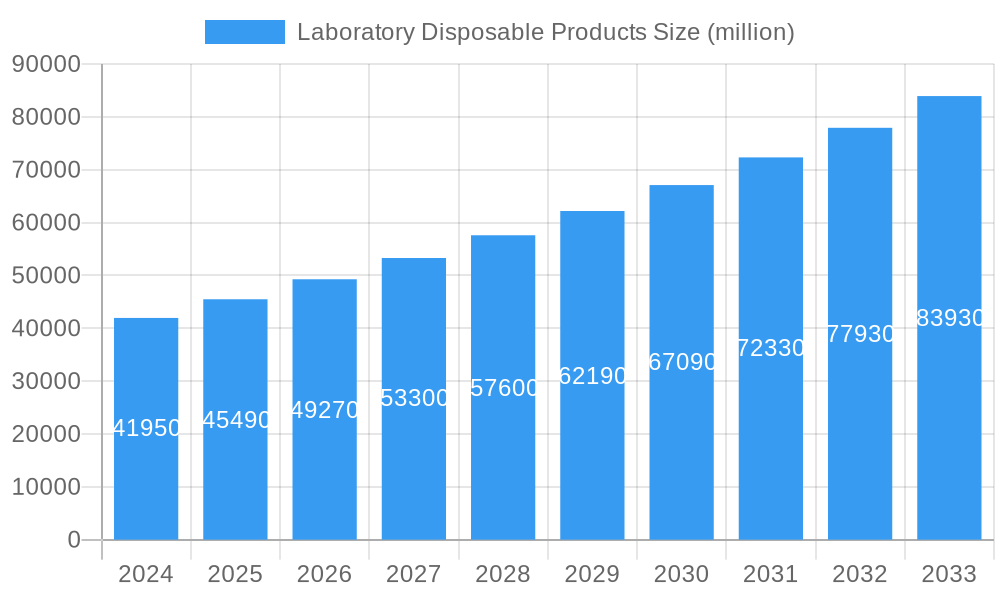
The global market for laboratory disposable products is experiencing robust growth, driven by the increasing prevalence of chronic diseases, the expansion of the healthcare industry, and the rising demand for efficient and cost-effective laboratory testing procedures. The market's value in 2025 is estimated at $45 billion, projected to reach approximately $70 billion by 2033, reflecting a Compound Annual Growth Rate (CAGR) of approximately 5%. This growth is fueled by several key factors, including the increasing adoption of advanced diagnostic techniques, a surge in research and development activities in the pharmaceutical and biotechnology sectors, and the growing preference for single-use disposables to mitigate cross-contamination risks and enhance laboratory safety. Furthermore, technological advancements leading to the development of innovative disposable products, such as microfluidic devices and automated sample preparation systems, are contributing significantly to market expansion.
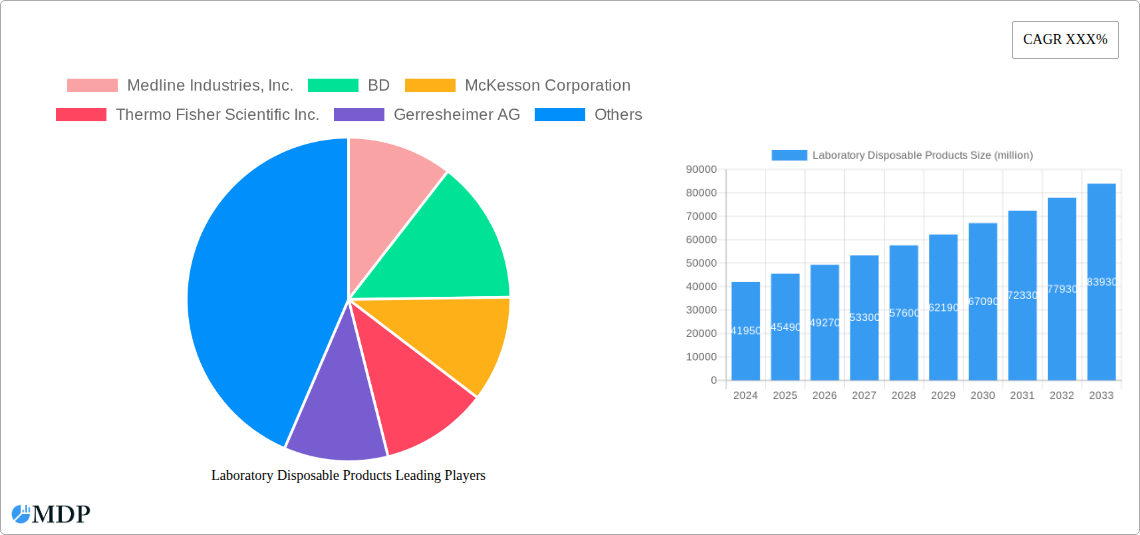
Laboratory Disposable Products Market Size (In Billion)
Several segments within the laboratory disposable products market are displaying particularly strong growth. These include consumables for molecular diagnostics (e.g., PCR tubes, reagents), cell culture products (e.g., cell culture flasks, plates), and microbiology supplies (e.g., petri dishes, swabs). Geographic expansion is also noteworthy, with emerging markets in Asia-Pacific and Latin America showing significant potential due to rising healthcare spending and increased investments in healthcare infrastructure. While challenges exist, such as price fluctuations in raw materials and regulatory hurdles in certain regions, the overall outlook for the laboratory disposable products market remains positive, with considerable opportunities for growth and innovation in the coming years. Major players like Medline Industries, BD, McKesson, and Thermo Fisher Scientific are leading this growth with their diverse product portfolios and global reach.
Laboratory Disposable Products Company Market Share
Unlock the Potential of the Multi-Billion Dollar Laboratory Disposable Products Market: A Comprehensive Report (2019-2033)
This comprehensive report provides an in-depth analysis of the global Laboratory Disposable Products market, projecting a multi-billion dollar valuation by 2033. The study covers the period from 2019 to 2033, with a base year of 2025 and a forecast period of 2025-2033. It offers critical insights for stakeholders including manufacturers, distributors, researchers, and investors seeking to navigate this dynamic market. Discover key trends, emerging opportunities, and competitive dynamics shaping the future of laboratory disposables. This report leverages extensive market research to provide actionable strategies and forecasts for success.
Laboratory Disposable Products Market Dynamics & Concentration
The global laboratory disposable products market is characterized by a moderately concentrated landscape with several major players holding significant market share. In 2024, the top five companies – Medline Industries, Inc., BD, McKesson Corporation, Thermo Fisher Scientific Inc., and Gerresheimer AG – collectively held an estimated xx% market share. Market concentration is influenced by factors such as economies of scale, strong brand recognition, and extensive distribution networks. Innovation plays a vital role, with companies continuously developing new products with enhanced features like improved sterility, biocompatibility, and automation compatibility. Stringent regulatory frameworks, including those from the FDA and other international bodies, significantly impact product development and market entry. The market is also impacted by the availability of substitute products such as reusable laboratory equipment, though their adoption is limited due to factors like increased cost and sterilization challenges. End-user trends, particularly increased demand from the pharmaceutical and biotechnology sectors, are driving growth. The market has witnessed significant M&A activity in recent years, with an estimated xx number of deals concluded between 2019 and 2024, mainly focused on expanding product portfolios and market reach.
- Market Concentration: Top 5 companies held an estimated xx% market share in 2024.
- Innovation Drivers: Enhanced sterility, biocompatibility, and automation capabilities.
- Regulatory Frameworks: FDA and international standards influence product development.
- Product Substitutes: Reusable equipment poses limited competition due to higher costs.
- End-User Trends: Increasing demand from pharmaceutical and biotechnology sectors.
- M&A Activities: Approximately xx deals between 2019 and 2024.
Laboratory Disposable Products Industry Trends & Analysis
The global laboratory disposable products market is experiencing robust growth, driven by several factors. The market exhibits a Compound Annual Growth Rate (CAGR) of xx% during the forecast period (2025-2033). Key factors fueling this growth include the rising prevalence of chronic diseases, increasing demand for diagnostic testing, and the expansion of the pharmaceutical and biotechnology industries. Technological advancements, such as the development of automated laboratory equipment and advanced materials, are further stimulating market growth. These innovations are enhancing the efficiency, accuracy, and reliability of laboratory procedures, driving the demand for compatible disposable products. Consumer preferences are shifting towards eco-friendly and sustainable options, which is influencing product development and driving the adoption of biodegradable and recyclable materials. The competitive dynamics are intense, with major players focusing on product innovation, strategic partnerships, and expansion into new markets to maintain a competitive edge. Market penetration remains high, particularly in developed countries.
Leading Markets & Segments in Laboratory Disposable Products
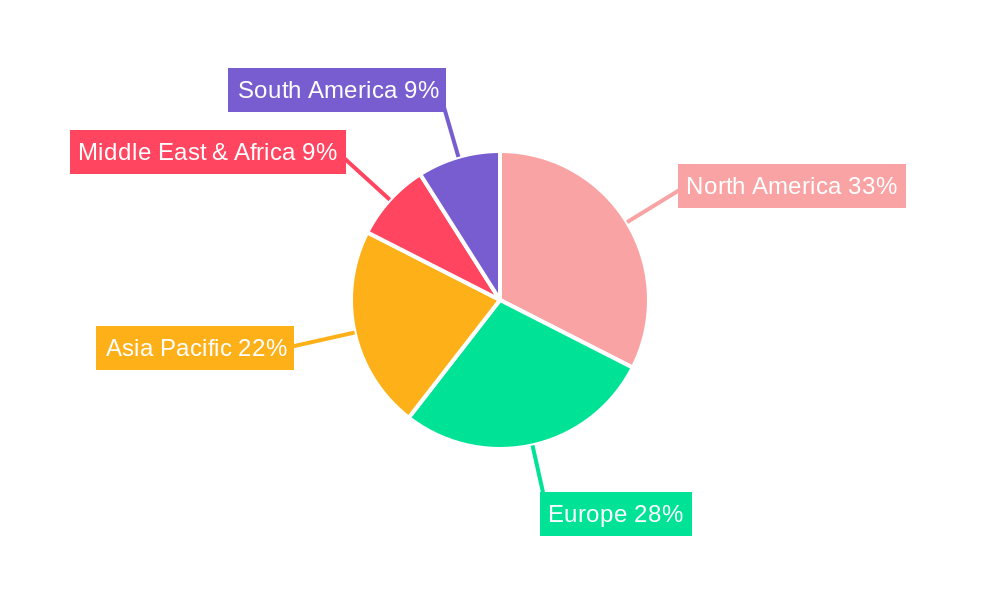
The North American region currently holds the dominant position in the global laboratory disposable products market, accounting for an estimated xx% of the global market in 2024. This dominance can be attributed to several key factors:
- Robust Healthcare Infrastructure: North America possesses a well-established healthcare system with significant investments in research and development.
- High Adoption of Advanced Technologies: High adoption rates for advanced laboratory equipment and technologies drive demand for compatible disposable products.
- Strong Regulatory Support: Favorable regulatory frameworks stimulate innovation and investment in the sector.
- High Research Expenditure: Significant government and private investments in research contribute significantly to the demand for laboratory disposables.
Detailed analysis shows that the dominance is primarily attributed to the United States, followed by Canada. The strong economic environment and the high concentration of pharmaceutical and biotechnology companies in these regions further contribute to the market's growth. The European market is also a significant contributor, with growth primarily driven by increasing healthcare spending and a focus on enhancing healthcare infrastructure.
Laboratory Disposable Products Product Developments
Recent years have witnessed significant advancements in laboratory disposable product design, focusing on improved functionality, increased efficiency, and enhanced safety. Innovations include the development of advanced materials with superior biocompatibility, reduced extractables and leachables, and improved sterility assurance. The integration of smart technologies, such as RFID tagging, enables better tracking and inventory management. These innovations cater to the increasing demand for accurate and efficient laboratory procedures, offering significant competitive advantages to manufacturers.
Key Drivers of Laboratory Disposable Products Growth
The growth of the laboratory disposable products market is primarily driven by technological advancements, robust economic conditions, and supportive regulatory frameworks. Increased automation in laboratories necessitates a consistent supply of disposable products. Expanding research and development activities, particularly in the pharmaceutical and biotechnology sectors, directly fuel the market's expansion. Additionally, favorable government policies and investments in healthcare infrastructure contribute to market growth.
Challenges in the Laboratory Disposable Products Market
The laboratory disposable products market faces several challenges, including fluctuations in raw material prices, supply chain disruptions, and intense competition. Stringent regulatory requirements for product quality and safety introduce complexities and costs for manufacturers. Environmental concerns related to plastic waste generation are also driving demand for more sustainable solutions. The overall impact of these challenges is estimated to reduce the annual market growth by approximately xx%.
Emerging Opportunities in Laboratory Disposable Products
Emerging opportunities for growth lie in the increasing demand for personalized medicine, the development of point-of-care diagnostics, and the growing adoption of automation and digitalization in laboratory settings. Strategic partnerships and collaborations between manufacturers and technology providers are crucial for developing innovative products and solutions. The exploration of sustainable and eco-friendly alternatives to traditional plastics is also opening up new avenues for growth.
Leading Players in the Laboratory Disposable Products Sector
- Medline Industries, Inc.
- BD
- McKesson Corporation
- Thermo Fisher Scientific Inc.
- Gerresheimer AG
- PerkinElmer Inc.
- QIAGEN
- Bio-Rad Laboratories, Inc.
- Agilent Technologies, Inc.
- Dynarex Corporation
- Top Glove
- Hartalega
- Kossan
- Ansell
- Semperit
- Supermax
Key Milestones in Laboratory Disposable Products Industry
- 2020: Increased demand for PPE (Personal Protective Equipment) due to the COVID-19 pandemic.
- 2021: Several major players announced investments in expanding their manufacturing capacities to meet rising demand.
- 2022: Introduction of several innovative products incorporating sustainable materials.
- 2023: Significant advancements in automation technologies impacting disposable product design and usage.
Strategic Outlook for Laboratory Disposable Products Market
The future of the laboratory disposable products market appears promising, driven by continued technological advancements, increasing healthcare spending, and the growing need for efficient and accurate laboratory testing. Strategic partnerships and collaborations will play a vital role in driving innovation and market expansion. Focusing on sustainability and the development of eco-friendly products will also be crucial for long-term success in this dynamic market. The projected market size indicates substantial growth potential, making it an attractive sector for investment and expansion.
Laboratory Disposable Products Segmentation
-
1. Application
- 1.1. Hospitals
- 1.2. Research Institutes
- 1.3. Laboratories
- 1.4. Others
-
2. Types
- 2.1. Glass
- 2.2. Plastic
Laboratory Disposable Products Segmentation By Geography
-
1. North America
- 1.1. United States
- 1.2. Canada
- 1.3. Mexico
-
2. South America
- 2.1. Brazil
- 2.2. Argentina
- 2.3. Rest of South America
-
3. Europe
- 3.1. United Kingdom
- 3.2. Germany
- 3.3. France
- 3.4. Italy
- 3.5. Spain
- 3.6. Russia
- 3.7. Benelux
- 3.8. Nordics
- 3.9. Rest of Europe
-
4. Middle East & Africa
- 4.1. Turkey
- 4.2. Israel
- 4.3. GCC
- 4.4. North Africa
- 4.5. South Africa
- 4.6. Rest of Middle East & Africa
-
5. Asia Pacific
- 5.1. China
- 5.2. India
- 5.3. Japan
- 5.4. South Korea
- 5.5. ASEAN
- 5.6. Oceania
- 5.7. Rest of Asia Pacific
Laboratory Disposable Products Regional Market Share
Geographic Coverage of Laboratory Disposable Products
Laboratory Disposable Products REPORT HIGHLIGHTS
| Aspects | Details |
|---|---|
| Study Period | 2020-2034 |
| Base Year | 2025 |
| Estimated Year | 2026 |
| Forecast Period | 2026-2034 |
| Historical Period | 2020-2025 |
| Growth Rate | CAGR of 8.2% from 2020-2034 |
| Segmentation |
|
Table of Contents
- 1. Introduction
- 1.1. Research Scope
- 1.2. Market Segmentation
- 1.3. Research Objective
- 1.4. Definitions and Assumptions
- 2. Executive Summary
- 2.1. Market Snapshot
- 3. Market Dynamics
- 3.1. Market Drivers
- 3.2. Market Restrains
- 3.3. Market Trends
- 3.4. Market Opportunities
- 4. Market Factor Analysis
- 4.1. Porters Five Forces
- 4.1.1. Bargaining Power of Suppliers
- 4.1.2. Bargaining Power of Buyers
- 4.1.3. Threat of New Entrants
- 4.1.4. Threat of Substitutes
- 4.1.5. Competitive Rivalry
- 4.2. PESTEL analysis
- 4.3. BCG Analysis
- 4.3.1. Stars (High Growth, High Market Share)
- 4.3.2. Cash Cows (Low Growth, High Market Share)
- 4.3.3. Question Mark (High Growth, Low Market Share)
- 4.3.4. Dogs (Low Growth, Low Market Share)
- 4.4. Ansoff Matrix Analysis
- 4.5. Supply Chain Analysis
- 4.6. Regulatory Landscape
- 4.7. Current Market Potential and Opportunity Assessment (TAM–SAM–SOM Framework)
- 4.8. MDP Analyst Note
- 4.1. Porters Five Forces
- 5. Market Analysis, Insights and Forecast 2021-2033
- 5.1. Market Analysis, Insights and Forecast - by Application
- 5.1.1. Hospitals
- 5.1.2. Research Institutes
- 5.1.3. Laboratories
- 5.1.4. Others
- 5.2. Market Analysis, Insights and Forecast - by Types
- 5.2.1. Glass
- 5.2.2. Plastic
- 5.3. Market Analysis, Insights and Forecast - by Region
- 5.3.1. North America
- 5.3.2. South America
- 5.3.3. Europe
- 5.3.4. Middle East & Africa
- 5.3.5. Asia Pacific
- 5.1. Market Analysis, Insights and Forecast - by Application
- 6. Global Laboratory Disposable Products Analysis, Insights and Forecast, 2021-2033
- 6.1. Market Analysis, Insights and Forecast - by Application
- 6.1.1. Hospitals
- 6.1.2. Research Institutes
- 6.1.3. Laboratories
- 6.1.4. Others
- 6.2. Market Analysis, Insights and Forecast - by Types
- 6.2.1. Glass
- 6.2.2. Plastic
- 6.1. Market Analysis, Insights and Forecast - by Application
- 7. North America Laboratory Disposable Products Analysis, Insights and Forecast, 2020-2032
- 7.1. Market Analysis, Insights and Forecast - by Application
- 7.1.1. Hospitals
- 7.1.2. Research Institutes
- 7.1.3. Laboratories
- 7.1.4. Others
- 7.2. Market Analysis, Insights and Forecast - by Types
- 7.2.1. Glass
- 7.2.2. Plastic
- 7.1. Market Analysis, Insights and Forecast - by Application
- 8. South America Laboratory Disposable Products Analysis, Insights and Forecast, 2020-2032
- 8.1. Market Analysis, Insights and Forecast - by Application
- 8.1.1. Hospitals
- 8.1.2. Research Institutes
- 8.1.3. Laboratories
- 8.1.4. Others
- 8.2. Market Analysis, Insights and Forecast - by Types
- 8.2.1. Glass
- 8.2.2. Plastic
- 8.1. Market Analysis, Insights and Forecast - by Application
- 9. Europe Laboratory Disposable Products Analysis, Insights and Forecast, 2020-2032
- 9.1. Market Analysis, Insights and Forecast - by Application
- 9.1.1. Hospitals
- 9.1.2. Research Institutes
- 9.1.3. Laboratories
- 9.1.4. Others
- 9.2. Market Analysis, Insights and Forecast - by Types
- 9.2.1. Glass
- 9.2.2. Plastic
- 9.1. Market Analysis, Insights and Forecast - by Application
- 10. Middle East & Africa Laboratory Disposable Products Analysis, Insights and Forecast, 2020-2032
- 10.1. Market Analysis, Insights and Forecast - by Application
- 10.1.1. Hospitals
- 10.1.2. Research Institutes
- 10.1.3. Laboratories
- 10.1.4. Others
- 10.2. Market Analysis, Insights and Forecast - by Types
- 10.2.1. Glass
- 10.2.2. Plastic
- 10.1. Market Analysis, Insights and Forecast - by Application
- 11. Asia Pacific Laboratory Disposable Products Analysis, Insights and Forecast, 2020-2032
- 11.1. Market Analysis, Insights and Forecast - by Application
- 11.1.1. Hospitals
- 11.1.2. Research Institutes
- 11.1.3. Laboratories
- 11.1.4. Others
- 11.2. Market Analysis, Insights and Forecast - by Types
- 11.2.1. Glass
- 11.2.2. Plastic
- 11.1. Market Analysis, Insights and Forecast - by Application
- 12. Competitive Analysis
- 12.1. Company Profiles
- 12.1.1 Medline Industries
- 12.1.1.1. Company Overview
- 12.1.1.2. Products
- 12.1.1.3. Company Financials
- 12.1.1.4. SWOT Analysis
- 12.1.2 Inc.
- 12.1.2.1. Company Overview
- 12.1.2.2. Products
- 12.1.2.3. Company Financials
- 12.1.2.4. SWOT Analysis
- 12.1.3 BD
- 12.1.3.1. Company Overview
- 12.1.3.2. Products
- 12.1.3.3. Company Financials
- 12.1.3.4. SWOT Analysis
- 12.1.4 McKesson Corporation
- 12.1.4.1. Company Overview
- 12.1.4.2. Products
- 12.1.4.3. Company Financials
- 12.1.4.4. SWOT Analysis
- 12.1.5 Thermo Fisher Scientific Inc.
- 12.1.5.1. Company Overview
- 12.1.5.2. Products
- 12.1.5.3. Company Financials
- 12.1.5.4. SWOT Analysis
- 12.1.6 Gerresheimer AG
- 12.1.6.1. Company Overview
- 12.1.6.2. Products
- 12.1.6.3. Company Financials
- 12.1.6.4. SWOT Analysis
- 12.1.7 PerkinElmer Inc.
- 12.1.7.1. Company Overview
- 12.1.7.2. Products
- 12.1.7.3. Company Financials
- 12.1.7.4. SWOT Analysis
- 12.1.8 QIAGEN
- 12.1.8.1. Company Overview
- 12.1.8.2. Products
- 12.1.8.3. Company Financials
- 12.1.8.4. SWOT Analysis
- 12.1.9 Bio-Rad Laboratories
- 12.1.9.1. Company Overview
- 12.1.9.2. Products
- 12.1.9.3. Company Financials
- 12.1.9.4. SWOT Analysis
- 12.1.10 Inc.
- 12.1.10.1. Company Overview
- 12.1.10.2. Products
- 12.1.10.3. Company Financials
- 12.1.10.4. SWOT Analysis
- 12.1.11 Agilent Technologies
- 12.1.11.1. Company Overview
- 12.1.11.2. Products
- 12.1.11.3. Company Financials
- 12.1.11.4. SWOT Analysis
- 12.1.12 Inc.
- 12.1.12.1. Company Overview
- 12.1.12.2. Products
- 12.1.12.3. Company Financials
- 12.1.12.4. SWOT Analysis
- 12.1.13 Dynarex Corporation
- 12.1.13.1. Company Overview
- 12.1.13.2. Products
- 12.1.13.3. Company Financials
- 12.1.13.4. SWOT Analysis
- 12.1.14 Top Glove
- 12.1.14.1. Company Overview
- 12.1.14.2. Products
- 12.1.14.3. Company Financials
- 12.1.14.4. SWOT Analysis
- 12.1.15 Hartalega
- 12.1.15.1. Company Overview
- 12.1.15.2. Products
- 12.1.15.3. Company Financials
- 12.1.15.4. SWOT Analysis
- 12.1.16 Kossan
- 12.1.16.1. Company Overview
- 12.1.16.2. Products
- 12.1.16.3. Company Financials
- 12.1.16.4. SWOT Analysis
- 12.1.17 Ansell
- 12.1.17.1. Company Overview
- 12.1.17.2. Products
- 12.1.17.3. Company Financials
- 12.1.17.4. SWOT Analysis
- 12.1.18 Semperit
- 12.1.18.1. Company Overview
- 12.1.18.2. Products
- 12.1.18.3. Company Financials
- 12.1.18.4. SWOT Analysis
- 12.1.19 Supermax
- 12.1.19.1. Company Overview
- 12.1.19.2. Products
- 12.1.19.3. Company Financials
- 12.1.19.4. SWOT Analysis
- 12.1.1 Medline Industries
- 12.2. Market Entropy
- 12.2.1 Company's Key Areas Served
- 12.2.2 Recent Developments
- 12.3. Company Market Share Analysis 2025
- 12.3.1 Top 5 Companies Market Share Analysis
- 12.3.2 Top 3 Companies Market Share Analysis
- 12.4. List of Potential Customers
- 13. Research Methodology
List of Figures
- Figure 1: Global Laboratory Disposable Products Revenue Breakdown (undefined, %) by Region 2025 & 2033
- Figure 2: North America Laboratory Disposable Products Revenue (undefined), by Application 2025 & 2033
- Figure 3: North America Laboratory Disposable Products Revenue Share (%), by Application 2025 & 2033
- Figure 4: North America Laboratory Disposable Products Revenue (undefined), by Types 2025 & 2033
- Figure 5: North America Laboratory Disposable Products Revenue Share (%), by Types 2025 & 2033
- Figure 6: North America Laboratory Disposable Products Revenue (undefined), by Country 2025 & 2033
- Figure 7: North America Laboratory Disposable Products Revenue Share (%), by Country 2025 & 2033
- Figure 8: South America Laboratory Disposable Products Revenue (undefined), by Application 2025 & 2033
- Figure 9: South America Laboratory Disposable Products Revenue Share (%), by Application 2025 & 2033
- Figure 10: South America Laboratory Disposable Products Revenue (undefined), by Types 2025 & 2033
- Figure 11: South America Laboratory Disposable Products Revenue Share (%), by Types 2025 & 2033
- Figure 12: South America Laboratory Disposable Products Revenue (undefined), by Country 2025 & 2033
- Figure 13: South America Laboratory Disposable Products Revenue Share (%), by Country 2025 & 2033
- Figure 14: Europe Laboratory Disposable Products Revenue (undefined), by Application 2025 & 2033
- Figure 15: Europe Laboratory Disposable Products Revenue Share (%), by Application 2025 & 2033
- Figure 16: Europe Laboratory Disposable Products Revenue (undefined), by Types 2025 & 2033
- Figure 17: Europe Laboratory Disposable Products Revenue Share (%), by Types 2025 & 2033
- Figure 18: Europe Laboratory Disposable Products Revenue (undefined), by Country 2025 & 2033
- Figure 19: Europe Laboratory Disposable Products Revenue Share (%), by Country 2025 & 2033
- Figure 20: Middle East & Africa Laboratory Disposable Products Revenue (undefined), by Application 2025 & 2033
- Figure 21: Middle East & Africa Laboratory Disposable Products Revenue Share (%), by Application 2025 & 2033
- Figure 22: Middle East & Africa Laboratory Disposable Products Revenue (undefined), by Types 2025 & 2033
- Figure 23: Middle East & Africa Laboratory Disposable Products Revenue Share (%), by Types 2025 & 2033
- Figure 24: Middle East & Africa Laboratory Disposable Products Revenue (undefined), by Country 2025 & 2033
- Figure 25: Middle East & Africa Laboratory Disposable Products Revenue Share (%), by Country 2025 & 2033
- Figure 26: Asia Pacific Laboratory Disposable Products Revenue (undefined), by Application 2025 & 2033
- Figure 27: Asia Pacific Laboratory Disposable Products Revenue Share (%), by Application 2025 & 2033
- Figure 28: Asia Pacific Laboratory Disposable Products Revenue (undefined), by Types 2025 & 2033
- Figure 29: Asia Pacific Laboratory Disposable Products Revenue Share (%), by Types 2025 & 2033
- Figure 30: Asia Pacific Laboratory Disposable Products Revenue (undefined), by Country 2025 & 2033
- Figure 31: Asia Pacific Laboratory Disposable Products Revenue Share (%), by Country 2025 & 2033
List of Tables
- Table 1: Global Laboratory Disposable Products Revenue undefined Forecast, by Application 2020 & 2033
- Table 2: Global Laboratory Disposable Products Revenue undefined Forecast, by Types 2020 & 2033
- Table 3: Global Laboratory Disposable Products Revenue undefined Forecast, by Region 2020 & 2033
- Table 4: Global Laboratory Disposable Products Revenue undefined Forecast, by Application 2020 & 2033
- Table 5: Global Laboratory Disposable Products Revenue undefined Forecast, by Types 2020 & 2033
- Table 6: Global Laboratory Disposable Products Revenue undefined Forecast, by Country 2020 & 2033
- Table 7: United States Laboratory Disposable Products Revenue (undefined) Forecast, by Application 2020 & 2033
- Table 8: Canada Laboratory Disposable Products Revenue (undefined) Forecast, by Application 2020 & 2033
- Table 9: Mexico Laboratory Disposable Products Revenue (undefined) Forecast, by Application 2020 & 2033
- Table 10: Global Laboratory Disposable Products Revenue undefined Forecast, by Application 2020 & 2033
- Table 11: Global Laboratory Disposable Products Revenue undefined Forecast, by Types 2020 & 2033
- Table 12: Global Laboratory Disposable Products Revenue undefined Forecast, by Country 2020 & 2033
- Table 13: Brazil Laboratory Disposable Products Revenue (undefined) Forecast, by Application 2020 & 2033
- Table 14: Argentina Laboratory Disposable Products Revenue (undefined) Forecast, by Application 2020 & 2033
- Table 15: Rest of South America Laboratory Disposable Products Revenue (undefined) Forecast, by Application 2020 & 2033
- Table 16: Global Laboratory Disposable Products Revenue undefined Forecast, by Application 2020 & 2033
- Table 17: Global Laboratory Disposable Products Revenue undefined Forecast, by Types 2020 & 2033
- Table 18: Global Laboratory Disposable Products Revenue undefined Forecast, by Country 2020 & 2033
- Table 19: United Kingdom Laboratory Disposable Products Revenue (undefined) Forecast, by Application 2020 & 2033
- Table 20: Germany Laboratory Disposable Products Revenue (undefined) Forecast, by Application 2020 & 2033
- Table 21: France Laboratory Disposable Products Revenue (undefined) Forecast, by Application 2020 & 2033
- Table 22: Italy Laboratory Disposable Products Revenue (undefined) Forecast, by Application 2020 & 2033
- Table 23: Spain Laboratory Disposable Products Revenue (undefined) Forecast, by Application 2020 & 2033
- Table 24: Russia Laboratory Disposable Products Revenue (undefined) Forecast, by Application 2020 & 2033
- Table 25: Benelux Laboratory Disposable Products Revenue (undefined) Forecast, by Application 2020 & 2033
- Table 26: Nordics Laboratory Disposable Products Revenue (undefined) Forecast, by Application 2020 & 2033
- Table 27: Rest of Europe Laboratory Disposable Products Revenue (undefined) Forecast, by Application 2020 & 2033
- Table 28: Global Laboratory Disposable Products Revenue undefined Forecast, by Application 2020 & 2033
- Table 29: Global Laboratory Disposable Products Revenue undefined Forecast, by Types 2020 & 2033
- Table 30: Global Laboratory Disposable Products Revenue undefined Forecast, by Country 2020 & 2033
- Table 31: Turkey Laboratory Disposable Products Revenue (undefined) Forecast, by Application 2020 & 2033
- Table 32: Israel Laboratory Disposable Products Revenue (undefined) Forecast, by Application 2020 & 2033
- Table 33: GCC Laboratory Disposable Products Revenue (undefined) Forecast, by Application 2020 & 2033
- Table 34: North Africa Laboratory Disposable Products Revenue (undefined) Forecast, by Application 2020 & 2033
- Table 35: South Africa Laboratory Disposable Products Revenue (undefined) Forecast, by Application 2020 & 2033
- Table 36: Rest of Middle East & Africa Laboratory Disposable Products Revenue (undefined) Forecast, by Application 2020 & 2033
- Table 37: Global Laboratory Disposable Products Revenue undefined Forecast, by Application 2020 & 2033
- Table 38: Global Laboratory Disposable Products Revenue undefined Forecast, by Types 2020 & 2033
- Table 39: Global Laboratory Disposable Products Revenue undefined Forecast, by Country 2020 & 2033
- Table 40: China Laboratory Disposable Products Revenue (undefined) Forecast, by Application 2020 & 2033
- Table 41: India Laboratory Disposable Products Revenue (undefined) Forecast, by Application 2020 & 2033
- Table 42: Japan Laboratory Disposable Products Revenue (undefined) Forecast, by Application 2020 & 2033
- Table 43: South Korea Laboratory Disposable Products Revenue (undefined) Forecast, by Application 2020 & 2033
- Table 44: ASEAN Laboratory Disposable Products Revenue (undefined) Forecast, by Application 2020 & 2033
- Table 45: Oceania Laboratory Disposable Products Revenue (undefined) Forecast, by Application 2020 & 2033
- Table 46: Rest of Asia Pacific Laboratory Disposable Products Revenue (undefined) Forecast, by Application 2020 & 2033
Frequently Asked Questions
1. What is the projected Compound Annual Growth Rate (CAGR) of the Laboratory Disposable Products?
The projected CAGR is approximately 8.2%.
2. Which companies are prominent players in the Laboratory Disposable Products?
Key companies in the market include Medline Industries, Inc., BD, McKesson Corporation, Thermo Fisher Scientific Inc., Gerresheimer AG, PerkinElmer Inc., QIAGEN, Bio-Rad Laboratories, Inc., Agilent Technologies, Inc., Dynarex Corporation, Top Glove, Hartalega, Kossan, Ansell, Semperit, Supermax.
3. What are the main segments of the Laboratory Disposable Products?
The market segments include Application, Types.
4. Can you provide details about the market size?
The market size is estimated to be USD XXX N/A as of 2022.
5. What are some drivers contributing to market growth?
N/A
6. What are the notable trends driving market growth?
N/A
7. Are there any restraints impacting market growth?
N/A
8. Can you provide examples of recent developments in the market?
N/A
9. What pricing options are available for accessing the report?
Pricing options include single-user, multi-user, and enterprise licenses priced at USD 2900.00, USD 4350.00, and USD 5800.00 respectively.
10. Is the market size provided in terms of value or volume?
The market size is provided in terms of value, measured in N/A.
11. Are there any specific market keywords associated with the report?
Yes, the market keyword associated with the report is "Laboratory Disposable Products," which aids in identifying and referencing the specific market segment covered.
12. How do I determine which pricing option suits my needs best?
The pricing options vary based on user requirements and access needs. Individual users may opt for single-user licenses, while businesses requiring broader access may choose multi-user or enterprise licenses for cost-effective access to the report.
13. Are there any additional resources or data provided in the Laboratory Disposable Products report?
While the report offers comprehensive insights, it's advisable to review the specific contents or supplementary materials provided to ascertain if additional resources or data are available.
14. How can I stay updated on further developments or reports in the Laboratory Disposable Products?
To stay informed about further developments, trends, and reports in the Laboratory Disposable Products, consider subscribing to industry newsletters, following relevant companies and organizations, or regularly checking reputable industry news sources and publications.
Methodology
Step 1 - Identification of Relevant Samples Size from Population Database


Step 2 - Approaches for Defining Global Market Size (Value, Volume* & Price*)

Note*: In applicable scenarios
Step 3 - Data Sources
Primary Research
- Web Analytics
- Survey Reports
- Research Institute
- Latest Research Reports
- Opinion Leaders
Secondary Research
- Annual Reports
- White Paper
- Latest Press Release
- Industry Association
- Paid Database
- Investor Presentations

Step 4 - Data Triangulation
Involves using different sources of information in order to increase the validity of a study
These sources are likely to be stakeholders in a program - participants, other researchers, program staff, other community members, and so on.
Then we put all data in single framework & apply various statistical tools to find out the dynamic on the market.
During the analysis stage, feedback from the stakeholder groups would be compared to determine areas of agreement as well as areas of divergence