

Key Insights
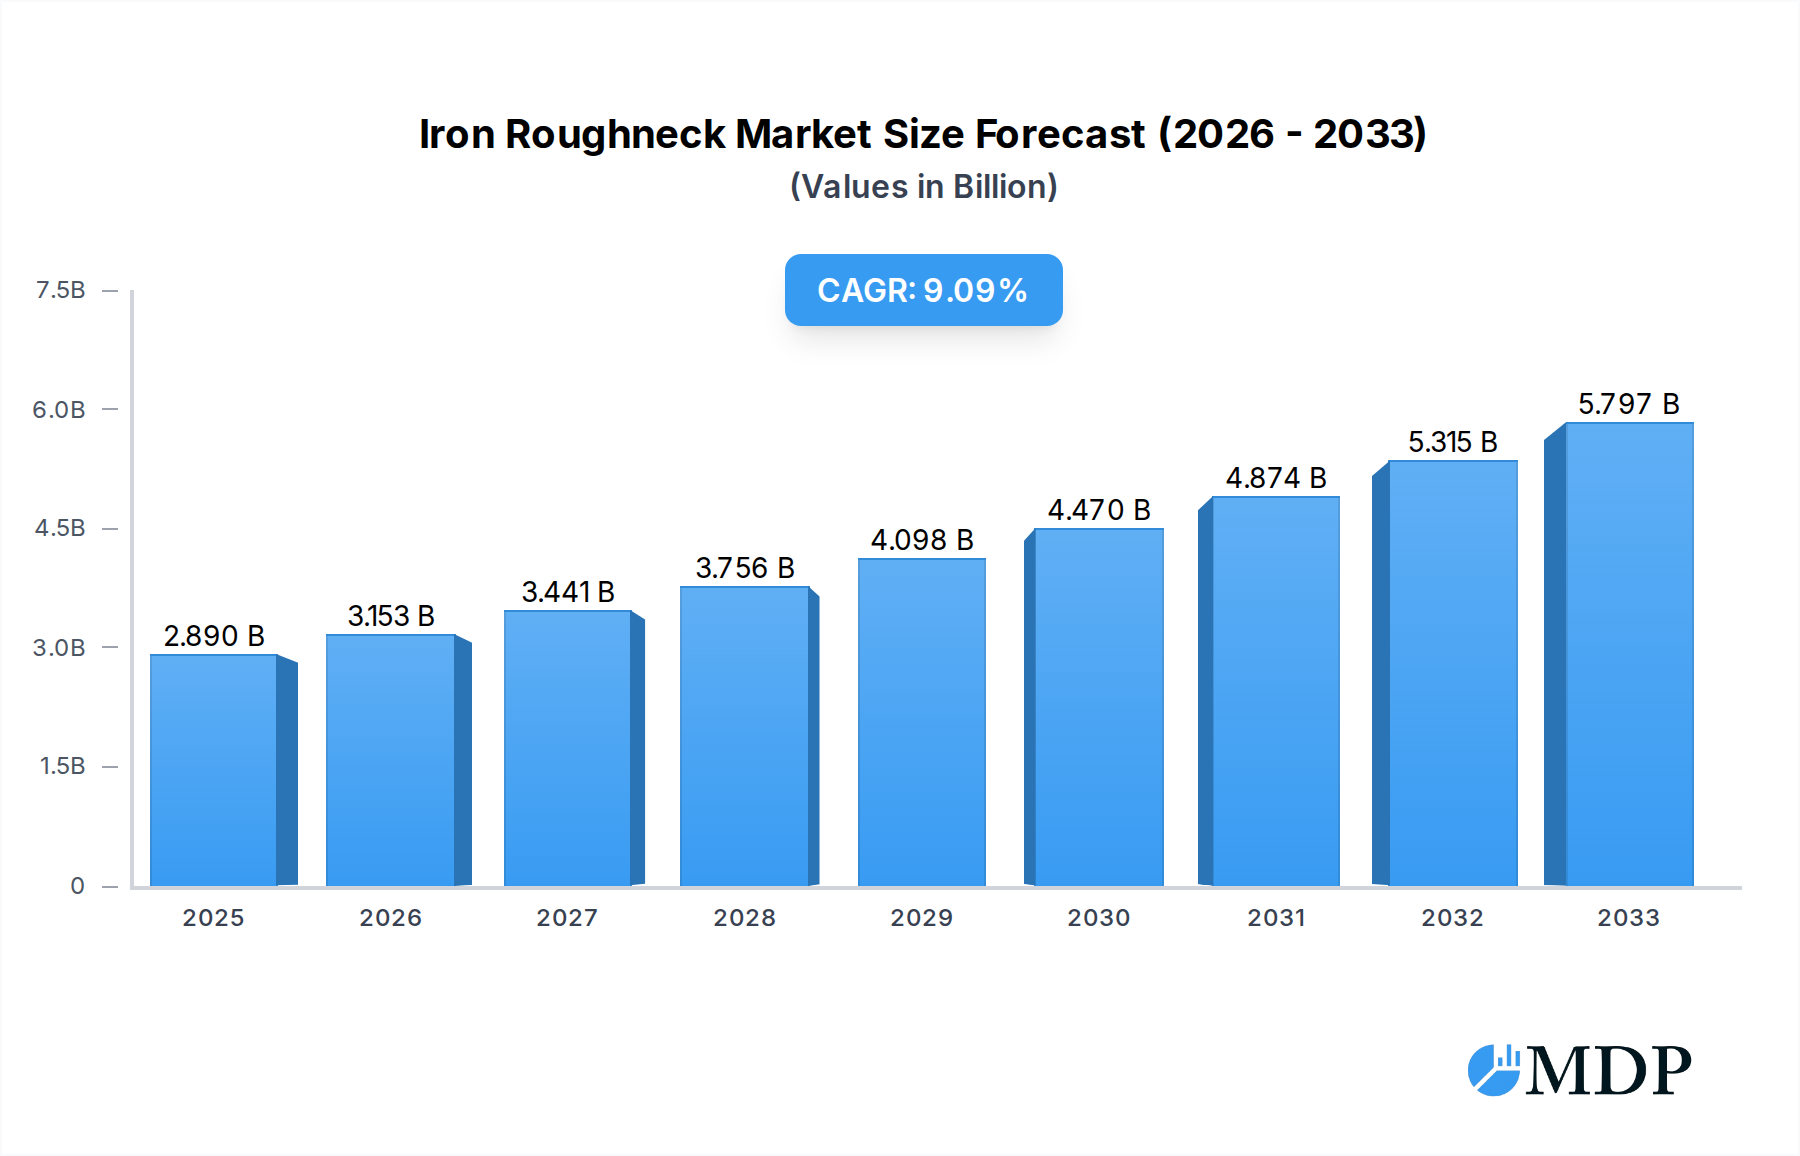
The global Iron Roughneck market is poised for substantial expansion, projected to reach an estimated USD 2.89 billion by 2025. This growth is fueled by an anticipated Compound Annual Growth Rate (CAGR) of 9.2% throughout the forecast period (2025-2033). A primary driver for this upward trajectory is the increasing global demand for energy, necessitating intensified exploration and production activities, particularly in offshore and deep-water environments. Advances in drilling technology, focusing on efficiency and safety, are also contributing significantly, with Iron Roughnecks playing a crucial role in automating and optimizing pipe handling operations. Furthermore, the ongoing development of new oil and gas fields, coupled with the reactivation of mature fields requiring enhanced recovery methods, will sustain the demand for these essential drilling equipment components. The market’s expansion is also bolstered by ongoing investments in oil and gas infrastructure, especially in emerging economies with growing energy needs.

Iron Roughneck Market Size (In Billion)
The Iron Roughneck market is segmented into Onshore Drilling and Offshore Drilling applications, with Offshore Drilling expected to exhibit stronger growth due to the increasing complexity and depth of offshore operations. Within types, Telescopic Arm and Rail Type Iron Roughnecks cater to diverse operational requirements and environmental conditions. Key market players like NOV Inc., SANY Group, and Honghua Group Limited are actively engaged in product innovation and strategic collaborations to capture market share. While the market benefits from robust demand drivers, potential restraints such as volatile oil prices and increasing environmental regulations could pose challenges. However, the persistent need for efficient and safe drilling operations, coupled with technological advancements in automation and digitalization within the oil and gas sector, are expected to largely mitigate these concerns, ensuring a positive growth outlook for the Iron Roughneck market.
Iron Roughneck Company Market Share
Comprehensive Iron Roughneck Market Report: Navigating a Billion-Dollar Sector (2019-2033)
This in-depth report provides a panoramic view of the global Iron Roughneck market, a critical component in the oil and gas industry. Delving into market dynamics, growth drivers, leading players, and future trajectories, this analysis is essential for stakeholders seeking to understand and capitalize on opportunities within this billion-dollar sector. Spanning a study period from 2019 to 2033, with a base year of 2025, the report offers actionable insights derived from historical data (2019-2024) and robust forecasts for the period 2025-2033.
Iron Roughneck Market Dynamics & Concentration
The Iron Roughneck market, projected to reach billions in value, exhibits a dynamic and evolving concentration landscape. Key innovation drivers include the relentless pursuit of operational efficiency, enhanced safety protocols, and automation in drilling operations. Regulatory frameworks, particularly those concerning environmental impact and worker safety, are increasingly influencing product design and market entry. Product substitutes, while limited in directly replicating the integrated functionality of iron roughnecks, include manual handling and simpler automated systems, though their efficacy and safety in high-demand scenarios are significantly lower. End-user trends highlight a strong preference for robust, reliable, and technologically advanced iron roughnecks that reduce human intervention and minimize downtime. Merger and acquisition (M&A) activities are prevalent as larger entities seek to consolidate market share, acquire innovative technologies, and expand their global footprint. We anticipate approximately [XX] significant M&A deals in the forecast period. Market share distribution is relatively concentrated among key players, with the top [X] companies holding an estimated [XX]% of the global market by value.
Iron Roughneck Industry Trends & Analysis
The Iron Roughneck industry is experiencing robust growth, driven by the ever-increasing demand for energy globally and the continuous exploration and production of oil and gas reserves. The market is projected to expand at a Compound Annual Growth Rate (CAGR) of approximately [XX]% from 2025 to 2033. Technological disruptions are at the forefront, with advancements in robotics, artificial intelligence (AI), and the Industrial Internet of Things (IIoT) enabling more sophisticated and automated iron roughneck systems. These innovations are crucial for enhancing operational efficiency, reducing the risk of human error, and improving safety standards in challenging drilling environments. Consumer preferences are shifting towards intelligent, self-diagnostic, and remotely operable iron roughnecks that offer predictive maintenance capabilities and real-time performance monitoring. This trend is particularly pronounced in the offshore drilling segment, where accessibility and environmental conditions necessitate high levels of automation and reliability. Competitive dynamics are characterized by intense innovation, strategic partnerships, and a focus on cost-effectiveness without compromising performance. Market penetration is expected to deepen significantly, especially in emerging markets with growing upstream activities. The integration of advanced sensor technologies and data analytics is further enhancing the value proposition of iron roughnecks, making them indispensable tools for modern drilling operations. The increasing emphasis on energy security and the sustained exploration of both conventional and unconventional hydrocarbon resources will continue to fuel the demand for these essential drilling equipment.
Leading Markets & Segments in Iron Roughneck
The Onshore Drilling application segment currently dominates the global Iron Roughneck market, driven by extensive exploration and production activities in key regions like North America, the Middle East, and Asia-Pacific. This dominance is underpinned by the sheer volume of onshore wells drilled globally and the increasing adoption of advanced drilling technologies to optimize extraction. Within the application segments, Onshore Drilling accounts for an estimated [XX]% of the market share in 2025.
Telescopic Arm type iron roughnecks are also leading the market due to their versatility and adaptability to various well configurations, offering enhanced reach and maneuverability. This type is particularly favored in complex onshore operations. The market share for Telescopic Arm type is estimated to be around [XX]% of the total market.
Dominance Drivers in Onshore Drilling:
- Economic Policies: Favorable government policies and incentives for domestic oil and gas production in countries like the United States and Saudi Arabia significantly boost onshore drilling activities.
- Infrastructure Development: Extensive existing and developing infrastructure in onshore regions facilitates easier deployment and operation of iron roughnecks.
- Technological Advancements: The integration of automation and robotics in onshore drilling enhances efficiency and safety, making advanced iron roughnecks a necessity.
- Cost-Effectiveness: While initial investment can be high, the long-term cost savings through reduced labor and increased operational uptime make onshore iron roughnecks a sound investment.
Dominance Drivers for Telescopic Arm Type:
- Versatility: The ability to adjust reach and angle makes telescopic arm iron roughnecks suitable for a wide range of drilling setups.
- Space Efficiency: Their design often allows for more compact rig configurations, which is crucial in space-constrained onshore locations.
- Safety Enhancements: Improved reach and control minimize human exposure to hazardous drilling operations.
The Offshore Drilling segment, while currently holding a smaller market share, is projected for substantial growth. This is attributed to the increasing necessity of exploring deeper and more challenging offshore reserves to meet future energy demands. As offshore exploration intensifies, the demand for highly robust and sophisticated iron roughnecks capable of withstanding harsh environments will surge.
The Rail Type iron roughnecks are gaining traction, particularly in offshore environments and large-scale onshore projects, due to their stability and high load-bearing capacity. Their precise movement along tracks ensures consistent and accurate pipe handling.
Iron Roughneck Product Developments
Product developments in the Iron Roughneck sector are characterized by a strong focus on enhancing automation, safety, and efficiency. Innovations include the integration of AI-powered predictive maintenance, advanced sensor arrays for real-time operational monitoring, and the development of lighter yet more robust materials. These advancements offer significant competitive advantages by reducing operational costs, minimizing downtime, and improving worker safety. The trend towards modular and adaptable designs also allows for easier deployment and customization for diverse drilling scenarios, catering to both onshore and offshore applications with improved market fit.
Key Drivers of Iron Roughneck Growth
Several key drivers are propelling the growth of the Iron Roughneck market. Technologically, the increasing demand for automation and remote operation in oil and gas exploration is paramount. Economically, sustained global energy demand and the exploration of new hydrocarbon reserves, including unconventional resources, are crucial. Regulatory factors, such as stricter safety standards and environmental regulations, are pushing manufacturers to develop more advanced and safer iron roughneck solutions. For instance, the growing emphasis on reducing human exposure to hazardous drilling environments directly translates to a higher demand for sophisticated iron roughnecks that can perform complex tasks autonomously.
Challenges in the Iron Roughneck Market
Despite the promising growth, the Iron Roughneck market faces several challenges. Regulatory hurdles, particularly in obtaining permits for new technologies and operations in environmentally sensitive areas, can slow down market expansion. Supply chain issues, including the availability of specialized components and skilled labor, can impact production timelines and costs. Competitive pressures from established players and emerging innovators necessitate continuous investment in research and development. Furthermore, the substantial initial capital investment required for advanced iron roughneck systems can be a barrier for some smaller operators, potentially limiting market penetration in certain segments. The fluctuating prices of crude oil can also impact exploration budgets, indirectly affecting demand.
Emerging Opportunities in Iron Roughneck
Emerging opportunities in the Iron Roughneck market are primarily driven by technological breakthroughs and strategic market expansion. The increasing adoption of digitalization and AI in the oil and gas sector presents a significant opportunity for the development of "smart" iron roughnecks with enhanced analytical capabilities and remote control features. Strategic partnerships between technology providers and drilling contractors are crucial for co-developing customized solutions that address specific operational challenges. Furthermore, the growing exploration activities in frontier regions and the demand for optimized production in mature fields offer substantial market expansion potential for innovative and efficient iron roughneck systems. The drive towards sustainable energy also presents an indirect opportunity by ensuring the continued need for efficient extraction of existing fossil fuel reserves during the energy transition.
Leading Players in the Iron Roughneck Sector
- Beijing JJC Petroleum Equipment Co.,Ltd
- SANY Group
- Honghua Group Limited
- Sichuan L/G Oilfield Equipment,Ltd
- Jiangsu Rushi Machinery Co.,Ltd.
- Liaoning Tianyi
- NOV Inc.
- Jiangyi
- Baoji Petroleum Machinery Co.,Ltd.
Key Milestones in Iron Roughneck Industry
- 2019: Introduction of AI-powered anomaly detection in iron roughneck operations, enhancing predictive maintenance.
- 2020: Development of lighter composite materials for iron roughneck arms, improving energy efficiency.
- 2021: Increased integration of IoT sensors for real-time remote monitoring and control across major manufacturers.
- 2022: Launch of highly automated, modular iron roughneck systems designed for rapid deployment in diverse environments.
- 2023: Significant advancements in robotic pipe handling, reducing manual intervention to near zero in certain operations.
- 2024: Growing adoption of digital twins for iron roughneck simulation and optimization in training and operations.
Strategic Outlook for Iron Roughneck Market
The strategic outlook for the Iron Roughneck market is exceptionally strong, fueled by the continuous drive for enhanced efficiency, safety, and automation in the oil and gas industry. Growth accelerators include the accelerating adoption of Industry 4.0 technologies, such as AI and IIoT, which will enable the development of highly intelligent and self-optimizing iron roughneck systems. Strategic partnerships and collaborations will be vital for innovation and market penetration, particularly in emerging offshore exploration frontiers. The market is poised for sustained expansion as companies prioritize investments in advanced drilling equipment to reduce operational costs, improve safety records, and maximize hydrocarbon recovery in an increasingly competitive global energy landscape.
Iron Roughneck Segmentation
-
1. Application
- 1.1. Onshore Drilling
- 1.2. Offshore Drilling
-
2. Types
- 2.1. Telescopic Arm
- 2.2. Rail Type
Iron Roughneck Segmentation By Geography
-
1. North America
- 1.1. United States
- 1.2. Canada
- 1.3. Mexico
-
2. South America
- 2.1. Brazil
- 2.2. Argentina
- 2.3. Rest of South America
-
3. Europe
- 3.1. United Kingdom
- 3.2. Germany
- 3.3. France
- 3.4. Italy
- 3.5. Spain
- 3.6. Russia
- 3.7. Benelux
- 3.8. Nordics
- 3.9. Rest of Europe
-
4. Middle East & Africa
- 4.1. Turkey
- 4.2. Israel
- 4.3. GCC
- 4.4. North Africa
- 4.5. South Africa
- 4.6. Rest of Middle East & Africa
-
5. Asia Pacific
- 5.1. China
- 5.2. India
- 5.3. Japan
- 5.4. South Korea
- 5.5. ASEAN
- 5.6. Oceania
- 5.7. Rest of Asia Pacific
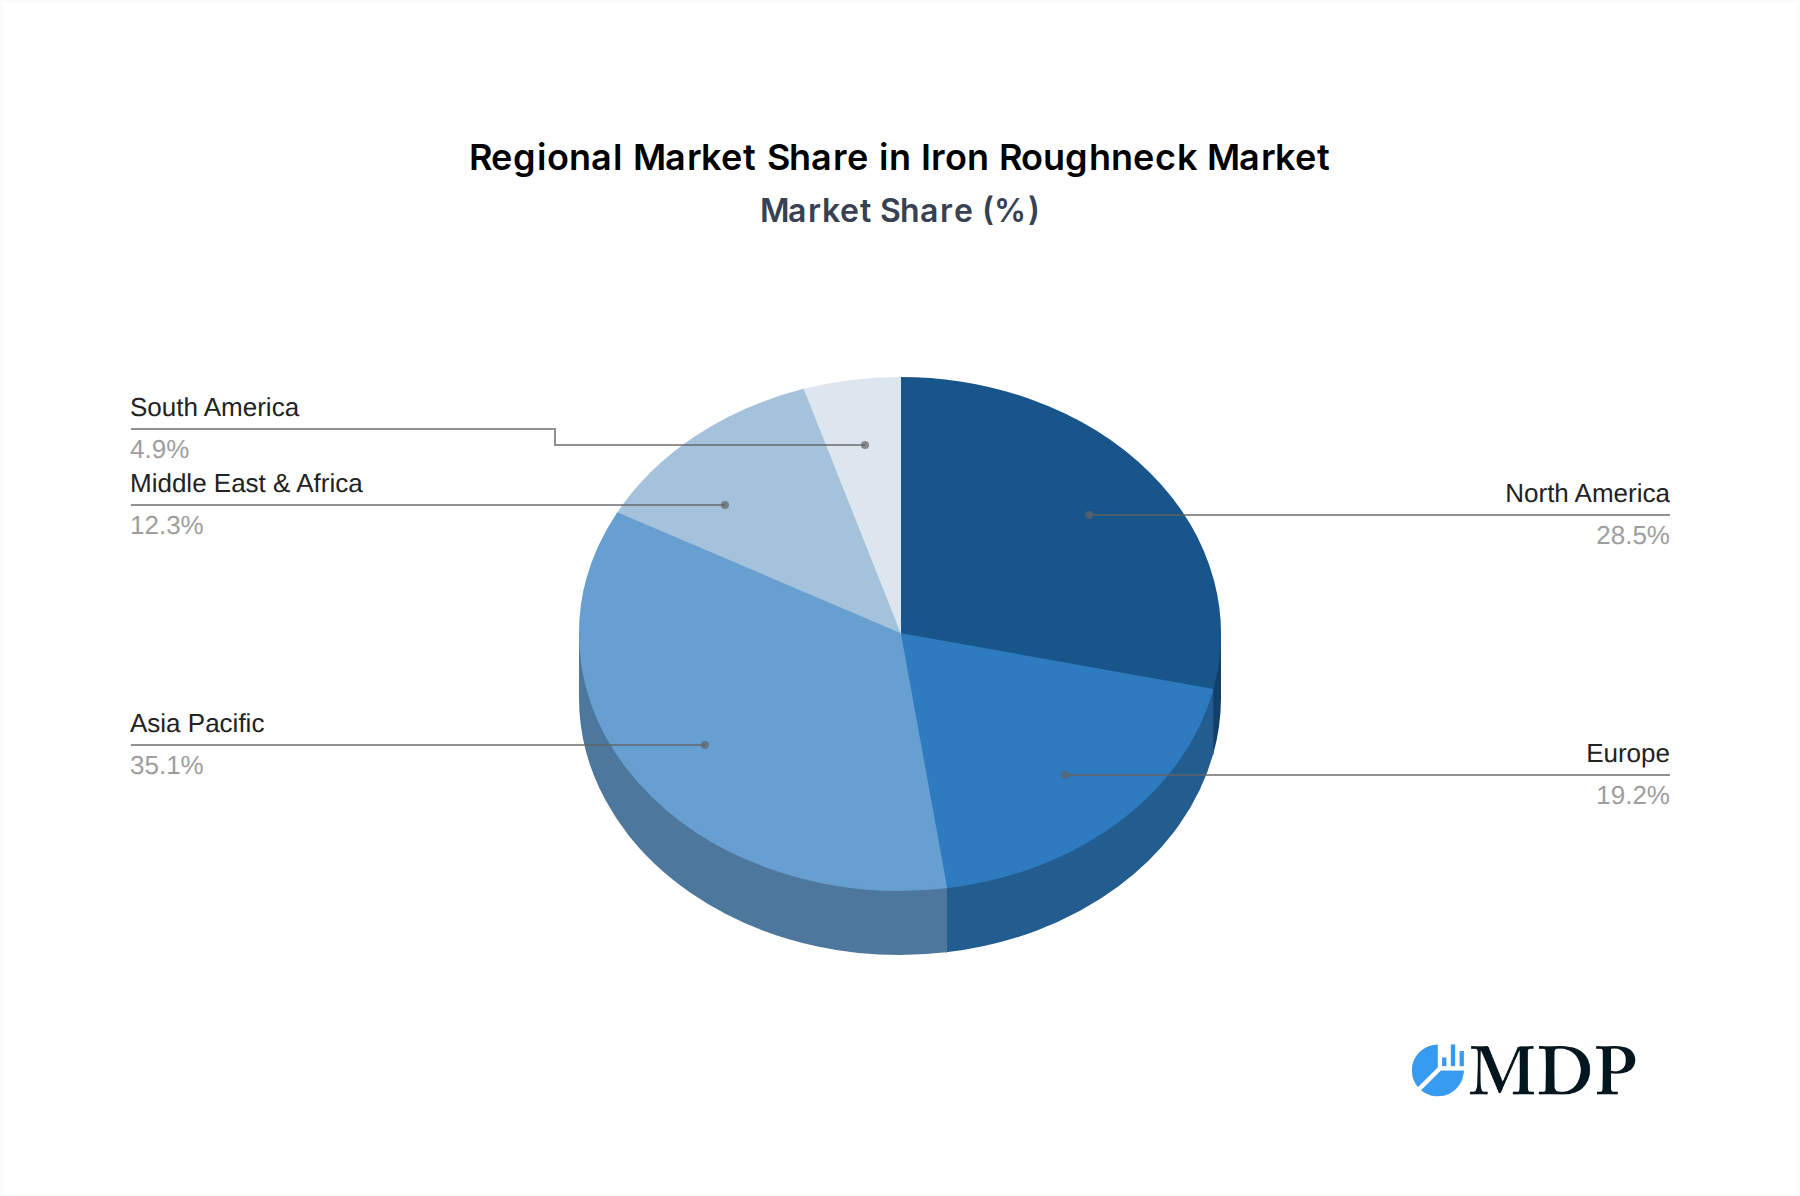
Iron Roughneck Regional Market Share
Geographic Coverage of Iron Roughneck
Iron Roughneck REPORT HIGHLIGHTS
| Aspects | Details |
|---|---|
| Study Period | 2020-2034 |
| Base Year | 2025 |
| Estimated Year | 2026 |
| Forecast Period | 2026-2034 |
| Historical Period | 2020-2025 |
| Growth Rate | CAGR of 9.2% from 2020-2034 |
| Segmentation |
|
Table of Contents
- 1. Introduction
- 1.1. Research Scope
- 1.2. Market Segmentation
- 1.3. Research Methodology
- 1.4. Definitions and Assumptions
- 2. Executive Summary
- 2.1. Introduction
- 3. Market Dynamics
- 3.1. Introduction
- 3.2. Market Drivers
- 3.3. Market Restrains
- 3.4. Market Trends
- 4. Market Factor Analysis
- 4.1. Porters Five Forces
- 4.2. Supply/Value Chain
- 4.3. PESTEL analysis
- 4.4. Market Entropy
- 4.5. Patent/Trademark Analysis
- 5. Global Iron Roughneck Analysis, Insights and Forecast, 2020-2032
- 5.1. Market Analysis, Insights and Forecast - by Application
- 5.1.1. Onshore Drilling
- 5.1.2. Offshore Drilling
- 5.2. Market Analysis, Insights and Forecast - by Types
- 5.2.1. Telescopic Arm
- 5.2.2. Rail Type
- 5.3. Market Analysis, Insights and Forecast - by Region
- 5.3.1. North America
- 5.3.2. South America
- 5.3.3. Europe
- 5.3.4. Middle East & Africa
- 5.3.5. Asia Pacific
- 5.1. Market Analysis, Insights and Forecast - by Application
- 6. North America Iron Roughneck Analysis, Insights and Forecast, 2020-2032
- 6.1. Market Analysis, Insights and Forecast - by Application
- 6.1.1. Onshore Drilling
- 6.1.2. Offshore Drilling
- 6.2. Market Analysis, Insights and Forecast - by Types
- 6.2.1. Telescopic Arm
- 6.2.2. Rail Type
- 6.1. Market Analysis, Insights and Forecast - by Application
- 7. South America Iron Roughneck Analysis, Insights and Forecast, 2020-2032
- 7.1. Market Analysis, Insights and Forecast - by Application
- 7.1.1. Onshore Drilling
- 7.1.2. Offshore Drilling
- 7.2. Market Analysis, Insights and Forecast - by Types
- 7.2.1. Telescopic Arm
- 7.2.2. Rail Type
- 7.1. Market Analysis, Insights and Forecast - by Application
- 8. Europe Iron Roughneck Analysis, Insights and Forecast, 2020-2032
- 8.1. Market Analysis, Insights and Forecast - by Application
- 8.1.1. Onshore Drilling
- 8.1.2. Offshore Drilling
- 8.2. Market Analysis, Insights and Forecast - by Types
- 8.2.1. Telescopic Arm
- 8.2.2. Rail Type
- 8.1. Market Analysis, Insights and Forecast - by Application
- 9. Middle East & Africa Iron Roughneck Analysis, Insights and Forecast, 2020-2032
- 9.1. Market Analysis, Insights and Forecast - by Application
- 9.1.1. Onshore Drilling
- 9.1.2. Offshore Drilling
- 9.2. Market Analysis, Insights and Forecast - by Types
- 9.2.1. Telescopic Arm
- 9.2.2. Rail Type
- 9.1. Market Analysis, Insights and Forecast - by Application
- 10. Asia Pacific Iron Roughneck Analysis, Insights and Forecast, 2020-2032
- 10.1. Market Analysis, Insights and Forecast - by Application
- 10.1.1. Onshore Drilling
- 10.1.2. Offshore Drilling
- 10.2. Market Analysis, Insights and Forecast - by Types
- 10.2.1. Telescopic Arm
- 10.2.2. Rail Type
- 10.1. Market Analysis, Insights and Forecast - by Application
- 11. Competitive Analysis
- 11.1. Global Market Share Analysis 2025
- 11.2. Company Profiles
- 11.2.1 Beijing JJC Petroleum Equipment Co.
- 11.2.1.1. Overview
- 11.2.1.2. Products
- 11.2.1.3. SWOT Analysis
- 11.2.1.4. Recent Developments
- 11.2.1.5. Financials (Based on Availability)
- 11.2.2 Ltd
- 11.2.2.1. Overview
- 11.2.2.2. Products
- 11.2.2.3. SWOT Analysis
- 11.2.2.4. Recent Developments
- 11.2.2.5. Financials (Based on Availability)
- 11.2.3 SANY Group
- 11.2.3.1. Overview
- 11.2.3.2. Products
- 11.2.3.3. SWOT Analysis
- 11.2.3.4. Recent Developments
- 11.2.3.5. Financials (Based on Availability)
- 11.2.4 Honghua Group Limited
- 11.2.4.1. Overview
- 11.2.4.2. Products
- 11.2.4.3. SWOT Analysis
- 11.2.4.4. Recent Developments
- 11.2.4.5. Financials (Based on Availability)
- 11.2.5 Sichuan L/G Oilfield Equipment
- 11.2.5.1. Overview
- 11.2.5.2. Products
- 11.2.5.3. SWOT Analysis
- 11.2.5.4. Recent Developments
- 11.2.5.5. Financials (Based on Availability)
- 11.2.6 Ltd
- 11.2.6.1. Overview
- 11.2.6.2. Products
- 11.2.6.3. SWOT Analysis
- 11.2.6.4. Recent Developments
- 11.2.6.5. Financials (Based on Availability)
- 11.2.7 Jiangsu Rushi Machinery Co.
- 11.2.7.1. Overview
- 11.2.7.2. Products
- 11.2.7.3. SWOT Analysis
- 11.2.7.4. Recent Developments
- 11.2.7.5. Financials (Based on Availability)
- 11.2.8 Ltd.
- 11.2.8.1. Overview
- 11.2.8.2. Products
- 11.2.8.3. SWOT Analysis
- 11.2.8.4. Recent Developments
- 11.2.8.5. Financials (Based on Availability)
- 11.2.9 Liaoning Tianyi
- 11.2.9.1. Overview
- 11.2.9.2. Products
- 11.2.9.3. SWOT Analysis
- 11.2.9.4. Recent Developments
- 11.2.9.5. Financials (Based on Availability)
- 11.2.10 NOV Inc.
- 11.2.10.1. Overview
- 11.2.10.2. Products
- 11.2.10.3. SWOT Analysis
- 11.2.10.4. Recent Developments
- 11.2.10.5. Financials (Based on Availability)
- 11.2.11 Jiangyi
- 11.2.11.1. Overview
- 11.2.11.2. Products
- 11.2.11.3. SWOT Analysis
- 11.2.11.4. Recent Developments
- 11.2.11.5. Financials (Based on Availability)
- 11.2.12 Baoji Petroleum Machinery Co.
- 11.2.12.1. Overview
- 11.2.12.2. Products
- 11.2.12.3. SWOT Analysis
- 11.2.12.4. Recent Developments
- 11.2.12.5. Financials (Based on Availability)
- 11.2.13 Ltd.
- 11.2.13.1. Overview
- 11.2.13.2. Products
- 11.2.13.3. SWOT Analysis
- 11.2.13.4. Recent Developments
- 11.2.13.5. Financials (Based on Availability)
- 11.2.1 Beijing JJC Petroleum Equipment Co.
List of Figures
- Figure 1: Global Iron Roughneck Revenue Breakdown (undefined, %) by Region 2025 & 2033
- Figure 2: North America Iron Roughneck Revenue (undefined), by Application 2025 & 2033
- Figure 3: North America Iron Roughneck Revenue Share (%), by Application 2025 & 2033
- Figure 4: North America Iron Roughneck Revenue (undefined), by Types 2025 & 2033
- Figure 5: North America Iron Roughneck Revenue Share (%), by Types 2025 & 2033
- Figure 6: North America Iron Roughneck Revenue (undefined), by Country 2025 & 2033
- Figure 7: North America Iron Roughneck Revenue Share (%), by Country 2025 & 2033
- Figure 8: South America Iron Roughneck Revenue (undefined), by Application 2025 & 2033
- Figure 9: South America Iron Roughneck Revenue Share (%), by Application 2025 & 2033
- Figure 10: South America Iron Roughneck Revenue (undefined), by Types 2025 & 2033
- Figure 11: South America Iron Roughneck Revenue Share (%), by Types 2025 & 2033
- Figure 12: South America Iron Roughneck Revenue (undefined), by Country 2025 & 2033
- Figure 13: South America Iron Roughneck Revenue Share (%), by Country 2025 & 2033
- Figure 14: Europe Iron Roughneck Revenue (undefined), by Application 2025 & 2033
- Figure 15: Europe Iron Roughneck Revenue Share (%), by Application 2025 & 2033
- Figure 16: Europe Iron Roughneck Revenue (undefined), by Types 2025 & 2033
- Figure 17: Europe Iron Roughneck Revenue Share (%), by Types 2025 & 2033
- Figure 18: Europe Iron Roughneck Revenue (undefined), by Country 2025 & 2033
- Figure 19: Europe Iron Roughneck Revenue Share (%), by Country 2025 & 2033
- Figure 20: Middle East & Africa Iron Roughneck Revenue (undefined), by Application 2025 & 2033
- Figure 21: Middle East & Africa Iron Roughneck Revenue Share (%), by Application 2025 & 2033
- Figure 22: Middle East & Africa Iron Roughneck Revenue (undefined), by Types 2025 & 2033
- Figure 23: Middle East & Africa Iron Roughneck Revenue Share (%), by Types 2025 & 2033
- Figure 24: Middle East & Africa Iron Roughneck Revenue (undefined), by Country 2025 & 2033
- Figure 25: Middle East & Africa Iron Roughneck Revenue Share (%), by Country 2025 & 2033
- Figure 26: Asia Pacific Iron Roughneck Revenue (undefined), by Application 2025 & 2033
- Figure 27: Asia Pacific Iron Roughneck Revenue Share (%), by Application 2025 & 2033
- Figure 28: Asia Pacific Iron Roughneck Revenue (undefined), by Types 2025 & 2033
- Figure 29: Asia Pacific Iron Roughneck Revenue Share (%), by Types 2025 & 2033
- Figure 30: Asia Pacific Iron Roughneck Revenue (undefined), by Country 2025 & 2033
- Figure 31: Asia Pacific Iron Roughneck Revenue Share (%), by Country 2025 & 2033
List of Tables
- Table 1: Global Iron Roughneck Revenue undefined Forecast, by Application 2020 & 2033
- Table 2: Global Iron Roughneck Revenue undefined Forecast, by Types 2020 & 2033
- Table 3: Global Iron Roughneck Revenue undefined Forecast, by Region 2020 & 2033
- Table 4: Global Iron Roughneck Revenue undefined Forecast, by Application 2020 & 2033
- Table 5: Global Iron Roughneck Revenue undefined Forecast, by Types 2020 & 2033
- Table 6: Global Iron Roughneck Revenue undefined Forecast, by Country 2020 & 2033
- Table 7: United States Iron Roughneck Revenue (undefined) Forecast, by Application 2020 & 2033
- Table 8: Canada Iron Roughneck Revenue (undefined) Forecast, by Application 2020 & 2033
- Table 9: Mexico Iron Roughneck Revenue (undefined) Forecast, by Application 2020 & 2033
- Table 10: Global Iron Roughneck Revenue undefined Forecast, by Application 2020 & 2033
- Table 11: Global Iron Roughneck Revenue undefined Forecast, by Types 2020 & 2033
- Table 12: Global Iron Roughneck Revenue undefined Forecast, by Country 2020 & 2033
- Table 13: Brazil Iron Roughneck Revenue (undefined) Forecast, by Application 2020 & 2033
- Table 14: Argentina Iron Roughneck Revenue (undefined) Forecast, by Application 2020 & 2033
- Table 15: Rest of South America Iron Roughneck Revenue (undefined) Forecast, by Application 2020 & 2033
- Table 16: Global Iron Roughneck Revenue undefined Forecast, by Application 2020 & 2033
- Table 17: Global Iron Roughneck Revenue undefined Forecast, by Types 2020 & 2033
- Table 18: Global Iron Roughneck Revenue undefined Forecast, by Country 2020 & 2033
- Table 19: United Kingdom Iron Roughneck Revenue (undefined) Forecast, by Application 2020 & 2033
- Table 20: Germany Iron Roughneck Revenue (undefined) Forecast, by Application 2020 & 2033
- Table 21: France Iron Roughneck Revenue (undefined) Forecast, by Application 2020 & 2033
- Table 22: Italy Iron Roughneck Revenue (undefined) Forecast, by Application 2020 & 2033
- Table 23: Spain Iron Roughneck Revenue (undefined) Forecast, by Application 2020 & 2033
- Table 24: Russia Iron Roughneck Revenue (undefined) Forecast, by Application 2020 & 2033
- Table 25: Benelux Iron Roughneck Revenue (undefined) Forecast, by Application 2020 & 2033
- Table 26: Nordics Iron Roughneck Revenue (undefined) Forecast, by Application 2020 & 2033
- Table 27: Rest of Europe Iron Roughneck Revenue (undefined) Forecast, by Application 2020 & 2033
- Table 28: Global Iron Roughneck Revenue undefined Forecast, by Application 2020 & 2033
- Table 29: Global Iron Roughneck Revenue undefined Forecast, by Types 2020 & 2033
- Table 30: Global Iron Roughneck Revenue undefined Forecast, by Country 2020 & 2033
- Table 31: Turkey Iron Roughneck Revenue (undefined) Forecast, by Application 2020 & 2033
- Table 32: Israel Iron Roughneck Revenue (undefined) Forecast, by Application 2020 & 2033
- Table 33: GCC Iron Roughneck Revenue (undefined) Forecast, by Application 2020 & 2033
- Table 34: North Africa Iron Roughneck Revenue (undefined) Forecast, by Application 2020 & 2033
- Table 35: South Africa Iron Roughneck Revenue (undefined) Forecast, by Application 2020 & 2033
- Table 36: Rest of Middle East & Africa Iron Roughneck Revenue (undefined) Forecast, by Application 2020 & 2033
- Table 37: Global Iron Roughneck Revenue undefined Forecast, by Application 2020 & 2033
- Table 38: Global Iron Roughneck Revenue undefined Forecast, by Types 2020 & 2033
- Table 39: Global Iron Roughneck Revenue undefined Forecast, by Country 2020 & 2033
- Table 40: China Iron Roughneck Revenue (undefined) Forecast, by Application 2020 & 2033
- Table 41: India Iron Roughneck Revenue (undefined) Forecast, by Application 2020 & 2033
- Table 42: Japan Iron Roughneck Revenue (undefined) Forecast, by Application 2020 & 2033
- Table 43: South Korea Iron Roughneck Revenue (undefined) Forecast, by Application 2020 & 2033
- Table 44: ASEAN Iron Roughneck Revenue (undefined) Forecast, by Application 2020 & 2033
- Table 45: Oceania Iron Roughneck Revenue (undefined) Forecast, by Application 2020 & 2033
- Table 46: Rest of Asia Pacific Iron Roughneck Revenue (undefined) Forecast, by Application 2020 & 2033
Frequently Asked Questions
1. What is the projected Compound Annual Growth Rate (CAGR) of the Iron Roughneck?
The projected CAGR is approximately 9.2%.
2. Which companies are prominent players in the Iron Roughneck?
Key companies in the market include Beijing JJC Petroleum Equipment Co., Ltd, SANY Group, Honghua Group Limited, Sichuan L/G Oilfield Equipment, Ltd, Jiangsu Rushi Machinery Co., Ltd., Liaoning Tianyi, NOV Inc., Jiangyi, Baoji Petroleum Machinery Co., Ltd..
3. What are the main segments of the Iron Roughneck?
The market segments include Application, Types.
4. Can you provide details about the market size?
The market size is estimated to be USD XXX N/A as of 2022.
5. What are some drivers contributing to market growth?
N/A
6. What are the notable trends driving market growth?
N/A
7. Are there any restraints impacting market growth?
N/A
8. Can you provide examples of recent developments in the market?
N/A
9. What pricing options are available for accessing the report?
Pricing options include single-user, multi-user, and enterprise licenses priced at USD 4350.00, USD 6525.00, and USD 8700.00 respectively.
10. Is the market size provided in terms of value or volume?
The market size is provided in terms of value, measured in N/A.
11. Are there any specific market keywords associated with the report?
Yes, the market keyword associated with the report is "Iron Roughneck," which aids in identifying and referencing the specific market segment covered.
12. How do I determine which pricing option suits my needs best?
The pricing options vary based on user requirements and access needs. Individual users may opt for single-user licenses, while businesses requiring broader access may choose multi-user or enterprise licenses for cost-effective access to the report.
13. Are there any additional resources or data provided in the Iron Roughneck report?
While the report offers comprehensive insights, it's advisable to review the specific contents or supplementary materials provided to ascertain if additional resources or data are available.
14. How can I stay updated on further developments or reports in the Iron Roughneck?
To stay informed about further developments, trends, and reports in the Iron Roughneck, consider subscribing to industry newsletters, following relevant companies and organizations, or regularly checking reputable industry news sources and publications.
Methodology
Step 1 - Identification of Relevant Samples Size from Population Database


Step 2 - Approaches for Defining Global Market Size (Value, Volume* & Price*)

Note*: In applicable scenarios
Step 3 - Data Sources
Primary Research
- Web Analytics
- Survey Reports
- Research Institute
- Latest Research Reports
- Opinion Leaders
Secondary Research
- Annual Reports
- White Paper
- Latest Press Release
- Industry Association
- Paid Database
- Investor Presentations

Step 4 - Data Triangulation
Involves using different sources of information in order to increase the validity of a study
These sources are likely to be stakeholders in a program - participants, other researchers, program staff, other community members, and so on.
Then we put all data in single framework & apply various statistical tools to find out the dynamic on the market.
During the analysis stage, feedback from the stakeholder groups would be compared to determine areas of agreement as well as areas of divergence