

Key Insights
The global IoT Smart Ultrasonic Proximity Sensors market is poised for substantial growth, projected to reach approximately USD 5,319.5 million in 2025 with a robust Compound Annual Growth Rate (CAGR) of 6% through 2033. This expansion is primarily driven by the accelerating adoption of Industrial Internet of Things (IIoT) solutions across various sectors. The increasing demand for intelligent automation, predictive maintenance, and enhanced operational efficiency within the manufacturing, automotive, and consumer electronics industries are key catalysts. As businesses integrate smart sensors for real-time data collection and analysis, the need for reliable and advanced proximity sensing technology that can seamlessly connect to IoT ecosystems is paramount. The development of more sophisticated ultrasonic sensor technologies, offering improved accuracy, extended sensing ranges, and greater resistance to environmental interference, further fuels this market momentum.
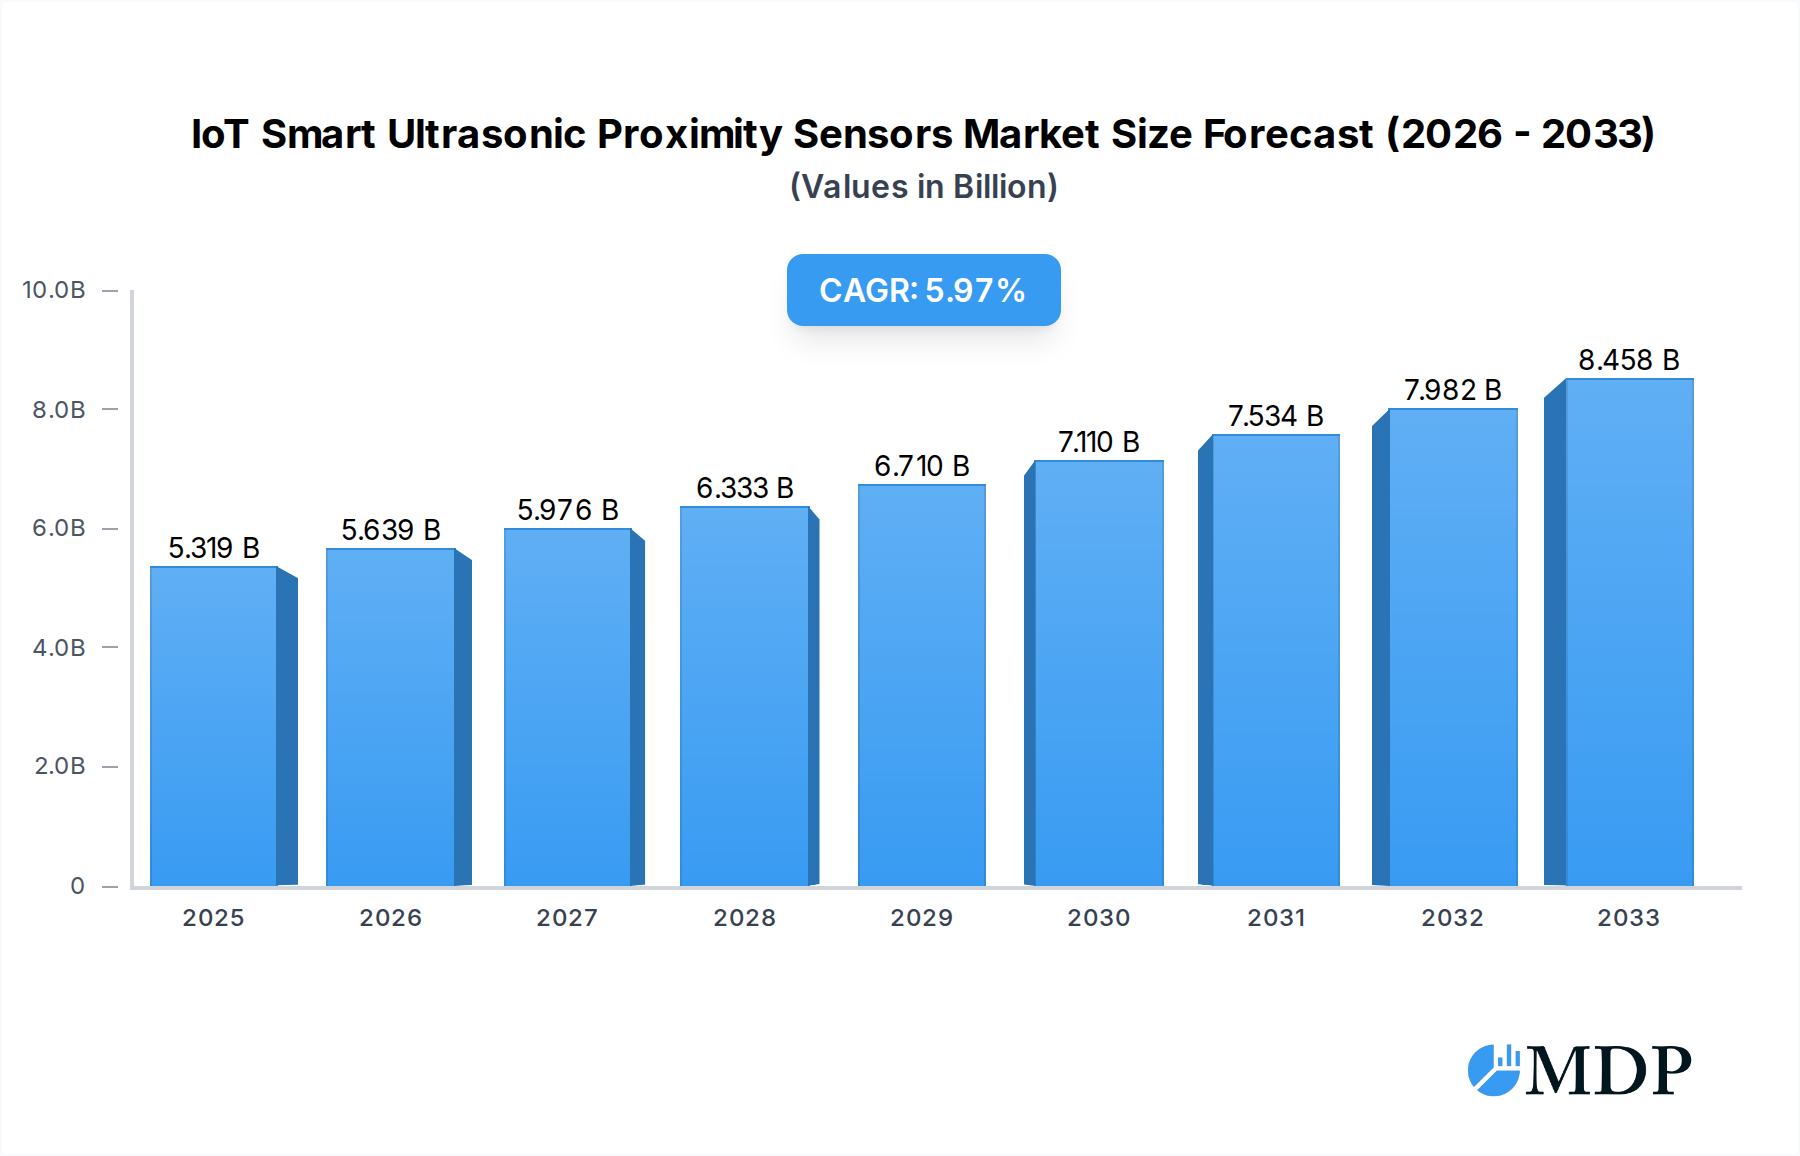
IoT Smart Ultrasonic Proximity Sensors Market Size (In Billion)
The market is segmented by application into Consumer Electronics, Automotive Industry, Aviation Industry, Conveyor Systems, and Others, with Consumer Electronics and Automotive likely representing the largest segments due to high production volumes and rapid technological integration. In terms of type, Through-Beam, Retro-Reflective, and Diffuse sensors cater to diverse detection needs. Key industry players like Siemens Process Instrumentation, Pepperl+Fuchs, Rockwell Automation, and SICK are at the forefront, investing in research and development to offer innovative solutions. Geographically, Asia Pacific, led by China and India, is expected to exhibit the highest growth owing to its burgeoning manufacturing base and significant investments in smart factory initiatives. North America and Europe also represent mature yet continuously evolving markets, driven by Industry 4.0 advancements and stringent automation standards. The forecast period anticipates sustained demand as more industries embrace digital transformation and IoT integration.

IoT Smart Ultrasonic Proximity Sensors Company Market Share
This comprehensive report delves into the dynamic landscape of IoT Smart Ultrasonic Proximity Sensors, providing critical insights for industry stakeholders. From market concentration and innovation drivers to future trends and key players, this analysis offers actionable intelligence for strategic decision-making. The study period spans from 2019 to 2033, with a base and estimated year of 2025, and a detailed forecast period from 2025 to 2033, building upon historical data from 2019–2024.
IoT Smart Ultrasonic Proximity Sensors Market Dynamics & Concentration
The IoT Smart Ultrasonic Proximity Sensors market exhibits a moderately concentrated structure, with major players like IFM Electronic, Siemens Process Instrumentation, Pepperl+Fuchs, Rockwell Automation, and SICK holding significant market share, estimated to be in the range of 30% to 40% combined in the base year of 2025. Innovation remains a primary driver, fueled by the increasing demand for automation, precision measurement, and predictive maintenance across diverse industries. The integration of AI and machine learning into sensor capabilities is a key technological advancement, enhancing decision-making and efficiency. Regulatory frameworks, while evolving to accommodate the rapid growth of IoT technologies, are generally supportive, focusing on data security and interoperability standards. Product substitutes, such as vision-based sensors and lidar, pose a competitive challenge, particularly in applications requiring higher resolution or broader environmental sensing. However, the cost-effectiveness, robustness, and ease of integration of ultrasonic proximity sensors continue to drive their adoption. End-user trends clearly favor solutions that offer real-time data, remote monitoring, and reduced operational downtime. Mergers and acquisitions (M&A) activity is moderately active, with approximately 5 to 10 significant deals anticipated during the forecast period, aimed at consolidating market positions and acquiring specialized technological expertise.
IoT Smart Ultrasonic Proximity Sensors Industry Trends & Analysis
The global IoT Smart Ultrasonic Proximity Sensors market is poised for substantial growth, driven by a projected Compound Annual Growth Rate (CAGR) of approximately 12.5% over the forecast period of 2025–2033. This robust expansion is primarily fueled by the accelerating adoption of Industry 4.0 principles across manufacturing, logistics, and automation sectors. The increasing demand for intelligent automation, where sensors are integral to creating connected and responsive systems, is a significant market growth driver. Technological disruptions, including advancements in miniaturization, power efficiency, and enhanced data analytics capabilities embedded within sensors, are reshaping product offerings and competitive advantages. Consumers are increasingly preferring smart, connected devices that offer greater control, customization, and predictive maintenance features. This shift in consumer preferences directly influences sensor manufacturers to develop products that are not only functional but also intelligent and interoperable. The competitive landscape is characterized by intense innovation and strategic partnerships. Companies are investing heavily in research and development to incorporate features like self-diagnostics, remote configuration, and seamless integration with cloud platforms. Market penetration for IoT Smart Ultrasonic Proximity Sensors is expected to reach over 50% in key industrial segments by 2030, underscoring their growing importance in modern industrial operations. The ability of these sensors to provide accurate, non-contact detection of objects, coupled with their suitability for harsh environments, further solidifies their market position.
Leading Markets & Segments in IoT Smart Ultrasonic Proximity Sensors
The North America region is projected to emerge as the dominant market for IoT Smart Ultrasonic Proximity Sensors, driven by a confluence of technological innovation, strong industrial base, and supportive government initiatives for smart manufacturing and automation. Within North America, the United States is expected to command a significant market share, estimated to be around 40% of the regional market in 2025, due to its advanced manufacturing infrastructure and early adoption of Industry 4.0 technologies.
Application Dominance:
- Automotive Industry: This segment is a significant growth engine, propelled by the increasing demand for advanced driver-assistance systems (ADAS), automated parking, and in-cabin occupant detection. The stringent safety regulations and the pursuit of autonomous driving technology are key drivers. Estimated market share for this segment is projected to be around 25% of the total market in 2025.
- Conveyor Systems: Essential for logistics and warehouse automation, this segment benefits from the exponential growth in e-commerce and the need for efficient material handling. Accurate object detection and presence sensing are crucial for seamless conveyor operations. This segment is estimated to hold a market share of approximately 20% in 2025.
- Consumer Electronics: The increasing integration of smart features in everyday appliances and smart home devices, requiring proximity detection for user interaction and energy saving, contributes to this segment's growth.
- Aviation Industry: While a niche market, the aviation sector utilizes these sensors for various applications, including cargo handling, aircraft maintenance, and passenger boarding, demanding high reliability and precision.
- Others: This broad category encompasses various industrial automation, robotics, and specialized applications where ultrasonic proximity sensing proves invaluable.
Type Dominance:
- Diffuse Sensors: These are expected to lead the market, accounting for an estimated 45% market share in 2025, due to their versatility in detecting a wide range of objects without requiring reflective surfaces. Their application in proximity detection, level sensing, and object counting is extensive.
- Through-Beam Sensors: Crucial for detecting the presence or absence of objects in a light beam, these sensors are vital for safety guarding and precise counting in high-volume production lines. Their reliable performance ensures a significant market presence.
- Retro-Reflective Sensors: Offering a balance of performance and ease of installation, these sensors are widely adopted in various industrial settings where a reflector can be used.
IoT Smart Ultrasonic Proximity Sensors Product Developments
Product development in the IoT Smart Ultrasonic Proximity Sensors market is characterized by a focus on enhanced intelligence, connectivity, and ruggedization. Innovations are centered around miniaturized sensor designs, improved sensing range and accuracy, and seamless integration with IoT platforms for real-time data transmission and analysis. Key advancements include the incorporation of machine learning algorithms for object differentiation and predictive maintenance capabilities, reducing downtime and optimizing operational efficiency. Competitive advantages are being built through features like self-diagnostic functionalities, enhanced resistance to environmental factors like dust and moisture, and multi-connectivity options (e.g., IO-Link, MQTT).
Key Drivers of IoT Smart Ultrasonic Proximity Sensors Growth
The growth of the IoT Smart Ultrasonic Proximity Sensors market is propelled by several key factors. Firstly, the relentless drive towards industrial automation and the implementation of Industry 4.0 across manufacturing sectors is creating a massive demand for intelligent sensing solutions. Secondly, the expanding adoption of smart technologies in the automotive industry, particularly for ADAS and autonomous driving, is a significant catalyst. Thirdly, government initiatives promoting smart cities and connected infrastructure are opening new avenues for sensor deployment. Finally, the continuous innovation in sensor technology, leading to more accurate, reliable, and cost-effective solutions, further fuels market expansion.
Challenges in the IoT Smart Ultrasonic Proximity Sensors Market
Despite the robust growth, the IoT Smart Ultrasonic Proximity Sensors market faces several challenges. Regulatory hurdles related to data privacy and cybersecurity can slow down adoption in certain sensitive applications. Supply chain disruptions and the volatility of raw material prices can impact manufacturing costs and lead times. Intense competition from alternative sensing technologies, such as vision-based systems, also presents a restraint. Furthermore, the need for skilled personnel to implement and manage complex IoT sensor networks can be a barrier for smaller enterprises.
Emerging Opportunities in IoT Smart Ultrasonic Proximity Sensors
Emerging opportunities in the IoT Smart Ultrasonic Proximity Sensors market are abundant. The expansion of the Internet of Things (IoT) ecosystem across various industries, including healthcare, agriculture, and smart cities, presents significant untapped potential. Technological breakthroughs in AI and edge computing, enabling on-sensor data processing, will drive demand for more sophisticated ultrasonic sensors. Strategic partnerships between sensor manufacturers and software providers are creating integrated solutions that offer enhanced value. Furthermore, the growing trend of predictive maintenance and condition monitoring across industries is a major catalyst for the adoption of smart sensors.
Leading Players in the IoT Smart Ultrasonic Proximity Sensors Sector
- IFM Electronic
- Siemens Process Instrumentation
- Pepperl+Fuchs
- Rockwell Automation
- Leuze Electronic
- Banner Engineering
- Madison Company
- Balluff
- Honeywell
- Hans TURCK
- Telemecanique Sensors
- SICK
- Omega Engineering
- Gems Sensors & Controls
- Wenglor Sensoric
- Marsh Bellofram
Key Milestones in IoT Smart Ultrasonic Proximity Sensors Industry
- 2019: Increased adoption of AI in sensor analytics for predictive maintenance.
- 2020: Introduction of miniaturized ultrasonic sensors with enhanced sensing ranges.
- 2021: Growth in demand for contactless sensing solutions in hygiene-sensitive industries.
- 2022: Development of Io-Link enabled sensors for seamless industrial communication.
- 2023: Increased investment in R&D for multi-modal sensing capabilities.
- 2024: Growing integration of edge computing for on-device data processing.
Strategic Outlook for IoT Smart Ultrasonic Proximity Sensors Market
The strategic outlook for the IoT Smart Ultrasonic Proximity Sensors market remains exceptionally strong. Future growth will be driven by the continued integration of these sensors into broader IoT ecosystems, enabling sophisticated automation, real-time monitoring, and data-driven decision-making. Opportunities lie in developing solutions tailored for emerging applications in robotics, logistics, and smart infrastructure. Strategic collaborations and a focus on advanced analytics will be crucial for companies to maintain a competitive edge and capitalize on the vast potential of this evolving market.
IoT Smart Ultrasonic Proximity Sensors Segmentation
-
1. Application
- 1.1. Consumer Electronics
- 1.2. Automotive Industry
- 1.3. Aviation Industry
- 1.4. Conveyor Systems
- 1.5. Others
-
2. Types
- 2.1. Through-Beam
- 2.2. Retro-Reflective
- 2.3. Diffuse
IoT Smart Ultrasonic Proximity Sensors Segmentation By Geography
-
1. North America
- 1.1. United States
- 1.2. Canada
- 1.3. Mexico
-
2. South America
- 2.1. Brazil
- 2.2. Argentina
- 2.3. Rest of South America
-
3. Europe
- 3.1. United Kingdom
- 3.2. Germany
- 3.3. France
- 3.4. Italy
- 3.5. Spain
- 3.6. Russia
- 3.7. Benelux
- 3.8. Nordics
- 3.9. Rest of Europe
-
4. Middle East & Africa
- 4.1. Turkey
- 4.2. Israel
- 4.3. GCC
- 4.4. North Africa
- 4.5. South Africa
- 4.6. Rest of Middle East & Africa
-
5. Asia Pacific
- 5.1. China
- 5.2. India
- 5.3. Japan
- 5.4. South Korea
- 5.5. ASEAN
- 5.6. Oceania
- 5.7. Rest of Asia Pacific
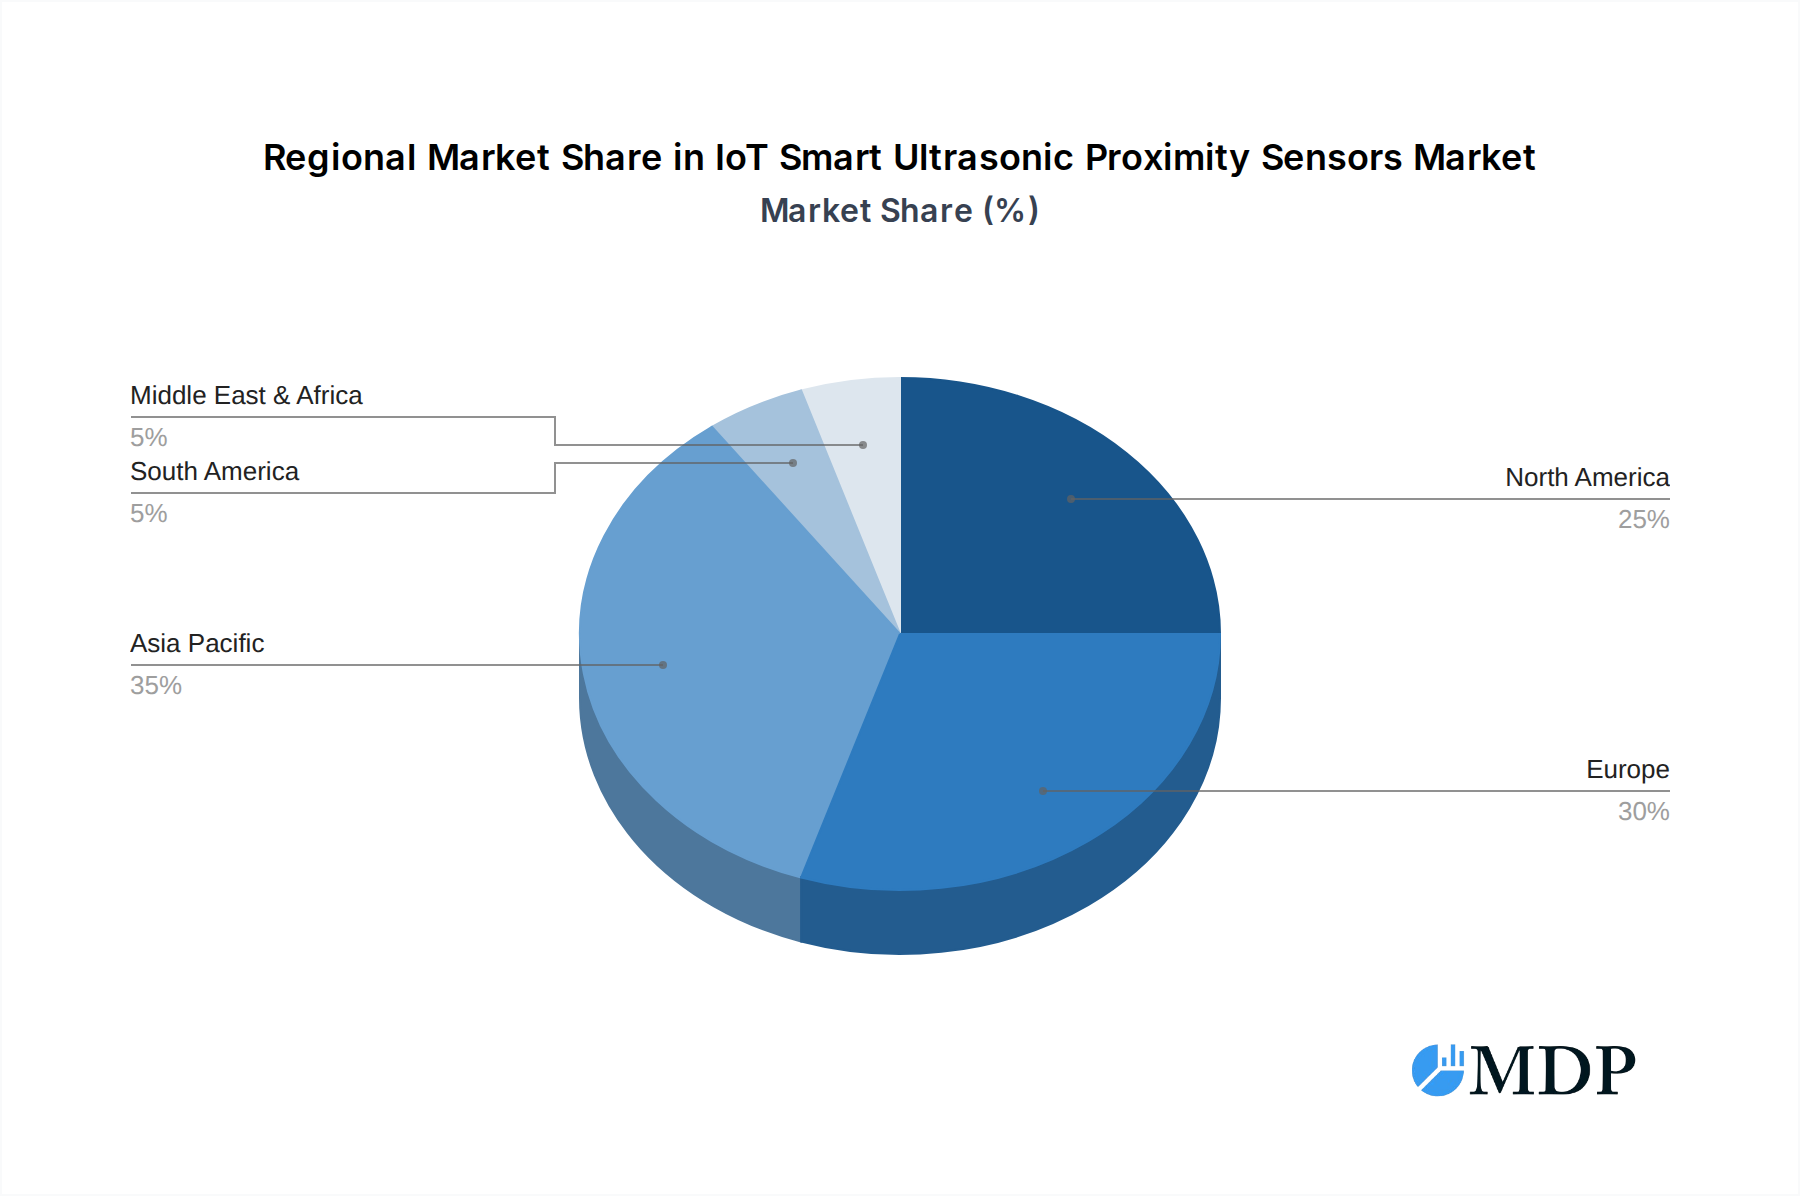
IoT Smart Ultrasonic Proximity Sensors Regional Market Share
Geographic Coverage of IoT Smart Ultrasonic Proximity Sensors
IoT Smart Ultrasonic Proximity Sensors REPORT HIGHLIGHTS
| Aspects | Details |
|---|---|
| Study Period | 2020-2034 |
| Base Year | 2025 |
| Estimated Year | 2026 |
| Forecast Period | 2026-2034 |
| Historical Period | 2020-2025 |
| Growth Rate | CAGR of 6% from 2020-2034 |
| Segmentation |
|
Table of Contents
- 1. Introduction
- 1.1. Research Scope
- 1.2. Market Segmentation
- 1.3. Research Methodology
- 1.4. Definitions and Assumptions
- 2. Executive Summary
- 2.1. Introduction
- 3. Market Dynamics
- 3.1. Introduction
- 3.2. Market Drivers
- 3.3. Market Restrains
- 3.4. Market Trends
- 4. Market Factor Analysis
- 4.1. Porters Five Forces
- 4.2. Supply/Value Chain
- 4.3. PESTEL analysis
- 4.4. Market Entropy
- 4.5. Patent/Trademark Analysis
- 5. Global IoT Smart Ultrasonic Proximity Sensors Analysis, Insights and Forecast, 2020-2032
- 5.1. Market Analysis, Insights and Forecast - by Application
- 5.1.1. Consumer Electronics
- 5.1.2. Automotive Industry
- 5.1.3. Aviation Industry
- 5.1.4. Conveyor Systems
- 5.1.5. Others
- 5.2. Market Analysis, Insights and Forecast - by Types
- 5.2.1. Through-Beam
- 5.2.2. Retro-Reflective
- 5.2.3. Diffuse
- 5.3. Market Analysis, Insights and Forecast - by Region
- 5.3.1. North America
- 5.3.2. South America
- 5.3.3. Europe
- 5.3.4. Middle East & Africa
- 5.3.5. Asia Pacific
- 5.1. Market Analysis, Insights and Forecast - by Application
- 6. North America IoT Smart Ultrasonic Proximity Sensors Analysis, Insights and Forecast, 2020-2032
- 6.1. Market Analysis, Insights and Forecast - by Application
- 6.1.1. Consumer Electronics
- 6.1.2. Automotive Industry
- 6.1.3. Aviation Industry
- 6.1.4. Conveyor Systems
- 6.1.5. Others
- 6.2. Market Analysis, Insights and Forecast - by Types
- 6.2.1. Through-Beam
- 6.2.2. Retro-Reflective
- 6.2.3. Diffuse
- 6.1. Market Analysis, Insights and Forecast - by Application
- 7. South America IoT Smart Ultrasonic Proximity Sensors Analysis, Insights and Forecast, 2020-2032
- 7.1. Market Analysis, Insights and Forecast - by Application
- 7.1.1. Consumer Electronics
- 7.1.2. Automotive Industry
- 7.1.3. Aviation Industry
- 7.1.4. Conveyor Systems
- 7.1.5. Others
- 7.2. Market Analysis, Insights and Forecast - by Types
- 7.2.1. Through-Beam
- 7.2.2. Retro-Reflective
- 7.2.3. Diffuse
- 7.1. Market Analysis, Insights and Forecast - by Application
- 8. Europe IoT Smart Ultrasonic Proximity Sensors Analysis, Insights and Forecast, 2020-2032
- 8.1. Market Analysis, Insights and Forecast - by Application
- 8.1.1. Consumer Electronics
- 8.1.2. Automotive Industry
- 8.1.3. Aviation Industry
- 8.1.4. Conveyor Systems
- 8.1.5. Others
- 8.2. Market Analysis, Insights and Forecast - by Types
- 8.2.1. Through-Beam
- 8.2.2. Retro-Reflective
- 8.2.3. Diffuse
- 8.1. Market Analysis, Insights and Forecast - by Application
- 9. Middle East & Africa IoT Smart Ultrasonic Proximity Sensors Analysis, Insights and Forecast, 2020-2032
- 9.1. Market Analysis, Insights and Forecast - by Application
- 9.1.1. Consumer Electronics
- 9.1.2. Automotive Industry
- 9.1.3. Aviation Industry
- 9.1.4. Conveyor Systems
- 9.1.5. Others
- 9.2. Market Analysis, Insights and Forecast - by Types
- 9.2.1. Through-Beam
- 9.2.2. Retro-Reflective
- 9.2.3. Diffuse
- 9.1. Market Analysis, Insights and Forecast - by Application
- 10. Asia Pacific IoT Smart Ultrasonic Proximity Sensors Analysis, Insights and Forecast, 2020-2032
- 10.1. Market Analysis, Insights and Forecast - by Application
- 10.1.1. Consumer Electronics
- 10.1.2. Automotive Industry
- 10.1.3. Aviation Industry
- 10.1.4. Conveyor Systems
- 10.1.5. Others
- 10.2. Market Analysis, Insights and Forecast - by Types
- 10.2.1. Through-Beam
- 10.2.2. Retro-Reflective
- 10.2.3. Diffuse
- 10.1. Market Analysis, Insights and Forecast - by Application
- 11. Competitive Analysis
- 11.1. Global Market Share Analysis 2025
- 11.2. Company Profiles
- 11.2.1 IFM Electronic
- 11.2.1.1. Overview
- 11.2.1.2. Products
- 11.2.1.3. SWOT Analysis
- 11.2.1.4. Recent Developments
- 11.2.1.5. Financials (Based on Availability)
- 11.2.2 Siemens Process Instrumentation
- 11.2.2.1. Overview
- 11.2.2.2. Products
- 11.2.2.3. SWOT Analysis
- 11.2.2.4. Recent Developments
- 11.2.2.5. Financials (Based on Availability)
- 11.2.3 Pepperl+Fuchs
- 11.2.3.1. Overview
- 11.2.3.2. Products
- 11.2.3.3. SWOT Analysis
- 11.2.3.4. Recent Developments
- 11.2.3.5. Financials (Based on Availability)
- 11.2.4 Rockwell Automation
- 11.2.4.1. Overview
- 11.2.4.2. Products
- 11.2.4.3. SWOT Analysis
- 11.2.4.4. Recent Developments
- 11.2.4.5. Financials (Based on Availability)
- 11.2.5 Leuze Electronic
- 11.2.5.1. Overview
- 11.2.5.2. Products
- 11.2.5.3. SWOT Analysis
- 11.2.5.4. Recent Developments
- 11.2.5.5. Financials (Based on Availability)
- 11.2.6 Banner Engineering
- 11.2.6.1. Overview
- 11.2.6.2. Products
- 11.2.6.3. SWOT Analysis
- 11.2.6.4. Recent Developments
- 11.2.6.5. Financials (Based on Availability)
- 11.2.7 Madison Company
- 11.2.7.1. Overview
- 11.2.7.2. Products
- 11.2.7.3. SWOT Analysis
- 11.2.7.4. Recent Developments
- 11.2.7.5. Financials (Based on Availability)
- 11.2.8 Balluff
- 11.2.8.1. Overview
- 11.2.8.2. Products
- 11.2.8.3. SWOT Analysis
- 11.2.8.4. Recent Developments
- 11.2.8.5. Financials (Based on Availability)
- 11.2.9 Honeywell
- 11.2.9.1. Overview
- 11.2.9.2. Products
- 11.2.9.3. SWOT Analysis
- 11.2.9.4. Recent Developments
- 11.2.9.5. Financials (Based on Availability)
- 11.2.10 Hans TURCK
- 11.2.10.1. Overview
- 11.2.10.2. Products
- 11.2.10.3. SWOT Analysis
- 11.2.10.4. Recent Developments
- 11.2.10.5. Financials (Based on Availability)
- 11.2.11 Telemecanique Sensors
- 11.2.11.1. Overview
- 11.2.11.2. Products
- 11.2.11.3. SWOT Analysis
- 11.2.11.4. Recent Developments
- 11.2.11.5. Financials (Based on Availability)
- 11.2.12 SICK
- 11.2.12.1. Overview
- 11.2.12.2. Products
- 11.2.12.3. SWOT Analysis
- 11.2.12.4. Recent Developments
- 11.2.12.5. Financials (Based on Availability)
- 11.2.13 Omega Engineering
- 11.2.13.1. Overview
- 11.2.13.2. Products
- 11.2.13.3. SWOT Analysis
- 11.2.13.4. Recent Developments
- 11.2.13.5. Financials (Based on Availability)
- 11.2.14 Gems Sensors & Controls
- 11.2.14.1. Overview
- 11.2.14.2. Products
- 11.2.14.3. SWOT Analysis
- 11.2.14.4. Recent Developments
- 11.2.14.5. Financials (Based on Availability)
- 11.2.15 Wenglor Sensoric
- 11.2.15.1. Overview
- 11.2.15.2. Products
- 11.2.15.3. SWOT Analysis
- 11.2.15.4. Recent Developments
- 11.2.15.5. Financials (Based on Availability)
- 11.2.16 Marsh Bellofram
- 11.2.16.1. Overview
- 11.2.16.2. Products
- 11.2.16.3. SWOT Analysis
- 11.2.16.4. Recent Developments
- 11.2.16.5. Financials (Based on Availability)
- 11.2.1 IFM Electronic
List of Figures
- Figure 1: Global IoT Smart Ultrasonic Proximity Sensors Revenue Breakdown (undefined, %) by Region 2025 & 2033
- Figure 2: Global IoT Smart Ultrasonic Proximity Sensors Volume Breakdown (K, %) by Region 2025 & 2033
- Figure 3: North America IoT Smart Ultrasonic Proximity Sensors Revenue (undefined), by Application 2025 & 2033
- Figure 4: North America IoT Smart Ultrasonic Proximity Sensors Volume (K), by Application 2025 & 2033
- Figure 5: North America IoT Smart Ultrasonic Proximity Sensors Revenue Share (%), by Application 2025 & 2033
- Figure 6: North America IoT Smart Ultrasonic Proximity Sensors Volume Share (%), by Application 2025 & 2033
- Figure 7: North America IoT Smart Ultrasonic Proximity Sensors Revenue (undefined), by Types 2025 & 2033
- Figure 8: North America IoT Smart Ultrasonic Proximity Sensors Volume (K), by Types 2025 & 2033
- Figure 9: North America IoT Smart Ultrasonic Proximity Sensors Revenue Share (%), by Types 2025 & 2033
- Figure 10: North America IoT Smart Ultrasonic Proximity Sensors Volume Share (%), by Types 2025 & 2033
- Figure 11: North America IoT Smart Ultrasonic Proximity Sensors Revenue (undefined), by Country 2025 & 2033
- Figure 12: North America IoT Smart Ultrasonic Proximity Sensors Volume (K), by Country 2025 & 2033
- Figure 13: North America IoT Smart Ultrasonic Proximity Sensors Revenue Share (%), by Country 2025 & 2033
- Figure 14: North America IoT Smart Ultrasonic Proximity Sensors Volume Share (%), by Country 2025 & 2033
- Figure 15: South America IoT Smart Ultrasonic Proximity Sensors Revenue (undefined), by Application 2025 & 2033
- Figure 16: South America IoT Smart Ultrasonic Proximity Sensors Volume (K), by Application 2025 & 2033
- Figure 17: South America IoT Smart Ultrasonic Proximity Sensors Revenue Share (%), by Application 2025 & 2033
- Figure 18: South America IoT Smart Ultrasonic Proximity Sensors Volume Share (%), by Application 2025 & 2033
- Figure 19: South America IoT Smart Ultrasonic Proximity Sensors Revenue (undefined), by Types 2025 & 2033
- Figure 20: South America IoT Smart Ultrasonic Proximity Sensors Volume (K), by Types 2025 & 2033
- Figure 21: South America IoT Smart Ultrasonic Proximity Sensors Revenue Share (%), by Types 2025 & 2033
- Figure 22: South America IoT Smart Ultrasonic Proximity Sensors Volume Share (%), by Types 2025 & 2033
- Figure 23: South America IoT Smart Ultrasonic Proximity Sensors Revenue (undefined), by Country 2025 & 2033
- Figure 24: South America IoT Smart Ultrasonic Proximity Sensors Volume (K), by Country 2025 & 2033
- Figure 25: South America IoT Smart Ultrasonic Proximity Sensors Revenue Share (%), by Country 2025 & 2033
- Figure 26: South America IoT Smart Ultrasonic Proximity Sensors Volume Share (%), by Country 2025 & 2033
- Figure 27: Europe IoT Smart Ultrasonic Proximity Sensors Revenue (undefined), by Application 2025 & 2033
- Figure 28: Europe IoT Smart Ultrasonic Proximity Sensors Volume (K), by Application 2025 & 2033
- Figure 29: Europe IoT Smart Ultrasonic Proximity Sensors Revenue Share (%), by Application 2025 & 2033
- Figure 30: Europe IoT Smart Ultrasonic Proximity Sensors Volume Share (%), by Application 2025 & 2033
- Figure 31: Europe IoT Smart Ultrasonic Proximity Sensors Revenue (undefined), by Types 2025 & 2033
- Figure 32: Europe IoT Smart Ultrasonic Proximity Sensors Volume (K), by Types 2025 & 2033
- Figure 33: Europe IoT Smart Ultrasonic Proximity Sensors Revenue Share (%), by Types 2025 & 2033
- Figure 34: Europe IoT Smart Ultrasonic Proximity Sensors Volume Share (%), by Types 2025 & 2033
- Figure 35: Europe IoT Smart Ultrasonic Proximity Sensors Revenue (undefined), by Country 2025 & 2033
- Figure 36: Europe IoT Smart Ultrasonic Proximity Sensors Volume (K), by Country 2025 & 2033
- Figure 37: Europe IoT Smart Ultrasonic Proximity Sensors Revenue Share (%), by Country 2025 & 2033
- Figure 38: Europe IoT Smart Ultrasonic Proximity Sensors Volume Share (%), by Country 2025 & 2033
- Figure 39: Middle East & Africa IoT Smart Ultrasonic Proximity Sensors Revenue (undefined), by Application 2025 & 2033
- Figure 40: Middle East & Africa IoT Smart Ultrasonic Proximity Sensors Volume (K), by Application 2025 & 2033
- Figure 41: Middle East & Africa IoT Smart Ultrasonic Proximity Sensors Revenue Share (%), by Application 2025 & 2033
- Figure 42: Middle East & Africa IoT Smart Ultrasonic Proximity Sensors Volume Share (%), by Application 2025 & 2033
- Figure 43: Middle East & Africa IoT Smart Ultrasonic Proximity Sensors Revenue (undefined), by Types 2025 & 2033
- Figure 44: Middle East & Africa IoT Smart Ultrasonic Proximity Sensors Volume (K), by Types 2025 & 2033
- Figure 45: Middle East & Africa IoT Smart Ultrasonic Proximity Sensors Revenue Share (%), by Types 2025 & 2033
- Figure 46: Middle East & Africa IoT Smart Ultrasonic Proximity Sensors Volume Share (%), by Types 2025 & 2033
- Figure 47: Middle East & Africa IoT Smart Ultrasonic Proximity Sensors Revenue (undefined), by Country 2025 & 2033
- Figure 48: Middle East & Africa IoT Smart Ultrasonic Proximity Sensors Volume (K), by Country 2025 & 2033
- Figure 49: Middle East & Africa IoT Smart Ultrasonic Proximity Sensors Revenue Share (%), by Country 2025 & 2033
- Figure 50: Middle East & Africa IoT Smart Ultrasonic Proximity Sensors Volume Share (%), by Country 2025 & 2033
- Figure 51: Asia Pacific IoT Smart Ultrasonic Proximity Sensors Revenue (undefined), by Application 2025 & 2033
- Figure 52: Asia Pacific IoT Smart Ultrasonic Proximity Sensors Volume (K), by Application 2025 & 2033
- Figure 53: Asia Pacific IoT Smart Ultrasonic Proximity Sensors Revenue Share (%), by Application 2025 & 2033
- Figure 54: Asia Pacific IoT Smart Ultrasonic Proximity Sensors Volume Share (%), by Application 2025 & 2033
- Figure 55: Asia Pacific IoT Smart Ultrasonic Proximity Sensors Revenue (undefined), by Types 2025 & 2033
- Figure 56: Asia Pacific IoT Smart Ultrasonic Proximity Sensors Volume (K), by Types 2025 & 2033
- Figure 57: Asia Pacific IoT Smart Ultrasonic Proximity Sensors Revenue Share (%), by Types 2025 & 2033
- Figure 58: Asia Pacific IoT Smart Ultrasonic Proximity Sensors Volume Share (%), by Types 2025 & 2033
- Figure 59: Asia Pacific IoT Smart Ultrasonic Proximity Sensors Revenue (undefined), by Country 2025 & 2033
- Figure 60: Asia Pacific IoT Smart Ultrasonic Proximity Sensors Volume (K), by Country 2025 & 2033
- Figure 61: Asia Pacific IoT Smart Ultrasonic Proximity Sensors Revenue Share (%), by Country 2025 & 2033
- Figure 62: Asia Pacific IoT Smart Ultrasonic Proximity Sensors Volume Share (%), by Country 2025 & 2033
List of Tables
- Table 1: Global IoT Smart Ultrasonic Proximity Sensors Revenue undefined Forecast, by Application 2020 & 2033
- Table 2: Global IoT Smart Ultrasonic Proximity Sensors Volume K Forecast, by Application 2020 & 2033
- Table 3: Global IoT Smart Ultrasonic Proximity Sensors Revenue undefined Forecast, by Types 2020 & 2033
- Table 4: Global IoT Smart Ultrasonic Proximity Sensors Volume K Forecast, by Types 2020 & 2033
- Table 5: Global IoT Smart Ultrasonic Proximity Sensors Revenue undefined Forecast, by Region 2020 & 2033
- Table 6: Global IoT Smart Ultrasonic Proximity Sensors Volume K Forecast, by Region 2020 & 2033
- Table 7: Global IoT Smart Ultrasonic Proximity Sensors Revenue undefined Forecast, by Application 2020 & 2033
- Table 8: Global IoT Smart Ultrasonic Proximity Sensors Volume K Forecast, by Application 2020 & 2033
- Table 9: Global IoT Smart Ultrasonic Proximity Sensors Revenue undefined Forecast, by Types 2020 & 2033
- Table 10: Global IoT Smart Ultrasonic Proximity Sensors Volume K Forecast, by Types 2020 & 2033
- Table 11: Global IoT Smart Ultrasonic Proximity Sensors Revenue undefined Forecast, by Country 2020 & 2033
- Table 12: Global IoT Smart Ultrasonic Proximity Sensors Volume K Forecast, by Country 2020 & 2033
- Table 13: United States IoT Smart Ultrasonic Proximity Sensors Revenue (undefined) Forecast, by Application 2020 & 2033
- Table 14: United States IoT Smart Ultrasonic Proximity Sensors Volume (K) Forecast, by Application 2020 & 2033
- Table 15: Canada IoT Smart Ultrasonic Proximity Sensors Revenue (undefined) Forecast, by Application 2020 & 2033
- Table 16: Canada IoT Smart Ultrasonic Proximity Sensors Volume (K) Forecast, by Application 2020 & 2033
- Table 17: Mexico IoT Smart Ultrasonic Proximity Sensors Revenue (undefined) Forecast, by Application 2020 & 2033
- Table 18: Mexico IoT Smart Ultrasonic Proximity Sensors Volume (K) Forecast, by Application 2020 & 2033
- Table 19: Global IoT Smart Ultrasonic Proximity Sensors Revenue undefined Forecast, by Application 2020 & 2033
- Table 20: Global IoT Smart Ultrasonic Proximity Sensors Volume K Forecast, by Application 2020 & 2033
- Table 21: Global IoT Smart Ultrasonic Proximity Sensors Revenue undefined Forecast, by Types 2020 & 2033
- Table 22: Global IoT Smart Ultrasonic Proximity Sensors Volume K Forecast, by Types 2020 & 2033
- Table 23: Global IoT Smart Ultrasonic Proximity Sensors Revenue undefined Forecast, by Country 2020 & 2033
- Table 24: Global IoT Smart Ultrasonic Proximity Sensors Volume K Forecast, by Country 2020 & 2033
- Table 25: Brazil IoT Smart Ultrasonic Proximity Sensors Revenue (undefined) Forecast, by Application 2020 & 2033
- Table 26: Brazil IoT Smart Ultrasonic Proximity Sensors Volume (K) Forecast, by Application 2020 & 2033
- Table 27: Argentina IoT Smart Ultrasonic Proximity Sensors Revenue (undefined) Forecast, by Application 2020 & 2033
- Table 28: Argentina IoT Smart Ultrasonic Proximity Sensors Volume (K) Forecast, by Application 2020 & 2033
- Table 29: Rest of South America IoT Smart Ultrasonic Proximity Sensors Revenue (undefined) Forecast, by Application 2020 & 2033
- Table 30: Rest of South America IoT Smart Ultrasonic Proximity Sensors Volume (K) Forecast, by Application 2020 & 2033
- Table 31: Global IoT Smart Ultrasonic Proximity Sensors Revenue undefined Forecast, by Application 2020 & 2033
- Table 32: Global IoT Smart Ultrasonic Proximity Sensors Volume K Forecast, by Application 2020 & 2033
- Table 33: Global IoT Smart Ultrasonic Proximity Sensors Revenue undefined Forecast, by Types 2020 & 2033
- Table 34: Global IoT Smart Ultrasonic Proximity Sensors Volume K Forecast, by Types 2020 & 2033
- Table 35: Global IoT Smart Ultrasonic Proximity Sensors Revenue undefined Forecast, by Country 2020 & 2033
- Table 36: Global IoT Smart Ultrasonic Proximity Sensors Volume K Forecast, by Country 2020 & 2033
- Table 37: United Kingdom IoT Smart Ultrasonic Proximity Sensors Revenue (undefined) Forecast, by Application 2020 & 2033
- Table 38: United Kingdom IoT Smart Ultrasonic Proximity Sensors Volume (K) Forecast, by Application 2020 & 2033
- Table 39: Germany IoT Smart Ultrasonic Proximity Sensors Revenue (undefined) Forecast, by Application 2020 & 2033
- Table 40: Germany IoT Smart Ultrasonic Proximity Sensors Volume (K) Forecast, by Application 2020 & 2033
- Table 41: France IoT Smart Ultrasonic Proximity Sensors Revenue (undefined) Forecast, by Application 2020 & 2033
- Table 42: France IoT Smart Ultrasonic Proximity Sensors Volume (K) Forecast, by Application 2020 & 2033
- Table 43: Italy IoT Smart Ultrasonic Proximity Sensors Revenue (undefined) Forecast, by Application 2020 & 2033
- Table 44: Italy IoT Smart Ultrasonic Proximity Sensors Volume (K) Forecast, by Application 2020 & 2033
- Table 45: Spain IoT Smart Ultrasonic Proximity Sensors Revenue (undefined) Forecast, by Application 2020 & 2033
- Table 46: Spain IoT Smart Ultrasonic Proximity Sensors Volume (K) Forecast, by Application 2020 & 2033
- Table 47: Russia IoT Smart Ultrasonic Proximity Sensors Revenue (undefined) Forecast, by Application 2020 & 2033
- Table 48: Russia IoT Smart Ultrasonic Proximity Sensors Volume (K) Forecast, by Application 2020 & 2033
- Table 49: Benelux IoT Smart Ultrasonic Proximity Sensors Revenue (undefined) Forecast, by Application 2020 & 2033
- Table 50: Benelux IoT Smart Ultrasonic Proximity Sensors Volume (K) Forecast, by Application 2020 & 2033
- Table 51: Nordics IoT Smart Ultrasonic Proximity Sensors Revenue (undefined) Forecast, by Application 2020 & 2033
- Table 52: Nordics IoT Smart Ultrasonic Proximity Sensors Volume (K) Forecast, by Application 2020 & 2033
- Table 53: Rest of Europe IoT Smart Ultrasonic Proximity Sensors Revenue (undefined) Forecast, by Application 2020 & 2033
- Table 54: Rest of Europe IoT Smart Ultrasonic Proximity Sensors Volume (K) Forecast, by Application 2020 & 2033
- Table 55: Global IoT Smart Ultrasonic Proximity Sensors Revenue undefined Forecast, by Application 2020 & 2033
- Table 56: Global IoT Smart Ultrasonic Proximity Sensors Volume K Forecast, by Application 2020 & 2033
- Table 57: Global IoT Smart Ultrasonic Proximity Sensors Revenue undefined Forecast, by Types 2020 & 2033
- Table 58: Global IoT Smart Ultrasonic Proximity Sensors Volume K Forecast, by Types 2020 & 2033
- Table 59: Global IoT Smart Ultrasonic Proximity Sensors Revenue undefined Forecast, by Country 2020 & 2033
- Table 60: Global IoT Smart Ultrasonic Proximity Sensors Volume K Forecast, by Country 2020 & 2033
- Table 61: Turkey IoT Smart Ultrasonic Proximity Sensors Revenue (undefined) Forecast, by Application 2020 & 2033
- Table 62: Turkey IoT Smart Ultrasonic Proximity Sensors Volume (K) Forecast, by Application 2020 & 2033
- Table 63: Israel IoT Smart Ultrasonic Proximity Sensors Revenue (undefined) Forecast, by Application 2020 & 2033
- Table 64: Israel IoT Smart Ultrasonic Proximity Sensors Volume (K) Forecast, by Application 2020 & 2033
- Table 65: GCC IoT Smart Ultrasonic Proximity Sensors Revenue (undefined) Forecast, by Application 2020 & 2033
- Table 66: GCC IoT Smart Ultrasonic Proximity Sensors Volume (K) Forecast, by Application 2020 & 2033
- Table 67: North Africa IoT Smart Ultrasonic Proximity Sensors Revenue (undefined) Forecast, by Application 2020 & 2033
- Table 68: North Africa IoT Smart Ultrasonic Proximity Sensors Volume (K) Forecast, by Application 2020 & 2033
- Table 69: South Africa IoT Smart Ultrasonic Proximity Sensors Revenue (undefined) Forecast, by Application 2020 & 2033
- Table 70: South Africa IoT Smart Ultrasonic Proximity Sensors Volume (K) Forecast, by Application 2020 & 2033
- Table 71: Rest of Middle East & Africa IoT Smart Ultrasonic Proximity Sensors Revenue (undefined) Forecast, by Application 2020 & 2033
- Table 72: Rest of Middle East & Africa IoT Smart Ultrasonic Proximity Sensors Volume (K) Forecast, by Application 2020 & 2033
- Table 73: Global IoT Smart Ultrasonic Proximity Sensors Revenue undefined Forecast, by Application 2020 & 2033
- Table 74: Global IoT Smart Ultrasonic Proximity Sensors Volume K Forecast, by Application 2020 & 2033
- Table 75: Global IoT Smart Ultrasonic Proximity Sensors Revenue undefined Forecast, by Types 2020 & 2033
- Table 76: Global IoT Smart Ultrasonic Proximity Sensors Volume K Forecast, by Types 2020 & 2033
- Table 77: Global IoT Smart Ultrasonic Proximity Sensors Revenue undefined Forecast, by Country 2020 & 2033
- Table 78: Global IoT Smart Ultrasonic Proximity Sensors Volume K Forecast, by Country 2020 & 2033
- Table 79: China IoT Smart Ultrasonic Proximity Sensors Revenue (undefined) Forecast, by Application 2020 & 2033
- Table 80: China IoT Smart Ultrasonic Proximity Sensors Volume (K) Forecast, by Application 2020 & 2033
- Table 81: India IoT Smart Ultrasonic Proximity Sensors Revenue (undefined) Forecast, by Application 2020 & 2033
- Table 82: India IoT Smart Ultrasonic Proximity Sensors Volume (K) Forecast, by Application 2020 & 2033
- Table 83: Japan IoT Smart Ultrasonic Proximity Sensors Revenue (undefined) Forecast, by Application 2020 & 2033
- Table 84: Japan IoT Smart Ultrasonic Proximity Sensors Volume (K) Forecast, by Application 2020 & 2033
- Table 85: South Korea IoT Smart Ultrasonic Proximity Sensors Revenue (undefined) Forecast, by Application 2020 & 2033
- Table 86: South Korea IoT Smart Ultrasonic Proximity Sensors Volume (K) Forecast, by Application 2020 & 2033
- Table 87: ASEAN IoT Smart Ultrasonic Proximity Sensors Revenue (undefined) Forecast, by Application 2020 & 2033
- Table 88: ASEAN IoT Smart Ultrasonic Proximity Sensors Volume (K) Forecast, by Application 2020 & 2033
- Table 89: Oceania IoT Smart Ultrasonic Proximity Sensors Revenue (undefined) Forecast, by Application 2020 & 2033
- Table 90: Oceania IoT Smart Ultrasonic Proximity Sensors Volume (K) Forecast, by Application 2020 & 2033
- Table 91: Rest of Asia Pacific IoT Smart Ultrasonic Proximity Sensors Revenue (undefined) Forecast, by Application 2020 & 2033
- Table 92: Rest of Asia Pacific IoT Smart Ultrasonic Proximity Sensors Volume (K) Forecast, by Application 2020 & 2033
Frequently Asked Questions
1. What is the projected Compound Annual Growth Rate (CAGR) of the IoT Smart Ultrasonic Proximity Sensors?
The projected CAGR is approximately 6%.
2. Which companies are prominent players in the IoT Smart Ultrasonic Proximity Sensors?
Key companies in the market include IFM Electronic, Siemens Process Instrumentation, Pepperl+Fuchs, Rockwell Automation, Leuze Electronic, Banner Engineering, Madison Company, Balluff, Honeywell, Hans TURCK, Telemecanique Sensors, SICK, Omega Engineering, Gems Sensors & Controls, Wenglor Sensoric, Marsh Bellofram.
3. What are the main segments of the IoT Smart Ultrasonic Proximity Sensors?
The market segments include Application, Types.
4. Can you provide details about the market size?
The market size is estimated to be USD XXX N/A as of 2022.
5. What are some drivers contributing to market growth?
N/A
6. What are the notable trends driving market growth?
N/A
7. Are there any restraints impacting market growth?
N/A
8. Can you provide examples of recent developments in the market?
N/A
9. What pricing options are available for accessing the report?
Pricing options include single-user, multi-user, and enterprise licenses priced at USD 3350.00, USD 5025.00, and USD 6700.00 respectively.
10. Is the market size provided in terms of value or volume?
The market size is provided in terms of value, measured in N/A and volume, measured in K.
11. Are there any specific market keywords associated with the report?
Yes, the market keyword associated with the report is "IoT Smart Ultrasonic Proximity Sensors," which aids in identifying and referencing the specific market segment covered.
12. How do I determine which pricing option suits my needs best?
The pricing options vary based on user requirements and access needs. Individual users may opt for single-user licenses, while businesses requiring broader access may choose multi-user or enterprise licenses for cost-effective access to the report.
13. Are there any additional resources or data provided in the IoT Smart Ultrasonic Proximity Sensors report?
While the report offers comprehensive insights, it's advisable to review the specific contents or supplementary materials provided to ascertain if additional resources or data are available.
14. How can I stay updated on further developments or reports in the IoT Smart Ultrasonic Proximity Sensors?
To stay informed about further developments, trends, and reports in the IoT Smart Ultrasonic Proximity Sensors, consider subscribing to industry newsletters, following relevant companies and organizations, or regularly checking reputable industry news sources and publications.
Methodology
Step 1 - Identification of Relevant Samples Size from Population Database


Step 2 - Approaches for Defining Global Market Size (Value, Volume* & Price*)

Note*: In applicable scenarios
Step 3 - Data Sources
Primary Research
- Web Analytics
- Survey Reports
- Research Institute
- Latest Research Reports
- Opinion Leaders
Secondary Research
- Annual Reports
- White Paper
- Latest Press Release
- Industry Association
- Paid Database
- Investor Presentations

Step 4 - Data Triangulation
Involves using different sources of information in order to increase the validity of a study
These sources are likely to be stakeholders in a program - participants, other researchers, program staff, other community members, and so on.
Then we put all data in single framework & apply various statistical tools to find out the dynamic on the market.
During the analysis stage, feedback from the stakeholder groups would be compared to determine areas of agreement as well as areas of divergence