

Key Insights
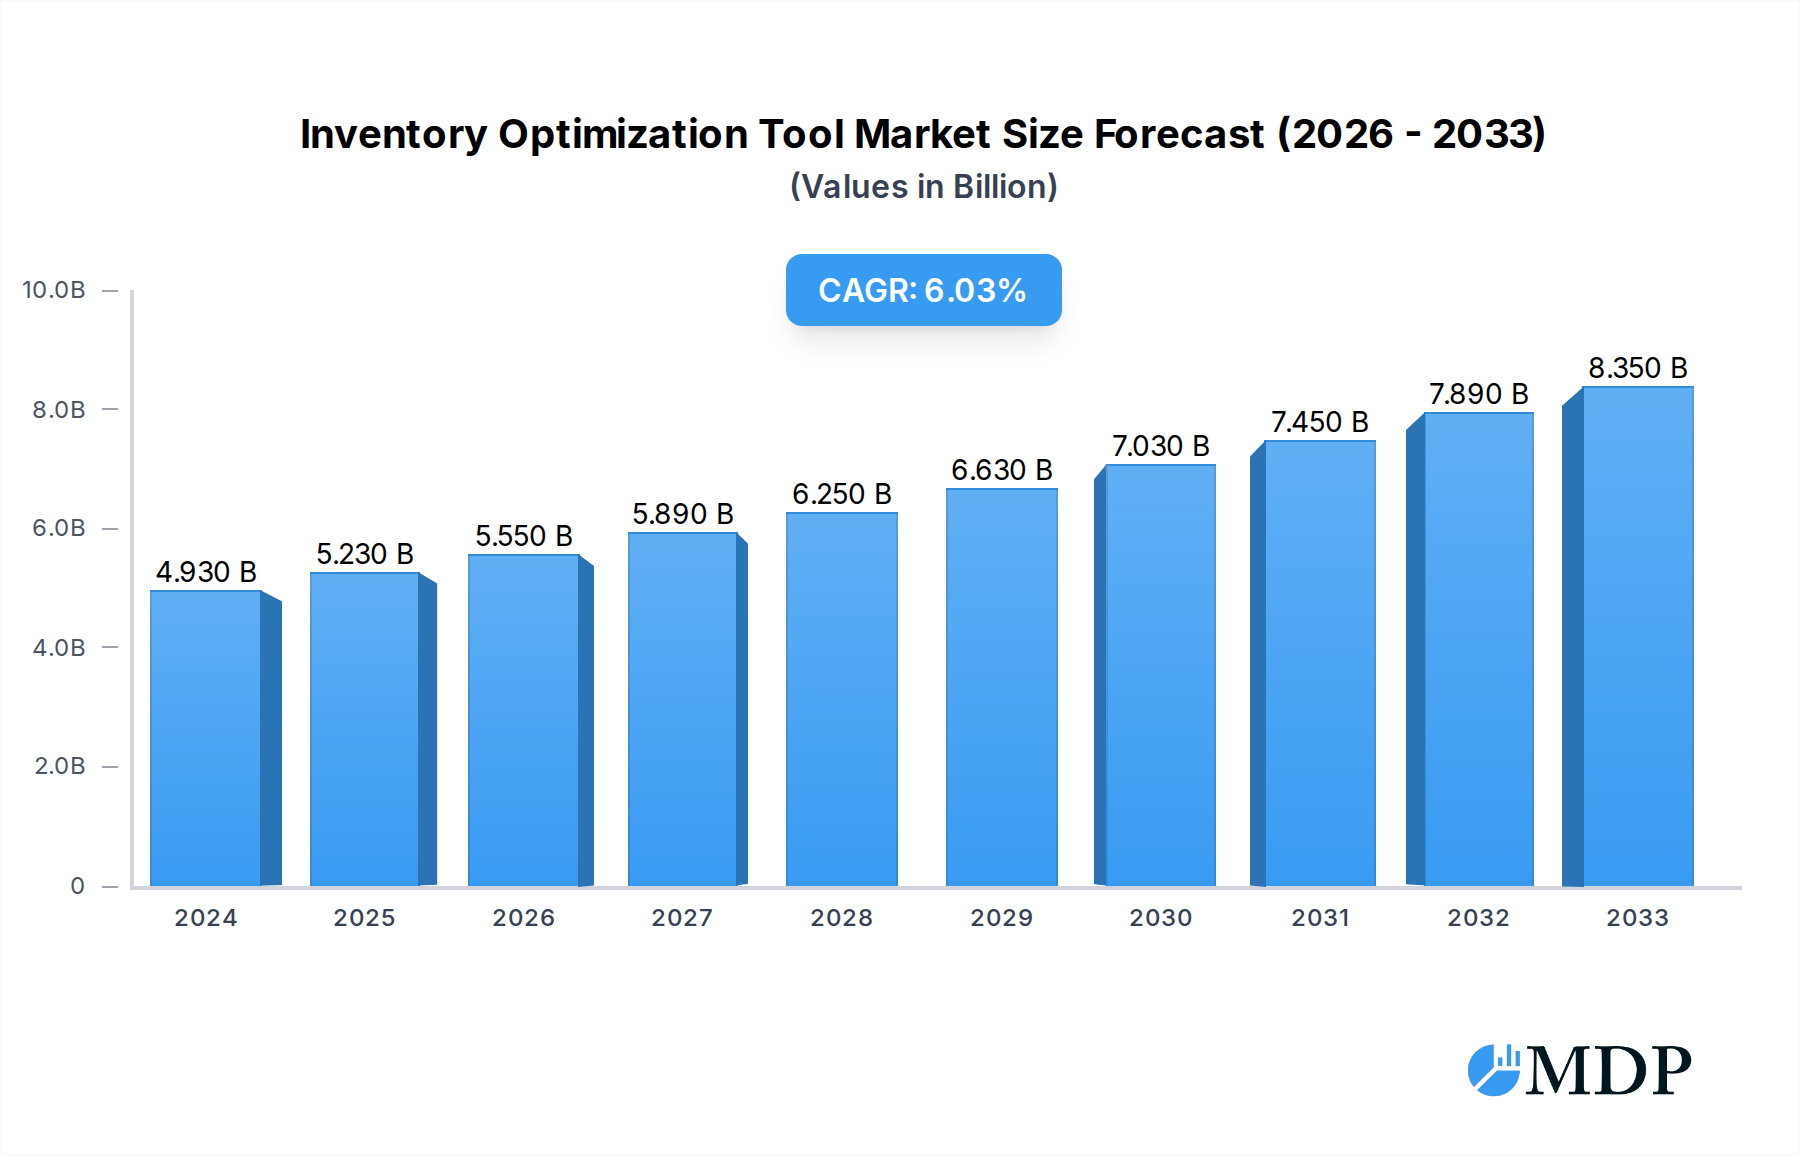
The global Inventory Optimization Tool market is poised for robust expansion, projected to reach $4.93 billion in 2024 and grow at a compelling CAGR of 6.4% through 2033. This significant growth is propelled by an increasing demand from both large enterprises and Small and Medium-sized Enterprises (SMEs) seeking to streamline their supply chains and enhance operational efficiency. The shift towards cloud-based solutions is a dominant trend, offering greater scalability, accessibility, and cost-effectiveness compared to traditional on-premises systems. Businesses are recognizing that effective inventory management is no longer just a operational necessity but a strategic imperative for profitability and competitive advantage in today's dynamic market.

Inventory Optimization Tool Market Size (In Billion)
Key drivers fueling this market's ascent include the growing complexity of global supply chains, the need to reduce carrying costs and minimize stockouts, and the rising adoption of data analytics and artificial intelligence within inventory management systems. The desire to gain real-time visibility into stock levels, forecast demand more accurately, and optimize procurement processes are critical factors pushing businesses to invest in advanced inventory optimization tools. While the market is experiencing substantial growth, potential restraints include the initial investment costs for sophisticated solutions and the challenges associated with integrating new systems with existing legacy infrastructure. However, the clear benefits of improved cash flow, enhanced customer satisfaction, and reduced waste are strongly outweighing these concerns, ensuring a positive trajectory for the Inventory Optimization Tool market.
Inventory Optimization Tool Company Market Share
Unlock unparalleled insights into the global Inventory Optimization Tool market with this definitive research report. Covering the study period of 2019–2033, this in-depth analysis provides a forward-looking perspective on market dynamics, industry trends, and strategic growth opportunities. Leveraging a base year of 2025 and an estimated year of 2025, the report delivers precise forecasts for the forecast period of 2025–2033, building upon a thorough examination of the historical period from 2019–2024. This report is an indispensable resource for large enterprises, SMEs, and all stakeholders seeking to navigate the complexities of modern inventory management solutions, from on-premises deployments to cloud-based innovations.
Inventory Optimization Tool Market Dynamics & Concentration
The global inventory optimization tool market exhibits a dynamic landscape characterized by increasing competition and evolving technological adoption. Market concentration is moderate, with several key players vying for dominance. Innovation drivers are primarily fueled by the relentless pursuit of cost reduction, enhanced supply chain efficiency, and improved customer satisfaction. Companies like Cin7, Intuit, Zoho, Fishbowl Inventory, Agiliron Inventory Management, Oracle, Zangerine, Lead Commerce, Systum, Odoo, Finale Inventory, Infoplus, Chondrion Inventory Management, TRXio, Cavallo, FlowTrac, and eTurns are at the forefront of developing advanced solutions. Regulatory frameworks, while generally supportive of market growth through standardization and data security mandates, can also present compliance challenges. Product substitutes, including manual processes and less sophisticated spreadsheet-based systems, continue to exist but are steadily being displaced by integrated inventory optimization tools. End-user trends highlight a strong preference for cloud-based solutions offering scalability and accessibility. Mergers and acquisitions (M&A) activities have played a significant role in shaping the market, with an estimated XX number of M&A deals recorded during the historical period. These consolidations aim to expand product portfolios, gain market share, and leverage synergistic capabilities, further influencing overall market concentration. Analyzing market share distribution among the leading players reveals a concentrated segment with the top players holding a significant portion of the market revenue, estimated to be in the billions of dollars.
Inventory Optimization Tool Industry Trends & Analysis
The inventory optimization tool industry is poised for substantial growth, driven by a confluence of factors and technological advancements. The overarching market growth driver is the persistent need for businesses across all sectors to minimize carrying costs, reduce stockouts, and enhance operational efficiency in an increasingly complex global supply chain. Technological disruptions are fundamentally reshaping the market, with the integration of Artificial Intelligence (AI) and Machine Learning (ML) enabling predictive analytics for demand forecasting, automated reordering, and dynamic pricing strategies. The market penetration of these advanced features is steadily increasing, projected to reach XX% by 2033. Consumer preferences are increasingly dictating inventory strategies, with a demand for faster delivery times and greater product availability pushing businesses to adopt more sophisticated inventory management systems. Competitive dynamics are intensifying, characterized by fierce price competition, a focus on value-added services, and continuous product innovation. The Compound Annual Growth Rate (CAGR) for the inventory optimization tool market is robust, estimated at XX% over the forecast period. This growth is further amplified by the digital transformation initiatives underway in numerous industries, compelling organizations to invest in solutions that provide real-time visibility and control over their inventory. The increasing adoption of Internet of Things (IoT) devices for real-time tracking and the emergence of sophisticated data analytics platforms are also contributing significantly to market expansion. The report delves deep into these trends, providing actionable insights on how to capitalize on emerging opportunities and mitigate potential challenges. The market is expected to see revenue figures in the hundreds of billions of dollars by the end of the forecast period.
Leading Markets & Segments in Inventory Optimization Tool
The inventory optimization tool market is dominated by Large Enterprises which represent the largest segment by revenue, accounting for an estimated XX% of the total market share in the base year. This dominance is driven by the complex inventory requirements and significant financial investments these organizations can make in sophisticated solutions. The SMEs segment, however, is exhibiting a higher CAGR, indicating substantial future growth potential as more small and medium-sized businesses recognize the critical need for efficient inventory management. In terms of technology type, Cloud Based solutions are rapidly outpacing On-premises deployments, capturing an estimated XX% market share by 2025. Key drivers for the dominance of cloud-based solutions include their scalability, flexibility, reduced upfront costs, and ease of integration with other business applications. For example, the increasing adoption of Software-as-a-Service (SaaS) models has made powerful inventory optimization tools accessible to a wider range of businesses, irrespective of their IT infrastructure.
- Dominant Region: North America is currently the leading market, holding approximately XX% of the global market share. This is attributed to a mature economy, a high rate of technological adoption, and the presence of a significant number of large enterprises across diverse industries such as retail, manufacturing, and e-commerce.
- Key Drivers for Large Enterprises Dominance:
- Need for complex multi-location inventory management.
- Requirement for advanced forecasting and demand planning capabilities.
- Integration with enterprise resource planning (ERP) systems.
- Higher budget allocation for technology investments.
- Key Drivers for Cloud-Based Solutions Dominance:
- Scalability to accommodate fluctuating business needs.
- Remote accessibility and collaboration features.
- Lower total cost of ownership (TCO) compared to on-premises solutions.
- Faster deployment and implementation timelines.
- Automatic updates and maintenance provided by vendors.
The detailed analysis within the report examines the nuances of these segments and regions, offering granular insights into market penetration, growth drivers, and competitive landscapes, with market revenue in these segments projected to reach billions of dollars.
Inventory Optimization Tool Product Developments
Product development in the inventory optimization tool market is characterized by a strong emphasis on intelligent automation and data-driven insights. Innovations are focused on enhancing predictive analytics for more accurate demand forecasting, integrating AI for dynamic stock level adjustments, and improving real-time visibility across the entire supply chain. Competitive advantages are being carved out through seamless integration capabilities with e-commerce platforms, ERP systems, and other business software. The trend towards user-friendly interfaces and customizable dashboards empowers businesses to tailor solutions to their specific operational needs. Furthermore, the development of advanced reporting features provides deeper insights into inventory performance, helping companies identify bottlenecks and optimize procurement strategies, thereby impacting market value projected in the billions of dollars.
Key Drivers of Inventory Optimization Tool Growth
Several key factors are propelling the growth of the inventory optimization tool market. Technologically, the widespread adoption of cloud computing and the advancements in AI and Machine Learning are enabling more sophisticated and accessible inventory management solutions. Economically, the ongoing global e-commerce boom and the increasing emphasis on supply chain resilience are creating a heightened demand for tools that can efficiently manage vast and complex inventories. Regulatory factors, such as evolving trade regulations and the need for greater supply chain transparency, also indirectly stimulate the adoption of robust inventory optimization tools. For instance, the need to comply with increasingly stringent inventory tracking and reporting standards is pushing businesses to invest in advanced systems, contributing to market growth estimated in the billions of dollars.
Challenges in the Inventory Optimization Tool Market
Despite robust growth, the inventory optimization tool market faces several significant challenges. Regulatory hurdles, particularly concerning data privacy and cross-border data transfer, can complicate the implementation and operation of cloud-based solutions for global businesses. Supply chain disruptions, exacerbated by geopolitical events and natural disasters, create volatility that can strain even the most advanced optimization tools, leading to potential financial losses running into billions of dollars. Competitive pressures are intense, with a crowded market leading to price wars and demanding continuous innovation. Furthermore, the initial cost of implementation and the complexity of integrating new systems with existing legacy infrastructure can be a barrier for some organizations, particularly SMEs.
Emerging Opportunities in Inventory Optimization Tool
The inventory optimization tool market is ripe with emerging opportunities driven by technological breakthroughs and evolving business strategies. The increasing adoption of IoT devices offers a significant avenue for real-time inventory tracking and data capture, enabling more granular optimization. Strategic partnerships between software vendors and hardware providers can lead to integrated end-to-end solutions. Furthermore, the growing demand for sustainable supply chains presents an opportunity for tools that can optimize inventory to minimize waste and reduce carbon footprint. Expansion into underdeveloped markets and the development of industry-specific solutions tailored to niche sectors will also fuel long-term growth, with potential market value reaching billions of dollars.
Leading Players in the Inventory Optimization Tool Sector
- Cin7
- Intuit
- Zoho
- Fishbowl Inventory
- Agiliron Inventory Management
- Oracle
- Zangerine
- Lead Commerce
- Systum
- Odoo
- Finale Inventory
- Infoplus
- Chondrion Inventory Management
- TRXio
- Cavallo
- FlowTrac
- eTurns
Key Milestones in Inventory Optimization Tool Industry
- 2019: Increased adoption of AI-powered demand forecasting in inventory management solutions.
- 2020: Significant surge in cloud-based inventory optimization tool adoption due to remote work trends.
- 2021: Emergence of advanced real-time inventory tracking solutions leveraging IoT technology.
- 2022: Major players begin integrating blockchain for enhanced supply chain transparency.
- 2023: Introduction of sustainability-focused inventory optimization features to reduce waste.
- 2024: Expansion of predictive maintenance capabilities within inventory management software.
- 2025 (Estimated): Continued growth in the SaaS model, making advanced tools more accessible.
- 2026-2033: Expected integration of generative AI for more dynamic and adaptive inventory strategies.
Strategic Outlook for Inventory Optimization Tool Market
The strategic outlook for the inventory optimization tool market is exceptionally promising, driven by continued digital transformation and the increasing complexity of global supply chains. Growth accelerators include the further integration of advanced analytics, AI, and IoT to create hyper-personalized and autonomous inventory management systems. The expansion of cloud-based offerings and the development of niche solutions for specific industries will broaden market reach. Strategic partnerships and a focus on user experience will be crucial for retaining competitive advantage. The market is set to experience sustained growth, reaching substantial valuations in the billions of dollars, as businesses across all sectors prioritize efficiency, resilience, and customer satisfaction in their inventory operations.
Inventory Optimization Tool Segmentation
-
1. Application
- 1.1. Large Enterprises
- 1.2. SMEs
-
2. Types
- 2.1. On-premises
- 2.2. Cloud Based
Inventory Optimization Tool Segmentation By Geography
-
1. North America
- 1.1. United States
- 1.2. Canada
- 1.3. Mexico
-
2. South America
- 2.1. Brazil
- 2.2. Argentina
- 2.3. Rest of South America
-
3. Europe
- 3.1. United Kingdom
- 3.2. Germany
- 3.3. France
- 3.4. Italy
- 3.5. Spain
- 3.6. Russia
- 3.7. Benelux
- 3.8. Nordics
- 3.9. Rest of Europe
-
4. Middle East & Africa
- 4.1. Turkey
- 4.2. Israel
- 4.3. GCC
- 4.4. North Africa
- 4.5. South Africa
- 4.6. Rest of Middle East & Africa
-
5. Asia Pacific
- 5.1. China
- 5.2. India
- 5.3. Japan
- 5.4. South Korea
- 5.5. ASEAN
- 5.6. Oceania
- 5.7. Rest of Asia Pacific
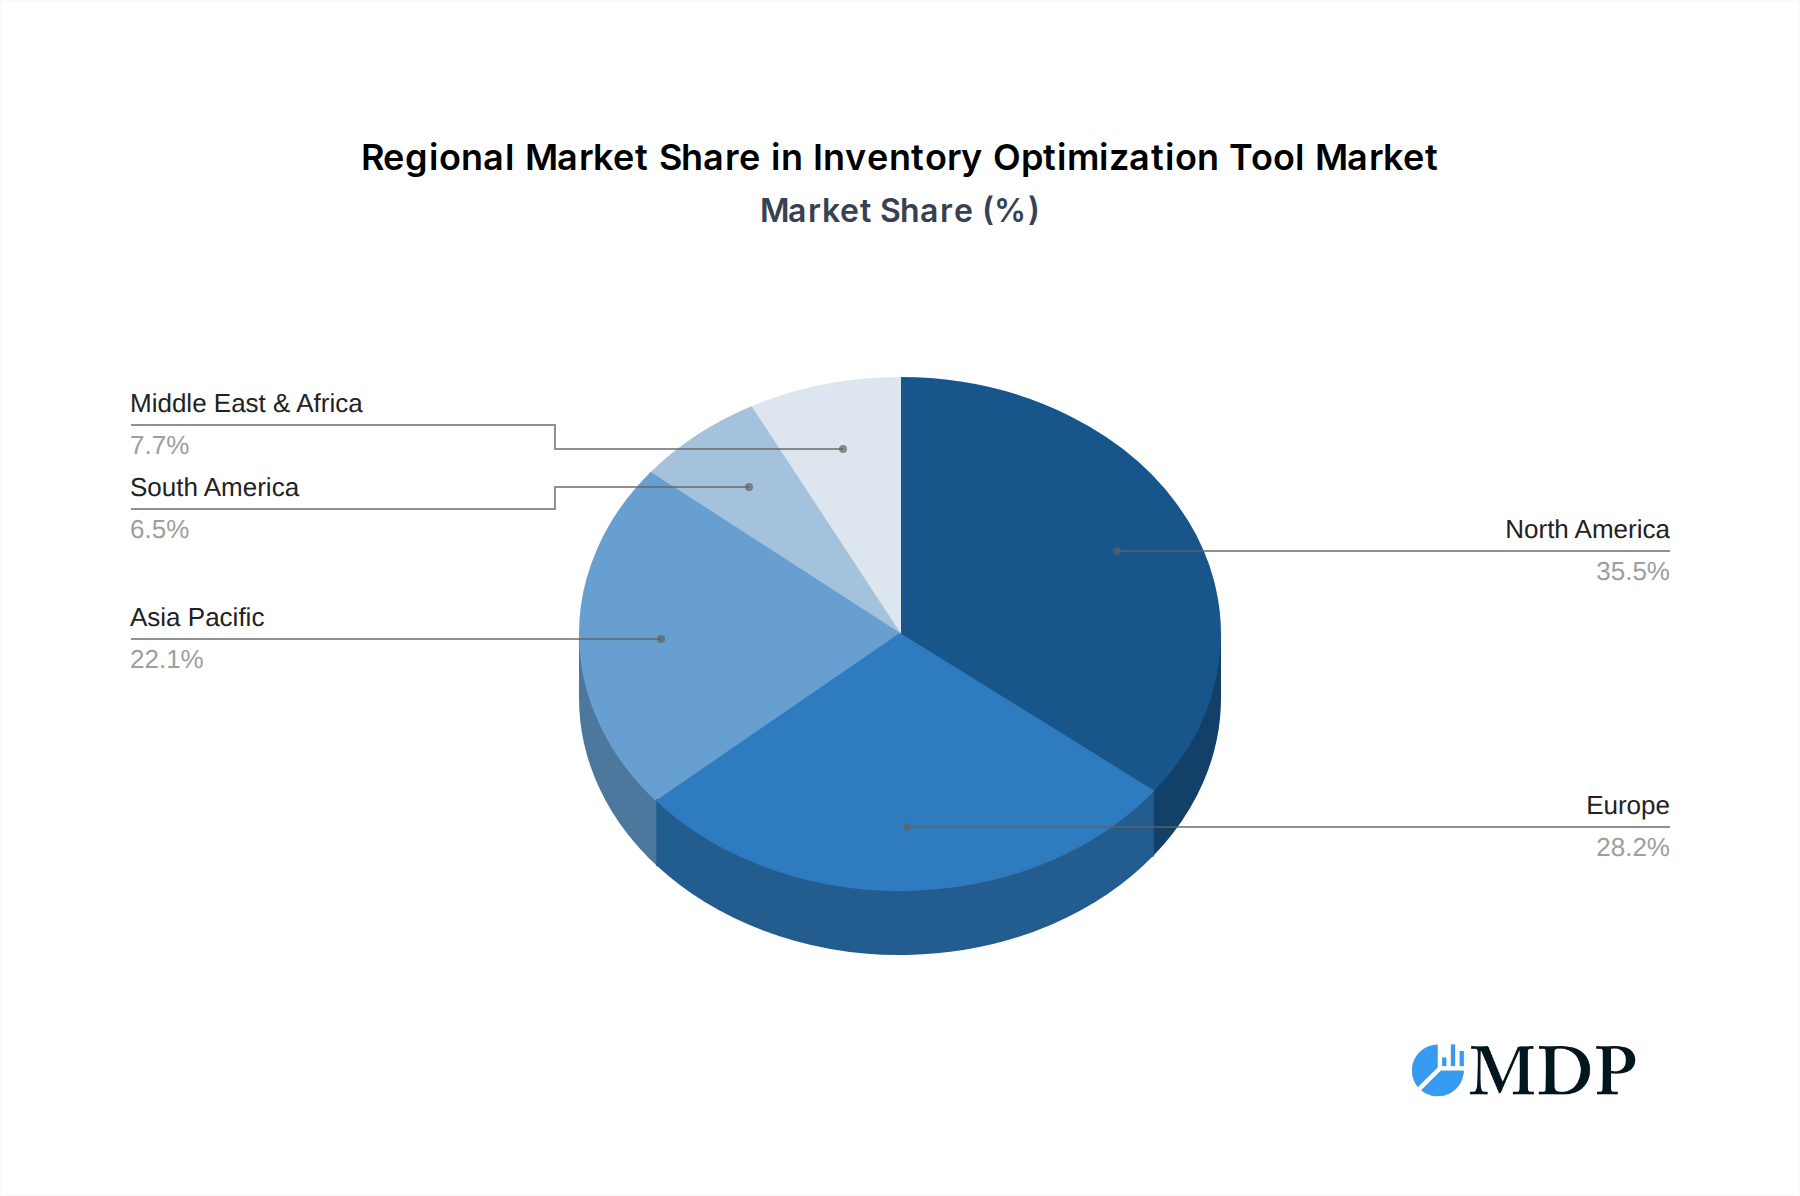
Inventory Optimization Tool Regional Market Share
Geographic Coverage of Inventory Optimization Tool
Inventory Optimization Tool REPORT HIGHLIGHTS
| Aspects | Details |
|---|---|
| Study Period | 2020-2034 |
| Base Year | 2025 |
| Estimated Year | 2026 |
| Forecast Period | 2026-2034 |
| Historical Period | 2020-2025 |
| Growth Rate | CAGR of 6.4% from 2020-2034 |
| Segmentation |
|
Table of Contents
- 1. Introduction
- 1.1. Research Scope
- 1.2. Market Segmentation
- 1.3. Research Methodology
- 1.4. Definitions and Assumptions
- 2. Executive Summary
- 2.1. Introduction
- 3. Market Dynamics
- 3.1. Introduction
- 3.2. Market Drivers
- 3.3. Market Restrains
- 3.4. Market Trends
- 4. Market Factor Analysis
- 4.1. Porters Five Forces
- 4.2. Supply/Value Chain
- 4.3. PESTEL analysis
- 4.4. Market Entropy
- 4.5. Patent/Trademark Analysis
- 5. Global Inventory Optimization Tool Analysis, Insights and Forecast, 2020-2032
- 5.1. Market Analysis, Insights and Forecast - by Application
- 5.1.1. Large Enterprises
- 5.1.2. SMEs
- 5.2. Market Analysis, Insights and Forecast - by Types
- 5.2.1. On-premises
- 5.2.2. Cloud Based
- 5.3. Market Analysis, Insights and Forecast - by Region
- 5.3.1. North America
- 5.3.2. South America
- 5.3.3. Europe
- 5.3.4. Middle East & Africa
- 5.3.5. Asia Pacific
- 5.1. Market Analysis, Insights and Forecast - by Application
- 6. North America Inventory Optimization Tool Analysis, Insights and Forecast, 2020-2032
- 6.1. Market Analysis, Insights and Forecast - by Application
- 6.1.1. Large Enterprises
- 6.1.2. SMEs
- 6.2. Market Analysis, Insights and Forecast - by Types
- 6.2.1. On-premises
- 6.2.2. Cloud Based
- 6.1. Market Analysis, Insights and Forecast - by Application
- 7. South America Inventory Optimization Tool Analysis, Insights and Forecast, 2020-2032
- 7.1. Market Analysis, Insights and Forecast - by Application
- 7.1.1. Large Enterprises
- 7.1.2. SMEs
- 7.2. Market Analysis, Insights and Forecast - by Types
- 7.2.1. On-premises
- 7.2.2. Cloud Based
- 7.1. Market Analysis, Insights and Forecast - by Application
- 8. Europe Inventory Optimization Tool Analysis, Insights and Forecast, 2020-2032
- 8.1. Market Analysis, Insights and Forecast - by Application
- 8.1.1. Large Enterprises
- 8.1.2. SMEs
- 8.2. Market Analysis, Insights and Forecast - by Types
- 8.2.1. On-premises
- 8.2.2. Cloud Based
- 8.1. Market Analysis, Insights and Forecast - by Application
- 9. Middle East & Africa Inventory Optimization Tool Analysis, Insights and Forecast, 2020-2032
- 9.1. Market Analysis, Insights and Forecast - by Application
- 9.1.1. Large Enterprises
- 9.1.2. SMEs
- 9.2. Market Analysis, Insights and Forecast - by Types
- 9.2.1. On-premises
- 9.2.2. Cloud Based
- 9.1. Market Analysis, Insights and Forecast - by Application
- 10. Asia Pacific Inventory Optimization Tool Analysis, Insights and Forecast, 2020-2032
- 10.1. Market Analysis, Insights and Forecast - by Application
- 10.1.1. Large Enterprises
- 10.1.2. SMEs
- 10.2. Market Analysis, Insights and Forecast - by Types
- 10.2.1. On-premises
- 10.2.2. Cloud Based
- 10.1. Market Analysis, Insights and Forecast - by Application
- 11. Competitive Analysis
- 11.1. Global Market Share Analysis 2025
- 11.2. Company Profiles
- 11.2.1 Cin7
- 11.2.1.1. Overview
- 11.2.1.2. Products
- 11.2.1.3. SWOT Analysis
- 11.2.1.4. Recent Developments
- 11.2.1.5. Financials (Based on Availability)
- 11.2.2 Intuit
- 11.2.2.1. Overview
- 11.2.2.2. Products
- 11.2.2.3. SWOT Analysis
- 11.2.2.4. Recent Developments
- 11.2.2.5. Financials (Based on Availability)
- 11.2.3 Zoho
- 11.2.3.1. Overview
- 11.2.3.2. Products
- 11.2.3.3. SWOT Analysis
- 11.2.3.4. Recent Developments
- 11.2.3.5. Financials (Based on Availability)
- 11.2.4 Fishbowl Inventory
- 11.2.4.1. Overview
- 11.2.4.2. Products
- 11.2.4.3. SWOT Analysis
- 11.2.4.4. Recent Developments
- 11.2.4.5. Financials (Based on Availability)
- 11.2.5 Agiliron Inventory Management
- 11.2.5.1. Overview
- 11.2.5.2. Products
- 11.2.5.3. SWOT Analysis
- 11.2.5.4. Recent Developments
- 11.2.5.5. Financials (Based on Availability)
- 11.2.6 Oracle
- 11.2.6.1. Overview
- 11.2.6.2. Products
- 11.2.6.3. SWOT Analysis
- 11.2.6.4. Recent Developments
- 11.2.6.5. Financials (Based on Availability)
- 11.2.7 Zangerine
- 11.2.7.1. Overview
- 11.2.7.2. Products
- 11.2.7.3. SWOT Analysis
- 11.2.7.4. Recent Developments
- 11.2.7.5. Financials (Based on Availability)
- 11.2.8 Lead Commerce
- 11.2.8.1. Overview
- 11.2.8.2. Products
- 11.2.8.3. SWOT Analysis
- 11.2.8.4. Recent Developments
- 11.2.8.5. Financials (Based on Availability)
- 11.2.9 Systum
- 11.2.9.1. Overview
- 11.2.9.2. Products
- 11.2.9.3. SWOT Analysis
- 11.2.9.4. Recent Developments
- 11.2.9.5. Financials (Based on Availability)
- 11.2.10 Odoo
- 11.2.10.1. Overview
- 11.2.10.2. Products
- 11.2.10.3. SWOT Analysis
- 11.2.10.4. Recent Developments
- 11.2.10.5. Financials (Based on Availability)
- 11.2.11 Finale Inventory
- 11.2.11.1. Overview
- 11.2.11.2. Products
- 11.2.11.3. SWOT Analysis
- 11.2.11.4. Recent Developments
- 11.2.11.5. Financials (Based on Availability)
- 11.2.12 Infoplus
- 11.2.12.1. Overview
- 11.2.12.2. Products
- 11.2.12.3. SWOT Analysis
- 11.2.12.4. Recent Developments
- 11.2.12.5. Financials (Based on Availability)
- 11.2.13 Chondrion Inventory Management
- 11.2.13.1. Overview
- 11.2.13.2. Products
- 11.2.13.3. SWOT Analysis
- 11.2.13.4. Recent Developments
- 11.2.13.5. Financials (Based on Availability)
- 11.2.14 TRXio
- 11.2.14.1. Overview
- 11.2.14.2. Products
- 11.2.14.3. SWOT Analysis
- 11.2.14.4. Recent Developments
- 11.2.14.5. Financials (Based on Availability)
- 11.2.15 Cavallo
- 11.2.15.1. Overview
- 11.2.15.2. Products
- 11.2.15.3. SWOT Analysis
- 11.2.15.4. Recent Developments
- 11.2.15.5. Financials (Based on Availability)
- 11.2.16 FlowTrac
- 11.2.16.1. Overview
- 11.2.16.2. Products
- 11.2.16.3. SWOT Analysis
- 11.2.16.4. Recent Developments
- 11.2.16.5. Financials (Based on Availability)
- 11.2.17 eTurns
- 11.2.17.1. Overview
- 11.2.17.2. Products
- 11.2.17.3. SWOT Analysis
- 11.2.17.4. Recent Developments
- 11.2.17.5. Financials (Based on Availability)
- 11.2.1 Cin7
List of Figures
- Figure 1: Global Inventory Optimization Tool Revenue Breakdown (undefined, %) by Region 2025 & 2033
- Figure 2: North America Inventory Optimization Tool Revenue (undefined), by Application 2025 & 2033
- Figure 3: North America Inventory Optimization Tool Revenue Share (%), by Application 2025 & 2033
- Figure 4: North America Inventory Optimization Tool Revenue (undefined), by Types 2025 & 2033
- Figure 5: North America Inventory Optimization Tool Revenue Share (%), by Types 2025 & 2033
- Figure 6: North America Inventory Optimization Tool Revenue (undefined), by Country 2025 & 2033
- Figure 7: North America Inventory Optimization Tool Revenue Share (%), by Country 2025 & 2033
- Figure 8: South America Inventory Optimization Tool Revenue (undefined), by Application 2025 & 2033
- Figure 9: South America Inventory Optimization Tool Revenue Share (%), by Application 2025 & 2033
- Figure 10: South America Inventory Optimization Tool Revenue (undefined), by Types 2025 & 2033
- Figure 11: South America Inventory Optimization Tool Revenue Share (%), by Types 2025 & 2033
- Figure 12: South America Inventory Optimization Tool Revenue (undefined), by Country 2025 & 2033
- Figure 13: South America Inventory Optimization Tool Revenue Share (%), by Country 2025 & 2033
- Figure 14: Europe Inventory Optimization Tool Revenue (undefined), by Application 2025 & 2033
- Figure 15: Europe Inventory Optimization Tool Revenue Share (%), by Application 2025 & 2033
- Figure 16: Europe Inventory Optimization Tool Revenue (undefined), by Types 2025 & 2033
- Figure 17: Europe Inventory Optimization Tool Revenue Share (%), by Types 2025 & 2033
- Figure 18: Europe Inventory Optimization Tool Revenue (undefined), by Country 2025 & 2033
- Figure 19: Europe Inventory Optimization Tool Revenue Share (%), by Country 2025 & 2033
- Figure 20: Middle East & Africa Inventory Optimization Tool Revenue (undefined), by Application 2025 & 2033
- Figure 21: Middle East & Africa Inventory Optimization Tool Revenue Share (%), by Application 2025 & 2033
- Figure 22: Middle East & Africa Inventory Optimization Tool Revenue (undefined), by Types 2025 & 2033
- Figure 23: Middle East & Africa Inventory Optimization Tool Revenue Share (%), by Types 2025 & 2033
- Figure 24: Middle East & Africa Inventory Optimization Tool Revenue (undefined), by Country 2025 & 2033
- Figure 25: Middle East & Africa Inventory Optimization Tool Revenue Share (%), by Country 2025 & 2033
- Figure 26: Asia Pacific Inventory Optimization Tool Revenue (undefined), by Application 2025 & 2033
- Figure 27: Asia Pacific Inventory Optimization Tool Revenue Share (%), by Application 2025 & 2033
- Figure 28: Asia Pacific Inventory Optimization Tool Revenue (undefined), by Types 2025 & 2033
- Figure 29: Asia Pacific Inventory Optimization Tool Revenue Share (%), by Types 2025 & 2033
- Figure 30: Asia Pacific Inventory Optimization Tool Revenue (undefined), by Country 2025 & 2033
- Figure 31: Asia Pacific Inventory Optimization Tool Revenue Share (%), by Country 2025 & 2033
List of Tables
- Table 1: Global Inventory Optimization Tool Revenue undefined Forecast, by Application 2020 & 2033
- Table 2: Global Inventory Optimization Tool Revenue undefined Forecast, by Types 2020 & 2033
- Table 3: Global Inventory Optimization Tool Revenue undefined Forecast, by Region 2020 & 2033
- Table 4: Global Inventory Optimization Tool Revenue undefined Forecast, by Application 2020 & 2033
- Table 5: Global Inventory Optimization Tool Revenue undefined Forecast, by Types 2020 & 2033
- Table 6: Global Inventory Optimization Tool Revenue undefined Forecast, by Country 2020 & 2033
- Table 7: United States Inventory Optimization Tool Revenue (undefined) Forecast, by Application 2020 & 2033
- Table 8: Canada Inventory Optimization Tool Revenue (undefined) Forecast, by Application 2020 & 2033
- Table 9: Mexico Inventory Optimization Tool Revenue (undefined) Forecast, by Application 2020 & 2033
- Table 10: Global Inventory Optimization Tool Revenue undefined Forecast, by Application 2020 & 2033
- Table 11: Global Inventory Optimization Tool Revenue undefined Forecast, by Types 2020 & 2033
- Table 12: Global Inventory Optimization Tool Revenue undefined Forecast, by Country 2020 & 2033
- Table 13: Brazil Inventory Optimization Tool Revenue (undefined) Forecast, by Application 2020 & 2033
- Table 14: Argentina Inventory Optimization Tool Revenue (undefined) Forecast, by Application 2020 & 2033
- Table 15: Rest of South America Inventory Optimization Tool Revenue (undefined) Forecast, by Application 2020 & 2033
- Table 16: Global Inventory Optimization Tool Revenue undefined Forecast, by Application 2020 & 2033
- Table 17: Global Inventory Optimization Tool Revenue undefined Forecast, by Types 2020 & 2033
- Table 18: Global Inventory Optimization Tool Revenue undefined Forecast, by Country 2020 & 2033
- Table 19: United Kingdom Inventory Optimization Tool Revenue (undefined) Forecast, by Application 2020 & 2033
- Table 20: Germany Inventory Optimization Tool Revenue (undefined) Forecast, by Application 2020 & 2033
- Table 21: France Inventory Optimization Tool Revenue (undefined) Forecast, by Application 2020 & 2033
- Table 22: Italy Inventory Optimization Tool Revenue (undefined) Forecast, by Application 2020 & 2033
- Table 23: Spain Inventory Optimization Tool Revenue (undefined) Forecast, by Application 2020 & 2033
- Table 24: Russia Inventory Optimization Tool Revenue (undefined) Forecast, by Application 2020 & 2033
- Table 25: Benelux Inventory Optimization Tool Revenue (undefined) Forecast, by Application 2020 & 2033
- Table 26: Nordics Inventory Optimization Tool Revenue (undefined) Forecast, by Application 2020 & 2033
- Table 27: Rest of Europe Inventory Optimization Tool Revenue (undefined) Forecast, by Application 2020 & 2033
- Table 28: Global Inventory Optimization Tool Revenue undefined Forecast, by Application 2020 & 2033
- Table 29: Global Inventory Optimization Tool Revenue undefined Forecast, by Types 2020 & 2033
- Table 30: Global Inventory Optimization Tool Revenue undefined Forecast, by Country 2020 & 2033
- Table 31: Turkey Inventory Optimization Tool Revenue (undefined) Forecast, by Application 2020 & 2033
- Table 32: Israel Inventory Optimization Tool Revenue (undefined) Forecast, by Application 2020 & 2033
- Table 33: GCC Inventory Optimization Tool Revenue (undefined) Forecast, by Application 2020 & 2033
- Table 34: North Africa Inventory Optimization Tool Revenue (undefined) Forecast, by Application 2020 & 2033
- Table 35: South Africa Inventory Optimization Tool Revenue (undefined) Forecast, by Application 2020 & 2033
- Table 36: Rest of Middle East & Africa Inventory Optimization Tool Revenue (undefined) Forecast, by Application 2020 & 2033
- Table 37: Global Inventory Optimization Tool Revenue undefined Forecast, by Application 2020 & 2033
- Table 38: Global Inventory Optimization Tool Revenue undefined Forecast, by Types 2020 & 2033
- Table 39: Global Inventory Optimization Tool Revenue undefined Forecast, by Country 2020 & 2033
- Table 40: China Inventory Optimization Tool Revenue (undefined) Forecast, by Application 2020 & 2033
- Table 41: India Inventory Optimization Tool Revenue (undefined) Forecast, by Application 2020 & 2033
- Table 42: Japan Inventory Optimization Tool Revenue (undefined) Forecast, by Application 2020 & 2033
- Table 43: South Korea Inventory Optimization Tool Revenue (undefined) Forecast, by Application 2020 & 2033
- Table 44: ASEAN Inventory Optimization Tool Revenue (undefined) Forecast, by Application 2020 & 2033
- Table 45: Oceania Inventory Optimization Tool Revenue (undefined) Forecast, by Application 2020 & 2033
- Table 46: Rest of Asia Pacific Inventory Optimization Tool Revenue (undefined) Forecast, by Application 2020 & 2033
Frequently Asked Questions
1. What is the projected Compound Annual Growth Rate (CAGR) of the Inventory Optimization Tool?
The projected CAGR is approximately 6.4%.
2. Which companies are prominent players in the Inventory Optimization Tool?
Key companies in the market include Cin7, Intuit, Zoho, Fishbowl Inventory, Agiliron Inventory Management, Oracle, Zangerine, Lead Commerce, Systum, Odoo, Finale Inventory, Infoplus, Chondrion Inventory Management, TRXio, Cavallo, FlowTrac, eTurns.
3. What are the main segments of the Inventory Optimization Tool?
The market segments include Application, Types.
4. Can you provide details about the market size?
The market size is estimated to be USD XXX N/A as of 2022.
5. What are some drivers contributing to market growth?
N/A
6. What are the notable trends driving market growth?
N/A
7. Are there any restraints impacting market growth?
N/A
8. Can you provide examples of recent developments in the market?
N/A
9. What pricing options are available for accessing the report?
Pricing options include single-user, multi-user, and enterprise licenses priced at USD 3950.00, USD 5925.00, and USD 7900.00 respectively.
10. Is the market size provided in terms of value or volume?
The market size is provided in terms of value, measured in N/A.
11. Are there any specific market keywords associated with the report?
Yes, the market keyword associated with the report is "Inventory Optimization Tool," which aids in identifying and referencing the specific market segment covered.
12. How do I determine which pricing option suits my needs best?
The pricing options vary based on user requirements and access needs. Individual users may opt for single-user licenses, while businesses requiring broader access may choose multi-user or enterprise licenses for cost-effective access to the report.
13. Are there any additional resources or data provided in the Inventory Optimization Tool report?
While the report offers comprehensive insights, it's advisable to review the specific contents or supplementary materials provided to ascertain if additional resources or data are available.
14. How can I stay updated on further developments or reports in the Inventory Optimization Tool?
To stay informed about further developments, trends, and reports in the Inventory Optimization Tool, consider subscribing to industry newsletters, following relevant companies and organizations, or regularly checking reputable industry news sources and publications.
Methodology
Step 1 - Identification of Relevant Samples Size from Population Database


Step 2 - Approaches for Defining Global Market Size (Value, Volume* & Price*)

Note*: In applicable scenarios
Step 3 - Data Sources
Primary Research
- Web Analytics
- Survey Reports
- Research Institute
- Latest Research Reports
- Opinion Leaders
Secondary Research
- Annual Reports
- White Paper
- Latest Press Release
- Industry Association
- Paid Database
- Investor Presentations

Step 4 - Data Triangulation
Involves using different sources of information in order to increase the validity of a study
These sources are likely to be stakeholders in a program - participants, other researchers, program staff, other community members, and so on.
Then we put all data in single framework & apply various statistical tools to find out the dynamic on the market.
During the analysis stage, feedback from the stakeholder groups would be compared to determine areas of agreement as well as areas of divergence