

Key Insights
The global interactive smartboard market is poised for significant expansion, projected to reach $5.6 billion by 2025, with a robust compound annual growth rate (CAGR) of 9.7%. This impressive growth trajectory is primarily propelled by the increasing adoption of digital learning tools in educational institutions worldwide, coupled with the surging demand for collaborative and efficient communication solutions in the corporate sector. The pandemic further accelerated the integration of smartboards for remote learning and hybrid work models, solidifying their role as essential technology. Governments are also increasingly investing in smart classrooms and public information displays, contributing to market expansion. Key applications driving this growth include education, where smartboards enhance engagement and interactivity, and business, where they facilitate dynamic presentations and team collaboration. The household segment is also emerging as a niche but growing area for smartboards, offering advanced entertainment and productivity features.
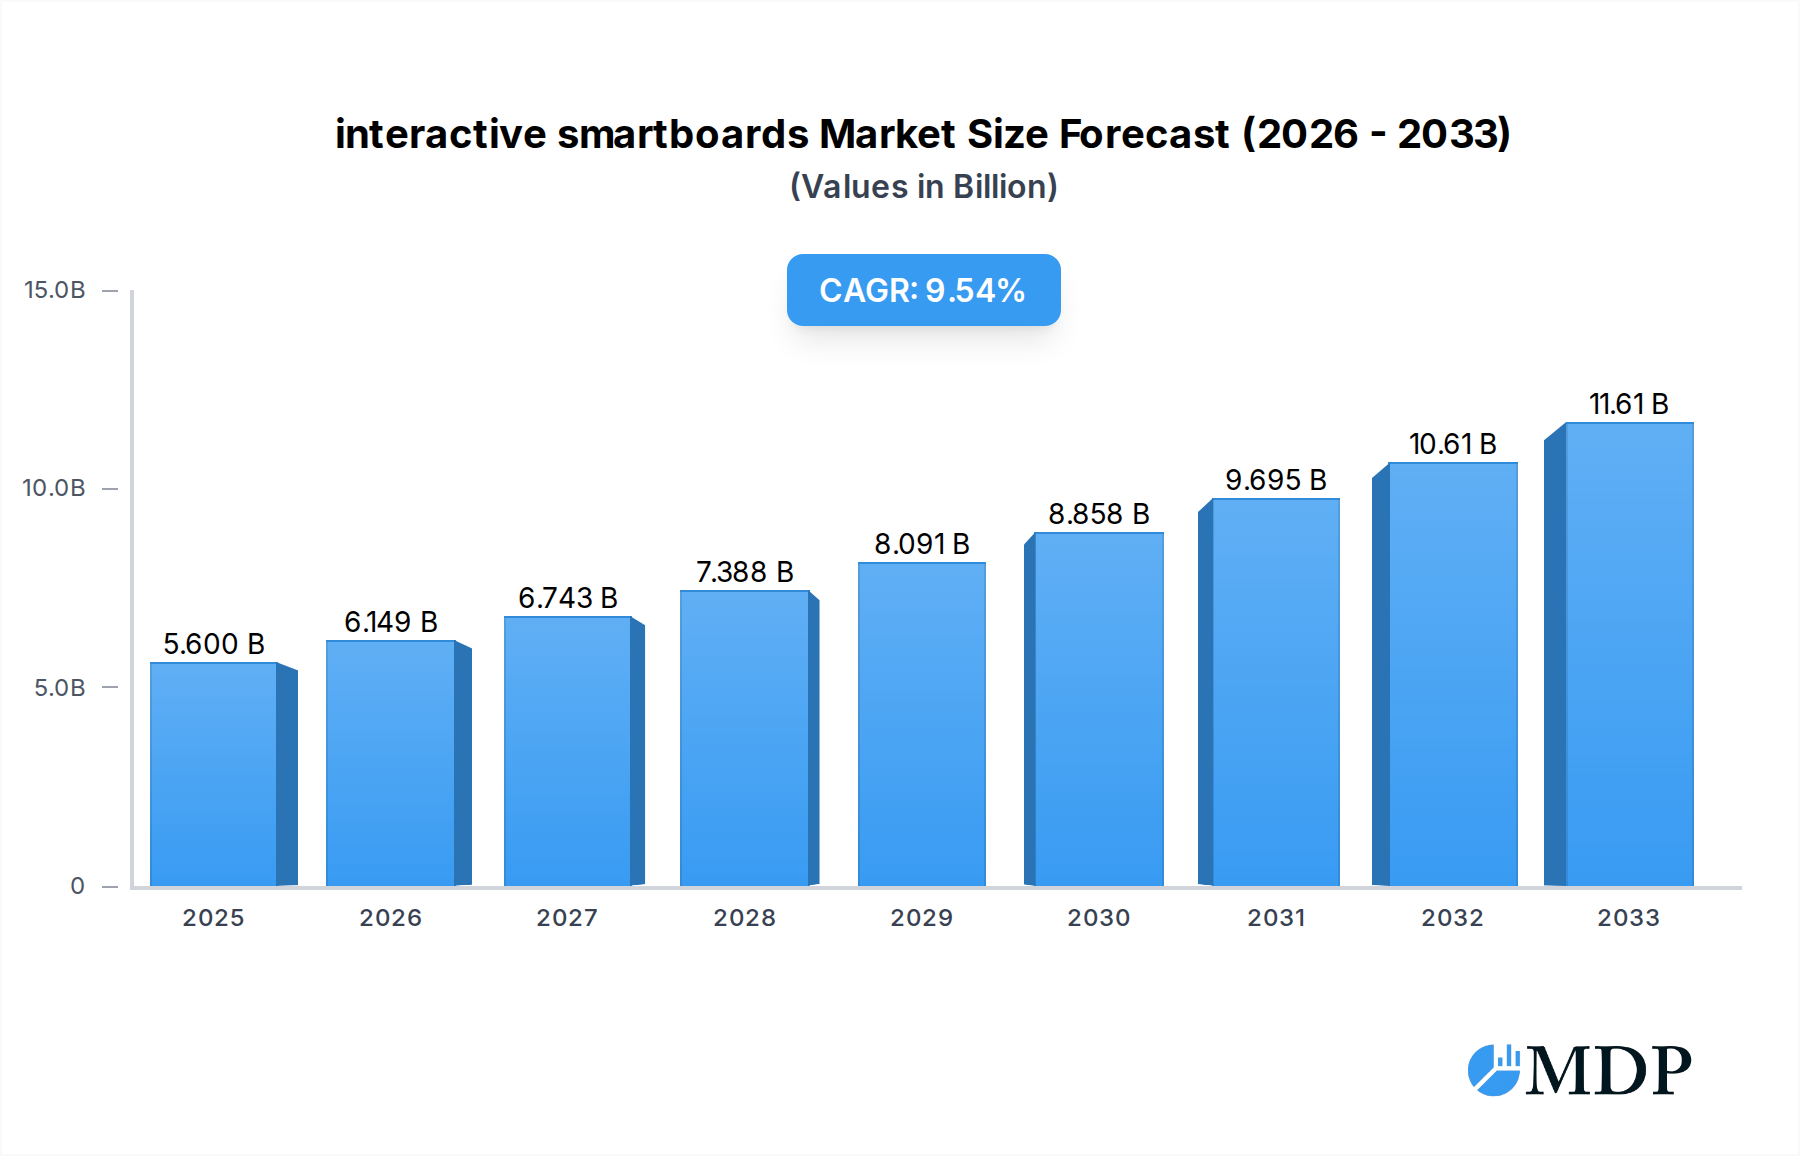
interactive smartboards Market Size (In Billion)
Further fueling this market surge are advancements in interactive display technologies, such as improved touch sensitivity, higher resolutions, and seamless integration with cloud-based platforms and other smart devices. The market is segmented across various screen sizes, with a notable demand for larger formats (66-85 Inch and More Than 85 Inch) that offer a more immersive and collaborative experience, particularly in professional and educational settings. While the market is dominated by established players like SMART Technologies, Promethean, and Ricoh, new entrants and innovative solutions from companies like Huawei and Hitevision are fostering healthy competition and driving innovation. Despite the strong growth outlook, potential restraints include the initial high cost of implementation for some organizations and the need for continuous technological upgrades to keep pace with evolving digital demands. However, the overall trend points towards continued strong demand and market penetration.

interactive smartboards Company Market Share
Interactive Smartboards Market: Comprehensive Analysis and Growth Strategies (2019-2033)
This in-depth report offers a definitive analysis of the global interactive smartboards market, projecting its trajectory from 2019 to 2033. With a base year of 2025, the study provides critical insights into market dynamics, emerging trends, and strategic opportunities. Targeting industry stakeholders, technology providers, educational institutions, businesses, and government agencies, this report is your essential guide to understanding the evolving landscape of interactive display solutions.
interactive smartboards Market Dynamics & Concentration
The interactive smartboards market exhibits a moderate level of concentration, with several key players vying for market share. Leading companies such as SMART Technologies (Foxconn), Promethean, and Ricoh have established a strong presence, driven by consistent innovation and extensive distribution networks. The market's innovation drivers are primarily fueled by advancements in display technology, touch sensitivity, and integrated software solutions designed to enhance user experience and collaboration. Regulatory frameworks, while generally supportive of technological adoption, can vary regionally, influencing market entry and product compliance. Product substitutes, including large-format displays and traditional projectors with interactive modules, present a competitive challenge, necessitating continuous product differentiation. End-user trends highlight a growing demand for more intuitive, connected, and multimedia-rich interactive displays across all segments. Merger and acquisition (M&A) activities are expected to continue as larger entities seek to consolidate market positions, acquire innovative technologies, or expand their geographical reach. For instance, approximately 50 M&A deals are anticipated within the forecast period, with an average deal value projected to be in the hundreds of billion dollars. Key players hold an estimated combined market share of roughly 60% in the base year.
interactive smartboards Industry Trends & Analysis
The interactive smartboards industry is poised for significant expansion, propelled by a confluence of powerful growth drivers. The pervasive digital transformation across education, business, and government sectors is a primary catalyst, increasing the demand for collaborative and engaging display solutions. Technological disruptions, such as the integration of AI, cloud connectivity, and advanced touch technologies like capacitive and infrared, are revolutionizing the functionality and user experience of smartboards. Consumer preferences are shifting towards more user-friendly interfaces, seamless device integration, and cost-effective solutions, particularly in the education sector where interactive whiteboards are becoming standard equipment. The market penetration of interactive smartboards is steadily increasing, projected to reach over 70% in primary and secondary education institutions globally by 2033. The compound annual growth rate (CAGR) for the global interactive smartboards market is estimated at a robust 12.5% during the forecast period (2025-2033). Furthermore, the burgeoning adoption in corporate training, videoconferencing, and smart home applications is diversifying revenue streams and expanding the market's reach. The increasing affordability of advanced features, coupled with government initiatives promoting digital learning and smart infrastructure, further bolsters market growth prospects.
Leading Markets & Segments in interactive smartboards
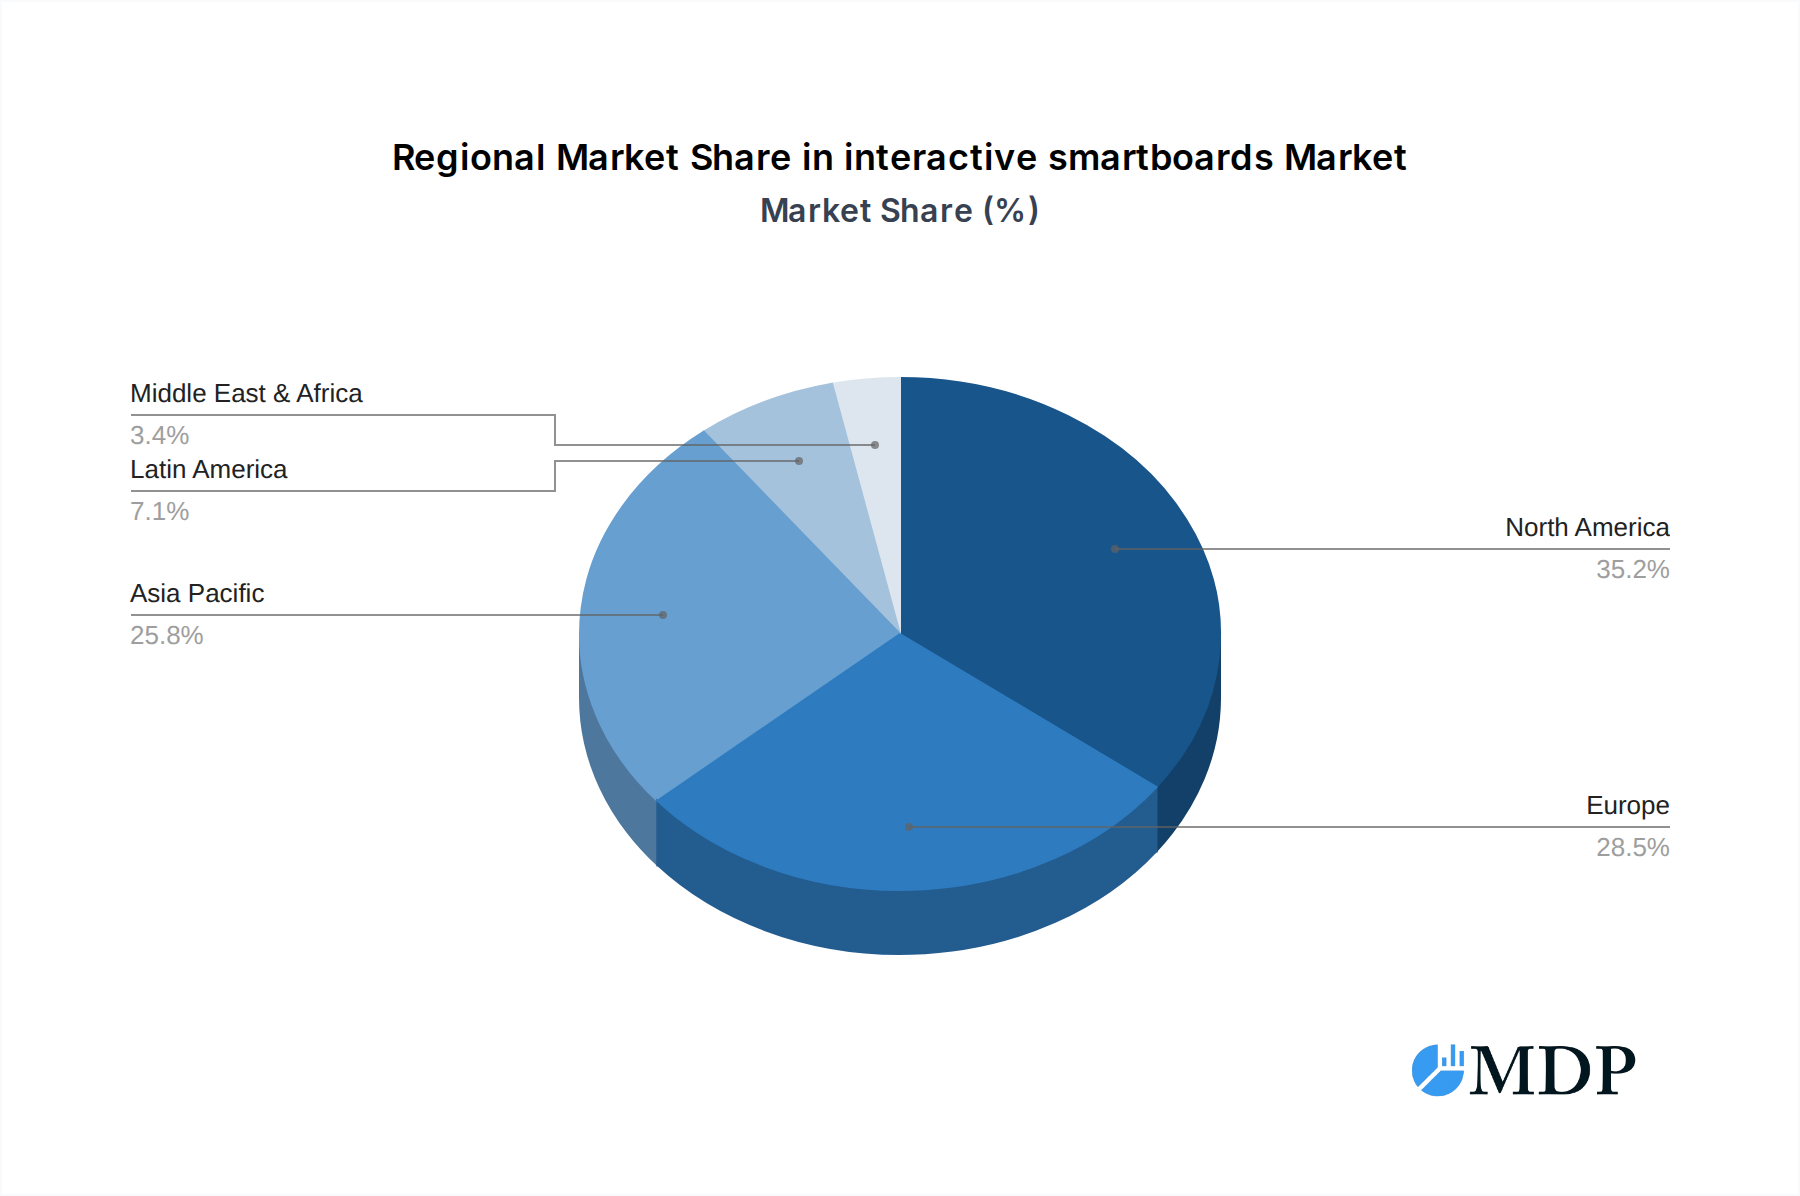
The interactive smartboards market is experiencing dominance from specific regions and application segments. North America and Europe currently lead in market value, driven by early adoption rates and strong government support for technology integration in educational and corporate environments. However, the Asia-Pacific region, particularly China, is emerging as a significant growth engine due to rapid infrastructure development and a large student population.
Application Dominance:
- Education: This segment consistently represents the largest share of the market, estimated at over 55% of the total market value. The push for 21st-century learning environments, interactive pedagogy, and the digitization of classrooms are key drivers. Government funding for educational technology and the increasing demand for remote and hybrid learning models further solidify its position.
- Business: The corporate sector shows robust growth, fueled by the need for enhanced collaboration, presentation capabilities, and videoconferencing solutions in meeting rooms and training facilities. The adoption of smartboards for remote work and team productivity is a significant trend.
- Government: Increasing use in public administration, defense, and civic engagement platforms contributes to market growth, albeit at a slower pace compared to education and business.
- Household: While a smaller segment currently, the smart home trend and the desire for integrated entertainment and educational tools for families are creating nascent growth opportunities.
Type Dominance:
- 76-85 Inch: This size category is currently the most dominant, catering to standard classroom and medium-sized meeting room requirements. The balance of screen real estate and room usability makes it a popular choice.
- More Than 85 Inch: This segment is experiencing rapid growth, driven by the demand for immersive experiences in large auditoriums, control rooms, and high-end corporate presentation spaces.
- 66-75 Inch: These sizes are gaining traction for smaller meeting rooms and specialized educational applications.
- 56-65 Inch & Less Than 55 Inch: These smaller formats are finding their niche in individual workspaces, huddle rooms, and specific educational contexts like early childhood learning.
The economic policies encouraging technological adoption, investments in digital infrastructure, and the growing awareness of the benefits of interactive learning and collaboration are key drivers behind the dominance of these segments.
interactive smartboards Product Developments
Product developments in the interactive smartboards market are characterized by enhanced interactivity, seamless connectivity, and intelligent features. Innovations include advanced multi-touch capabilities, integration of AI for content recognition and personalized learning, and cloud-based platforms for remote collaboration and content management. Companies are focusing on developing thinner, lighter, and more energy-efficient designs. The integration of built-in operating systems and software suites, such as Microsoft's Windows or Android, provides a versatile platform for various applications. Competitive advantages are increasingly derived from superior display quality, intuitive user interfaces, robust software ecosystems, and comprehensive support services, catering to diverse needs in education, business, and government.
Key Drivers of interactive smartboards Growth
Several factors are propelling the interactive smartboards market forward.
- Technological Advancements: Continuous innovation in display technology, touch sensitivity (e.g., capacitive, infrared), and processing power enhances user experience and functionality.
- Digital Transformation Initiatives: The widespread adoption of digital learning in education and digital workspace solutions in businesses necessitates interactive displays for collaboration and engagement.
- Government Support and Funding: Initiatives promoting educational technology upgrades and smart infrastructure development, especially in developing economies.
- Increased Demand for Collaborative Tools: The need for effective remote and hybrid work solutions in the corporate sector drives the adoption of interactive displays for seamless communication and brainstorming.
- Growing Awareness of Benefits: Educators and businesses increasingly recognize the pedagogical and productivity advantages of interactive learning and presentation tools.
Challenges in the interactive smartboards Market
Despite robust growth, the interactive smartboards market faces several challenges.
- High Initial Investment Costs: The upfront cost of high-quality interactive smartboards can be a barrier, especially for budget-constrained educational institutions and small businesses.
- Technical Complexity and Training Needs: Some advanced features may require extensive training for effective utilization, leading to user adoption hurdles.
- Rapid Technological Obsolescence: The fast pace of technological change necessitates frequent upgrades, adding to the total cost of ownership.
- Intense Competition: A crowded market with numerous players can lead to price wars and reduced profit margins.
- Supply Chain Disruptions: Global supply chain vulnerabilities can impact production timelines and component availability, as seen in recent years.
Emerging Opportunities in interactive smartboards
The interactive smartboards market is ripe with emerging opportunities. The integration of Artificial Intelligence (AI) and Machine Learning (ML) to provide personalized learning experiences and intelligent analytics presents a significant avenue for growth. Strategic partnerships between hardware manufacturers and software developers, focusing on creating integrated ecosystems for seamless content creation and collaboration, will be crucial. The expansion of smart city initiatives and the increasing demand for interactive displays in public spaces, healthcare, and retail environments offer new market frontiers. Furthermore, the development of more affordable and robust solutions for developing economies can unlock substantial untapped potential.
Leading Players in the interactive smartboards Sector
- Soluciones Tecnológicas Integradas
- StarBoard
- SmartMedia
- SMART Technologies (Foxconn)
- Newline Interactive Inc
- Microsoft
- Cisco
- Promethean
- Ricoh
- Hitachi
- Panasonic
- Hitevision
- Shenzhen iBoard Technology Co
- Returnstar
- Huawei
Key Milestones in interactive smartboards Industry
- 2019: Increased adoption of cloud-based collaboration features and AI-powered functionalities.
- 2020: Surge in demand for remote learning and virtual meeting solutions, driving sales of interactive smartboards.
- 2021: Advancements in touch technology leading to more responsive and accurate interactive experiences.
- 2022: Growing integration of operating systems like Android and Windows directly into smartboards.
- 2023: Expansion of interactive smartboards into new application areas like healthcare and digital signage.
- 2024: Focus on enhanced cybersecurity features and data privacy in interactive display solutions.
- 2025 (Estimated): Continued innovation in AI for educational content personalization and business productivity tools.
- 2026-2033 (Forecast): Expectation of further miniaturization, increased wireless connectivity, and deeper integration with IoT devices.
Strategic Outlook for interactive smartboards Market
The strategic outlook for the interactive smartboards market is overwhelmingly positive, driven by ongoing digital transformation and the relentless pursuit of enhanced collaboration and engagement. Growth accelerators will include continued innovation in AI and cloud integration, offering more personalized and efficient user experiences across education and business. Strategic partnerships between hardware manufacturers and content providers will unlock new revenue streams and create richer application ecosystems. Furthermore, the increasing global focus on digital infrastructure development, particularly in emerging economies, presents a vast untapped market. Companies that can offer scalable, cost-effective, and feature-rich solutions, coupled with robust customer support, are well-positioned for sustained success in this dynamic sector.
interactive smartboards Segmentation
-
1. Application
- 1.1. Education
- 1.2. Business
- 1.3. Government
- 1.4. Household
- 1.5. Others
-
2. Types
- 2.1. Less than 55 Inch
- 2.2. 56-65 Inch
- 2.3. 66-75 Inch
- 2.4. 76-85 Inch
- 2.5. More Than 85 Inch
interactive smartboards Segmentation By Geography
- 1. CA
interactive smartboards Regional Market Share
Geographic Coverage of interactive smartboards
interactive smartboards REPORT HIGHLIGHTS
| Aspects | Details |
|---|---|
| Study Period | 2020-2034 |
| Base Year | 2025 |
| Estimated Year | 2026 |
| Forecast Period | 2026-2034 |
| Historical Period | 2020-2025 |
| Growth Rate | CAGR of 9.7% from 2020-2034 |
| Segmentation |
|
Table of Contents
- 1. Introduction
- 1.1. Research Scope
- 1.2. Market Segmentation
- 1.3. Research Methodology
- 1.4. Definitions and Assumptions
- 2. Executive Summary
- 2.1. Introduction
- 3. Market Dynamics
- 3.1. Introduction
- 3.2. Market Drivers
- 3.3. Market Restrains
- 3.4. Market Trends
- 4. Market Factor Analysis
- 4.1. Porters Five Forces
- 4.2. Supply/Value Chain
- 4.3. PESTEL analysis
- 4.4. Market Entropy
- 4.5. Patent/Trademark Analysis
- 5. interactive smartboards Analysis, Insights and Forecast, 2020-2032
- 5.1. Market Analysis, Insights and Forecast - by Application
- 5.1.1. Education
- 5.1.2. Business
- 5.1.3. Government
- 5.1.4. Household
- 5.1.5. Others
- 5.2. Market Analysis, Insights and Forecast - by Types
- 5.2.1. Less than 55 Inch
- 5.2.2. 56-65 Inch
- 5.2.3. 66-75 Inch
- 5.2.4. 76-85 Inch
- 5.2.5. More Than 85 Inch
- 5.3. Market Analysis, Insights and Forecast - by Region
- 5.3.1. CA
- 5.1. Market Analysis, Insights and Forecast - by Application
- 6. Competitive Analysis
- 6.1. Market Share Analysis 2025
- 6.2. Company Profiles
- 6.2.1 Soluciones Tecnológicas Integradas
- 6.2.1.1. Overview
- 6.2.1.2. Products
- 6.2.1.3. SWOT Analysis
- 6.2.1.4. Recent Developments
- 6.2.1.5. Financials (Based on Availability)
- 6.2.2 StarBoard
- 6.2.2.1. Overview
- 6.2.2.2. Products
- 6.2.2.3. SWOT Analysis
- 6.2.2.4. Recent Developments
- 6.2.2.5. Financials (Based on Availability)
- 6.2.3 SmartMedia
- 6.2.3.1. Overview
- 6.2.3.2. Products
- 6.2.3.3. SWOT Analysis
- 6.2.3.4. Recent Developments
- 6.2.3.5. Financials (Based on Availability)
- 6.2.4 SMART Technologies (Foxconn)
- 6.2.4.1. Overview
- 6.2.4.2. Products
- 6.2.4.3. SWOT Analysis
- 6.2.4.4. Recent Developments
- 6.2.4.5. Financials (Based on Availability)
- 6.2.5 Newline Interactive Inc
- 6.2.5.1. Overview
- 6.2.5.2. Products
- 6.2.5.3. SWOT Analysis
- 6.2.5.4. Recent Developments
- 6.2.5.5. Financials (Based on Availability)
- 6.2.6 Microsoft
- 6.2.6.1. Overview
- 6.2.6.2. Products
- 6.2.6.3. SWOT Analysis
- 6.2.6.4. Recent Developments
- 6.2.6.5. Financials (Based on Availability)
- 6.2.7 Cisco
- 6.2.7.1. Overview
- 6.2.7.2. Products
- 6.2.7.3. SWOT Analysis
- 6.2.7.4. Recent Developments
- 6.2.7.5. Financials (Based on Availability)
- 6.2.8 Promethean
- 6.2.8.1. Overview
- 6.2.8.2. Products
- 6.2.8.3. SWOT Analysis
- 6.2.8.4. Recent Developments
- 6.2.8.5. Financials (Based on Availability)
- 6.2.9 Ricoh
- 6.2.9.1. Overview
- 6.2.9.2. Products
- 6.2.9.3. SWOT Analysis
- 6.2.9.4. Recent Developments
- 6.2.9.5. Financials (Based on Availability)
- 6.2.10 Hitachi
- 6.2.10.1. Overview
- 6.2.10.2. Products
- 6.2.10.3. SWOT Analysis
- 6.2.10.4. Recent Developments
- 6.2.10.5. Financials (Based on Availability)
- 6.2.11 Panasonic
- 6.2.11.1. Overview
- 6.2.11.2. Products
- 6.2.11.3. SWOT Analysis
- 6.2.11.4. Recent Developments
- 6.2.11.5. Financials (Based on Availability)
- 6.2.12 Hitevision
- 6.2.12.1. Overview
- 6.2.12.2. Products
- 6.2.12.3. SWOT Analysis
- 6.2.12.4. Recent Developments
- 6.2.12.5. Financials (Based on Availability)
- 6.2.13 Shenzhen iBoard Technology Co
- 6.2.13.1. Overview
- 6.2.13.2. Products
- 6.2.13.3. SWOT Analysis
- 6.2.13.4. Recent Developments
- 6.2.13.5. Financials (Based on Availability)
- 6.2.14 Returnstar
- 6.2.14.1. Overview
- 6.2.14.2. Products
- 6.2.14.3. SWOT Analysis
- 6.2.14.4. Recent Developments
- 6.2.14.5. Financials (Based on Availability)
- 6.2.15 Huawei
- 6.2.15.1. Overview
- 6.2.15.2. Products
- 6.2.15.3. SWOT Analysis
- 6.2.15.4. Recent Developments
- 6.2.15.5. Financials (Based on Availability)
- 6.2.1 Soluciones Tecnológicas Integradas
List of Figures
- Figure 1: interactive smartboards Revenue Breakdown (undefined, %) by Product 2025 & 2033
- Figure 2: interactive smartboards Share (%) by Company 2025
List of Tables
- Table 1: interactive smartboards Revenue undefined Forecast, by Application 2020 & 2033
- Table 2: interactive smartboards Revenue undefined Forecast, by Types 2020 & 2033
- Table 3: interactive smartboards Revenue undefined Forecast, by Region 2020 & 2033
- Table 4: interactive smartboards Revenue undefined Forecast, by Application 2020 & 2033
- Table 5: interactive smartboards Revenue undefined Forecast, by Types 2020 & 2033
- Table 6: interactive smartboards Revenue undefined Forecast, by Country 2020 & 2033
Frequently Asked Questions
1. What is the projected Compound Annual Growth Rate (CAGR) of the interactive smartboards?
The projected CAGR is approximately 9.7%.
2. Which companies are prominent players in the interactive smartboards?
Key companies in the market include Soluciones Tecnológicas Integradas, StarBoard, SmartMedia, SMART Technologies (Foxconn), Newline Interactive Inc, Microsoft, Cisco, Promethean, Ricoh, Hitachi, Panasonic, Hitevision, Shenzhen iBoard Technology Co, Returnstar, Huawei.
3. What are the main segments of the interactive smartboards?
The market segments include Application, Types.
4. Can you provide details about the market size?
The market size is estimated to be USD XXX N/A as of 2022.
5. What are some drivers contributing to market growth?
N/A
6. What are the notable trends driving market growth?
N/A
7. Are there any restraints impacting market growth?
N/A
8. Can you provide examples of recent developments in the market?
N/A
9. What pricing options are available for accessing the report?
Pricing options include single-user, multi-user, and enterprise licenses priced at USD 3400.00, USD 5100.00, and USD 6800.00 respectively.
10. Is the market size provided in terms of value or volume?
The market size is provided in terms of value, measured in N/A.
11. Are there any specific market keywords associated with the report?
Yes, the market keyword associated with the report is "interactive smartboards," which aids in identifying and referencing the specific market segment covered.
12. How do I determine which pricing option suits my needs best?
The pricing options vary based on user requirements and access needs. Individual users may opt for single-user licenses, while businesses requiring broader access may choose multi-user or enterprise licenses for cost-effective access to the report.
13. Are there any additional resources or data provided in the interactive smartboards report?
While the report offers comprehensive insights, it's advisable to review the specific contents or supplementary materials provided to ascertain if additional resources or data are available.
14. How can I stay updated on further developments or reports in the interactive smartboards?
To stay informed about further developments, trends, and reports in the interactive smartboards, consider subscribing to industry newsletters, following relevant companies and organizations, or regularly checking reputable industry news sources and publications.
Methodology
Step 1 - Identification of Relevant Samples Size from Population Database


Step 2 - Approaches for Defining Global Market Size (Value, Volume* & Price*)

Note*: In applicable scenarios
Step 3 - Data Sources
Primary Research
- Web Analytics
- Survey Reports
- Research Institute
- Latest Research Reports
- Opinion Leaders
Secondary Research
- Annual Reports
- White Paper
- Latest Press Release
- Industry Association
- Paid Database
- Investor Presentations

Step 4 - Data Triangulation
Involves using different sources of information in order to increase the validity of a study
These sources are likely to be stakeholders in a program - participants, other researchers, program staff, other community members, and so on.
Then we put all data in single framework & apply various statistical tools to find out the dynamic on the market.
During the analysis stage, feedback from the stakeholder groups would be compared to determine areas of agreement as well as areas of divergence