

Key Insights
The Interactive Flat Panel (IFP) market is poised for robust expansion, projected to reach an estimated USD 6.26 billion in 2025, driven by a compelling CAGR of 8.9% over the forecast period. This significant growth trajectory is fueled by the increasing adoption of advanced display technologies across diverse sectors. The education sector is a primary catalyst, with institutions globally investing in IFPs to enhance collaborative learning environments and deliver more engaging, interactive educational experiences. Similarly, the government sector is leveraging IFPs for public information displays, command and control centers, and secure communication platforms, recognizing their potential to improve efficiency and citizen engagement. The enterprise segment is also a key driver, as businesses integrate IFPs into meeting rooms, huddle spaces, and digital signage solutions to foster seamless collaboration, streamline presentations, and elevate brand experiences. The rising demand for higher resolution displays, such as UHD/4K panels, alongside advancements in touch technology and connectivity, are further accelerating market penetration.
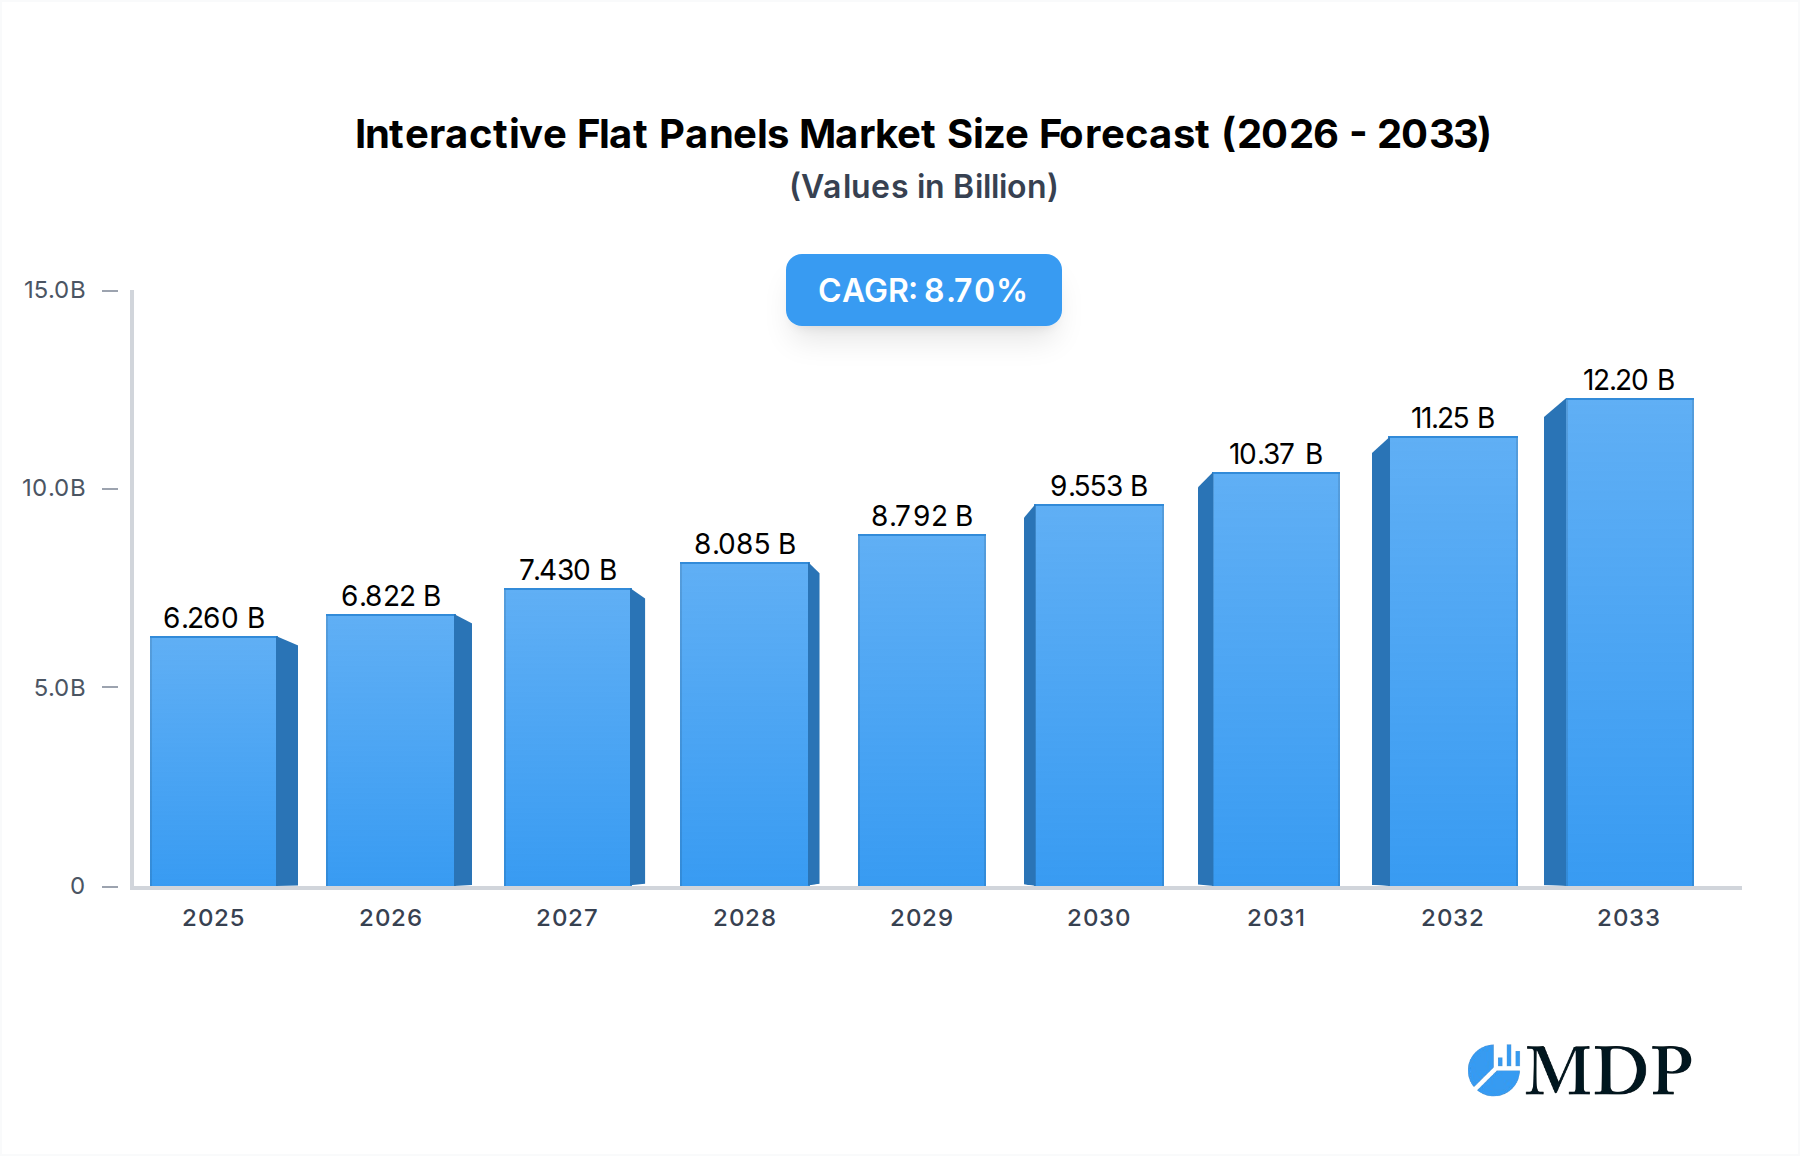
Interactive Flat Panels Market Size (In Billion)
Emerging trends like the integration of AI and IoT capabilities into IFPs are opening new avenues for personalized user experiences and data-driven insights. Innovations in panel technology, including the increased prevalence of energy-efficient LED backlighting and improved durability, are also contributing to market growth. However, certain factors could moderate this growth. High initial investment costs for advanced IFP models may present a restraint for smaller organizations. Additionally, ongoing supply chain complexities and the need for standardized interoperability across different software platforms could pose challenges. Despite these considerations, the inherent value proposition of IFPs in enhancing communication, collaboration, and engagement across various applications strongly underpins the market's optimistic outlook. Key players like Samsung Display, LG Display, and NEC Display Solutions are at the forefront of innovation, driving the market forward with a continuous stream of advanced and feature-rich interactive flat panel solutions.

Interactive Flat Panels Company Market Share
Dive deep into the rapidly evolving interactive flat panel market with this comprehensive industry report. Spanning from 2019 to 2033, this in-depth analysis provides critical insights into market dynamics, key trends, leading segments, and future growth opportunities. Designed for industry stakeholders, including investors, manufacturers, and technology providers, this report offers actionable intelligence to navigate and capitalize on the burgeoning interactive display solutions landscape. Explore the impact of education sector technology, government digital transformation, and enterprise collaboration tools as interactive flat panels reshape how we learn, work, and interact.
Interactive Flat Panels Market Dynamics & Concentration
The interactive flat panel market exhibits a moderate concentration, with a few dominant players alongside a growing number of niche providers. Innovation drivers are primarily fueled by advancements in touch technology, display resolution (including UHD/4K flat panels), and integrated software solutions enhancing user experience. Regulatory frameworks, while generally supportive of technology adoption in education and government, can vary by region, influencing deployment speeds. Product substitutes, such as traditional projectors and whiteboards, are gradually being phased out due to the superior functionality and engagement offered by interactive flat panels. End-user trends highlight a strong preference for intuitive, collaborative, and immersive learning and working environments. Mergers and acquisitions (M&A) activities have been moderate, with recent deal counts indicating a consolidation phase in certain segments, aiming to enhance market share and expand product portfolios. The market share of leading companies like Samsung Display, LG Display, and NEC Display Solutions is substantial, but emerging players are gaining traction through specialized offerings.
Interactive Flat Panels Industry Trends & Analysis
The interactive flat panel industry is poised for significant growth, driven by a confluence of technological advancements, evolving consumer preferences, and increasing digital transformation initiatives across various sectors. The global interactive flat panel market size is projected to reach xx billion by 2025, with a Compound Annual Growth Rate (CAGR) of approximately xx% anticipated during the forecast period of 2025–2033. This robust growth is fueled by the escalating demand for enhanced collaboration and engagement tools in the education sector, where interactive panels are revolutionizing classrooms by fostering active learning and personalized instruction. In the government sector, these displays are instrumental in improving public service delivery, facilitating civic engagement, and supporting secure communication. For enterprises, interactive flat panels are becoming indispensable for modern meeting rooms, enabling seamless remote collaboration, dynamic presentations, and efficient brainstorming sessions. Technological disruptions, including the integration of AI-powered features, advanced interactivity, and improved connectivity options, are continuously enhancing the capabilities and appeal of these devices. The market penetration of HD flat panels and UHD/4K flat panels is rapidly increasing, offering superior visual clarity and a more immersive user experience. Consumer preferences are shifting towards integrated, all-in-one solutions that simplify deployment and management, while also demanding robust software ecosystems that support a wide range of applications. Competitive dynamics are characterized by intense innovation, strategic partnerships, and a focus on delivering cost-effective yet high-performance solutions.
Leading Markets & Segments in Interactive Flat Panels
The Education Sector stands out as a dominant region and segment within the interactive flat panel market, driven by global initiatives focused on modernizing educational infrastructure and improving learning outcomes. Government policies promoting digital learning and the integration of technology in classrooms have been significant economic policies supporting this dominance. The widespread adoption of UHD/4K flat panels in educational institutions, offering unparalleled visual clarity for dynamic content delivery and enhanced student engagement, is a key driver.
- Key Drivers in the Education Sector:
- Government funding for educational technology upgrades.
- Increased demand for interactive and collaborative learning tools.
- The need for personalized learning experiences.
- The shift towards blended and hybrid learning models.
- Growing acceptance of HD flat panels as a standard classroom technology.
Beyond education, the Enterprise segment is also experiencing substantial growth, fueled by the need for improved workplace collaboration and the adoption of smart office technologies. The increasing prevalence of remote and hybrid work models necessitates advanced solutions for virtual meetings, presentations, and team synchronization.
- Key Drivers in the Enterprise Segment:
- Demand for efficient remote collaboration and communication.
- The rise of smart office initiatives.
- Need for enhanced presentation and brainstorming tools.
- Growing adoption of UHD/4K flat panels for high-definition visual experiences.
The Government Sector is another significant growth area, driven by digital transformation efforts aimed at modernizing public services, improving citizen engagement, and enhancing internal operational efficiency.
- Key Drivers in the Government Sector:
- Digital transformation mandates for public sector agencies.
- Need for secure and collaborative communication platforms.
- Deployment in public information kiosks and control rooms.
- Increased focus on smart city initiatives.
In terms of product types, UHD/4K Flat Panels are rapidly gaining market share due to their superior resolution and immersive visual capabilities, increasingly becoming the preferred choice across all key application segments.
Interactive Flat Panels Product Developments
Product developments in the interactive flat panel market are characterized by a strong emphasis on enhanced interactivity, superior display technology, and integrated intelligent features. Innovations include the incorporation of advanced touch capabilities, such as multi-touch and pressure sensitivity, alongside robust software platforms offering seamless content sharing and collaboration tools. The widespread adoption of UHD/4K flat panels ensures stunning visual fidelity, making them ideal for dynamic educational content and sophisticated enterprise presentations. Competitive advantages are being built through the integration of AI for personalized user experiences, improved connectivity options for simplified setup, and robust security features for enterprise and government applications.
Key Drivers of Interactive Flat Panels Growth
The growth of the interactive flat panel market is propelled by several key drivers. Technologically, the continuous advancements in display resolution, touch sensitivity, and the integration of smart features like AI are enhancing user experience and functionality. Economically, increasing government investments in digital education and smart city initiatives, coupled with enterprise spending on collaboration tools, are significant catalysts. Regulatory frameworks supporting technology adoption in public sectors further accelerate deployment. The demand for more engaging and collaborative learning environments in the education sector, alongside the need for efficient remote collaboration in the enterprise sector, are fundamental market forces driving adoption.
Challenges in the Interactive Flat Panels Market
Despite the positive outlook, the interactive flat panel market faces several challenges. High initial investment costs can be a barrier for smaller institutions and businesses, particularly in price-sensitive markets. Supply chain complexities and the availability of critical components can lead to production delays and price fluctuations. Intense competition from established players and new entrants necessitates continuous innovation and aggressive pricing strategies, which can strain profit margins. Furthermore, the rapid pace of technological evolution requires constant investment in R&D to remain competitive, posing a challenge for companies with limited resources.
Emerging Opportunities in Interactive Flat Panels
Emerging opportunities in the interactive flat panel market are abundant, driven by technological breakthroughs and evolving market needs. The integration of Artificial Intelligence (AI) and Machine Learning (ML) promises to deliver more personalized and intelligent user experiences, from adaptive learning platforms in education to predictive analytics in enterprise settings. The expansion of the Internet of Things (IoT) ecosystem opens avenues for interactive panels to act as central control hubs for smart buildings and environments. Strategic partnerships with software developers and content providers will be crucial for creating richer, more integrated solutions. Furthermore, the untapped potential in emerging economies and specialized industrial applications presents significant market expansion opportunities.
Leading Players in the Interactive Flat Panels Sector
- Baanto International
- Crystal Display Systems
- ELO Touch Solutions
- Gesturetek
- Horizon Display
- Interactive Touchscreen Solutions
- Intuilab
- LG Display
- NEC Display Solutions
- Panasonic
- Planar Systems
- Samsung Display
Key Milestones in Interactive Flat Panels Industry
- 2019: Increased adoption of UHD/4K resolution in commercial displays.
- 2020: Rise in demand for interactive displays in remote work and education settings due to the global pandemic.
- 2021: Integration of AI-powered features for enhanced user interaction and analytics.
- 2022: Significant growth in the adoption of interactive flat panels in the education sector, driven by government initiatives.
- 2023: Growing focus on touchless interaction technologies and enhanced cybersecurity features.
- 2024: Continued expansion of cloud-based management and collaboration platforms for interactive displays.
Strategic Outlook for Interactive Flat Panels Market
The strategic outlook for the interactive flat panel market is exceptionally bright, fueled by relentless innovation and a growing appreciation for their transformative capabilities. The future will see an even deeper integration of AI, leading to highly personalized and adaptive experiences across education, enterprise, and government applications. The development of more robust and intuitive software ecosystems will unlock new levels of collaboration and productivity. Strategic partnerships will be pivotal in expanding the reach of interactive solutions into new verticals and geographical markets. Furthermore, a continued focus on energy efficiency and sustainability in product design will align with global environmental goals.
Interactive Flat Panels Segmentation
-
1. Application
- 1.1. Education Sector
- 1.2. Government Sector
- 1.3. Enterprise
-
2. Types
- 2.1. LCD Flat Panels
- 2.2. HD Flat Panels
- 2.3. UHD/4K Flat Panels
Interactive Flat Panels Segmentation By Geography
-
1. North America
- 1.1. United States
- 1.2. Canada
- 1.3. Mexico
-
2. South America
- 2.1. Brazil
- 2.2. Argentina
- 2.3. Rest of South America
-
3. Europe
- 3.1. United Kingdom
- 3.2. Germany
- 3.3. France
- 3.4. Italy
- 3.5. Spain
- 3.6. Russia
- 3.7. Benelux
- 3.8. Nordics
- 3.9. Rest of Europe
-
4. Middle East & Africa
- 4.1. Turkey
- 4.2. Israel
- 4.3. GCC
- 4.4. North Africa
- 4.5. South Africa
- 4.6. Rest of Middle East & Africa
-
5. Asia Pacific
- 5.1. China
- 5.2. India
- 5.3. Japan
- 5.4. South Korea
- 5.5. ASEAN
- 5.6. Oceania
- 5.7. Rest of Asia Pacific
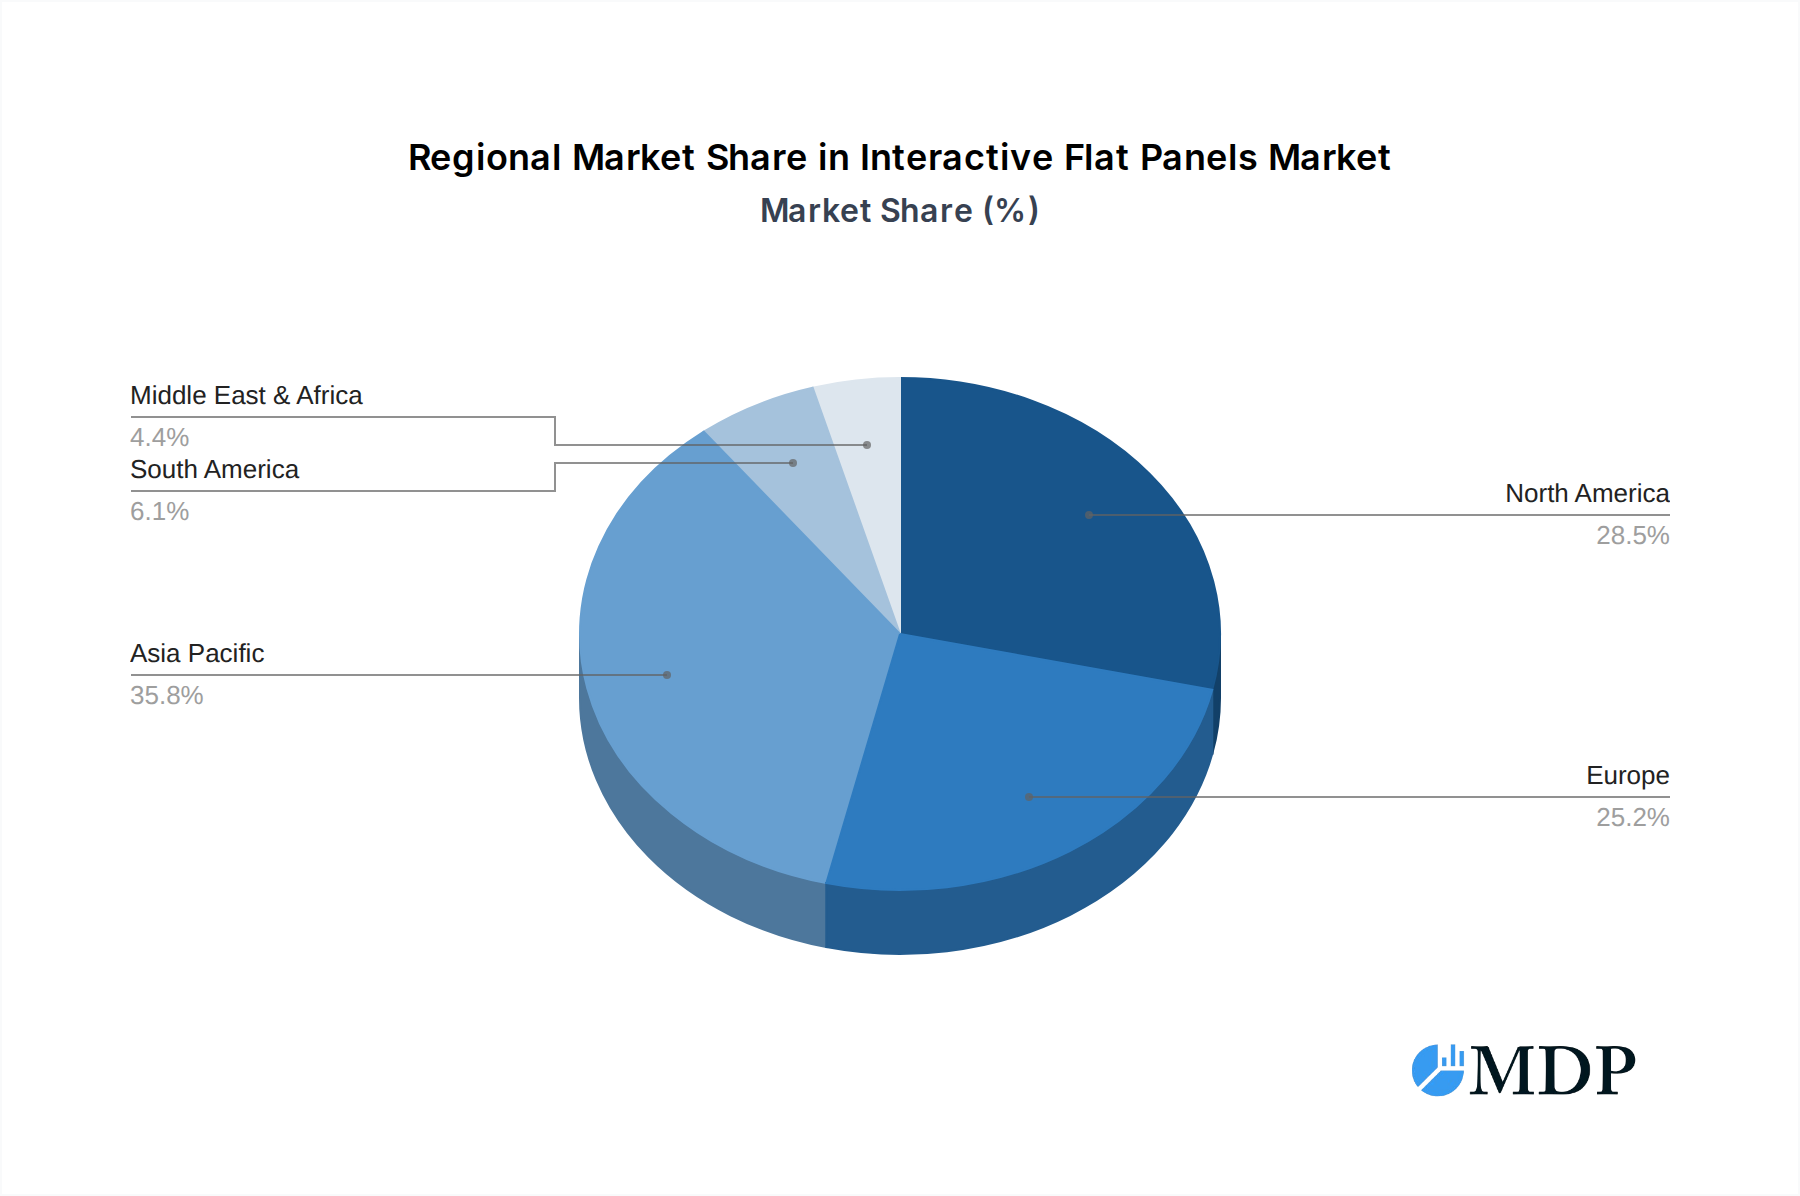
Interactive Flat Panels Regional Market Share
Geographic Coverage of Interactive Flat Panels
Interactive Flat Panels REPORT HIGHLIGHTS
| Aspects | Details |
|---|---|
| Study Period | 2020-2034 |
| Base Year | 2025 |
| Estimated Year | 2026 |
| Forecast Period | 2026-2034 |
| Historical Period | 2020-2025 |
| Growth Rate | CAGR of 8.9% from 2020-2034 |
| Segmentation |
|
Table of Contents
- 1. Introduction
- 1.1. Research Scope
- 1.2. Market Segmentation
- 1.3. Research Methodology
- 1.4. Definitions and Assumptions
- 2. Executive Summary
- 2.1. Introduction
- 3. Market Dynamics
- 3.1. Introduction
- 3.2. Market Drivers
- 3.3. Market Restrains
- 3.4. Market Trends
- 4. Market Factor Analysis
- 4.1. Porters Five Forces
- 4.2. Supply/Value Chain
- 4.3. PESTEL analysis
- 4.4. Market Entropy
- 4.5. Patent/Trademark Analysis
- 5. Global Interactive Flat Panels Analysis, Insights and Forecast, 2020-2032
- 5.1. Market Analysis, Insights and Forecast - by Application
- 5.1.1. Education Sector
- 5.1.2. Government Sector
- 5.1.3. Enterprise
- 5.2. Market Analysis, Insights and Forecast - by Types
- 5.2.1. LCD Flat Panels
- 5.2.2. HD Flat Panels
- 5.2.3. UHD/4K Flat Panels
- 5.3. Market Analysis, Insights and Forecast - by Region
- 5.3.1. North America
- 5.3.2. South America
- 5.3.3. Europe
- 5.3.4. Middle East & Africa
- 5.3.5. Asia Pacific
- 5.1. Market Analysis, Insights and Forecast - by Application
- 6. North America Interactive Flat Panels Analysis, Insights and Forecast, 2020-2032
- 6.1. Market Analysis, Insights and Forecast - by Application
- 6.1.1. Education Sector
- 6.1.2. Government Sector
- 6.1.3. Enterprise
- 6.2. Market Analysis, Insights and Forecast - by Types
- 6.2.1. LCD Flat Panels
- 6.2.2. HD Flat Panels
- 6.2.3. UHD/4K Flat Panels
- 6.1. Market Analysis, Insights and Forecast - by Application
- 7. South America Interactive Flat Panels Analysis, Insights and Forecast, 2020-2032
- 7.1. Market Analysis, Insights and Forecast - by Application
- 7.1.1. Education Sector
- 7.1.2. Government Sector
- 7.1.3. Enterprise
- 7.2. Market Analysis, Insights and Forecast - by Types
- 7.2.1. LCD Flat Panels
- 7.2.2. HD Flat Panels
- 7.2.3. UHD/4K Flat Panels
- 7.1. Market Analysis, Insights and Forecast - by Application
- 8. Europe Interactive Flat Panels Analysis, Insights and Forecast, 2020-2032
- 8.1. Market Analysis, Insights and Forecast - by Application
- 8.1.1. Education Sector
- 8.1.2. Government Sector
- 8.1.3. Enterprise
- 8.2. Market Analysis, Insights and Forecast - by Types
- 8.2.1. LCD Flat Panels
- 8.2.2. HD Flat Panels
- 8.2.3. UHD/4K Flat Panels
- 8.1. Market Analysis, Insights and Forecast - by Application
- 9. Middle East & Africa Interactive Flat Panels Analysis, Insights and Forecast, 2020-2032
- 9.1. Market Analysis, Insights and Forecast - by Application
- 9.1.1. Education Sector
- 9.1.2. Government Sector
- 9.1.3. Enterprise
- 9.2. Market Analysis, Insights and Forecast - by Types
- 9.2.1. LCD Flat Panels
- 9.2.2. HD Flat Panels
- 9.2.3. UHD/4K Flat Panels
- 9.1. Market Analysis, Insights and Forecast - by Application
- 10. Asia Pacific Interactive Flat Panels Analysis, Insights and Forecast, 2020-2032
- 10.1. Market Analysis, Insights and Forecast - by Application
- 10.1.1. Education Sector
- 10.1.2. Government Sector
- 10.1.3. Enterprise
- 10.2. Market Analysis, Insights and Forecast - by Types
- 10.2.1. LCD Flat Panels
- 10.2.2. HD Flat Panels
- 10.2.3. UHD/4K Flat Panels
- 10.1. Market Analysis, Insights and Forecast - by Application
- 11. Competitive Analysis
- 11.1. Global Market Share Analysis 2025
- 11.2. Company Profiles
- 11.2.1 Baanto International
- 11.2.1.1. Overview
- 11.2.1.2. Products
- 11.2.1.3. SWOT Analysis
- 11.2.1.4. Recent Developments
- 11.2.1.5. Financials (Based on Availability)
- 11.2.2 Crystal Display Systems
- 11.2.2.1. Overview
- 11.2.2.2. Products
- 11.2.2.3. SWOT Analysis
- 11.2.2.4. Recent Developments
- 11.2.2.5. Financials (Based on Availability)
- 11.2.3 ELO Touch Solutions
- 11.2.3.1. Overview
- 11.2.3.2. Products
- 11.2.3.3. SWOT Analysis
- 11.2.3.4. Recent Developments
- 11.2.3.5. Financials (Based on Availability)
- 11.2.4 Gesturetek
- 11.2.4.1. Overview
- 11.2.4.2. Products
- 11.2.4.3. SWOT Analysis
- 11.2.4.4. Recent Developments
- 11.2.4.5. Financials (Based on Availability)
- 11.2.5 Horizon Display
- 11.2.5.1. Overview
- 11.2.5.2. Products
- 11.2.5.3. SWOT Analysis
- 11.2.5.4. Recent Developments
- 11.2.5.5. Financials (Based on Availability)
- 11.2.6 Interactive Touchscreen Solutions
- 11.2.6.1. Overview
- 11.2.6.2. Products
- 11.2.6.3. SWOT Analysis
- 11.2.6.4. Recent Developments
- 11.2.6.5. Financials (Based on Availability)
- 11.2.7 Intuilab
- 11.2.7.1. Overview
- 11.2.7.2. Products
- 11.2.7.3. SWOT Analysis
- 11.2.7.4. Recent Developments
- 11.2.7.5. Financials (Based on Availability)
- 11.2.8 LG Display
- 11.2.8.1. Overview
- 11.2.8.2. Products
- 11.2.8.3. SWOT Analysis
- 11.2.8.4. Recent Developments
- 11.2.8.5. Financials (Based on Availability)
- 11.2.9 NEC Display Solutions
- 11.2.9.1. Overview
- 11.2.9.2. Products
- 11.2.9.3. SWOT Analysis
- 11.2.9.4. Recent Developments
- 11.2.9.5. Financials (Based on Availability)
- 11.2.10 Panasonic
- 11.2.10.1. Overview
- 11.2.10.2. Products
- 11.2.10.3. SWOT Analysis
- 11.2.10.4. Recent Developments
- 11.2.10.5. Financials (Based on Availability)
- 11.2.11 Planar Systems
- 11.2.11.1. Overview
- 11.2.11.2. Products
- 11.2.11.3. SWOT Analysis
- 11.2.11.4. Recent Developments
- 11.2.11.5. Financials (Based on Availability)
- 11.2.12 Samsung Display
- 11.2.12.1. Overview
- 11.2.12.2. Products
- 11.2.12.3. SWOT Analysis
- 11.2.12.4. Recent Developments
- 11.2.12.5. Financials (Based on Availability)
- 11.2.1 Baanto International
List of Figures
- Figure 1: Global Interactive Flat Panels Revenue Breakdown (billion, %) by Region 2025 & 2033
- Figure 2: Global Interactive Flat Panels Volume Breakdown (K, %) by Region 2025 & 2033
- Figure 3: North America Interactive Flat Panels Revenue (billion), by Application 2025 & 2033
- Figure 4: North America Interactive Flat Panels Volume (K), by Application 2025 & 2033
- Figure 5: North America Interactive Flat Panels Revenue Share (%), by Application 2025 & 2033
- Figure 6: North America Interactive Flat Panels Volume Share (%), by Application 2025 & 2033
- Figure 7: North America Interactive Flat Panels Revenue (billion), by Types 2025 & 2033
- Figure 8: North America Interactive Flat Panels Volume (K), by Types 2025 & 2033
- Figure 9: North America Interactive Flat Panels Revenue Share (%), by Types 2025 & 2033
- Figure 10: North America Interactive Flat Panels Volume Share (%), by Types 2025 & 2033
- Figure 11: North America Interactive Flat Panels Revenue (billion), by Country 2025 & 2033
- Figure 12: North America Interactive Flat Panels Volume (K), by Country 2025 & 2033
- Figure 13: North America Interactive Flat Panels Revenue Share (%), by Country 2025 & 2033
- Figure 14: North America Interactive Flat Panels Volume Share (%), by Country 2025 & 2033
- Figure 15: South America Interactive Flat Panels Revenue (billion), by Application 2025 & 2033
- Figure 16: South America Interactive Flat Panels Volume (K), by Application 2025 & 2033
- Figure 17: South America Interactive Flat Panels Revenue Share (%), by Application 2025 & 2033
- Figure 18: South America Interactive Flat Panels Volume Share (%), by Application 2025 & 2033
- Figure 19: South America Interactive Flat Panels Revenue (billion), by Types 2025 & 2033
- Figure 20: South America Interactive Flat Panels Volume (K), by Types 2025 & 2033
- Figure 21: South America Interactive Flat Panels Revenue Share (%), by Types 2025 & 2033
- Figure 22: South America Interactive Flat Panels Volume Share (%), by Types 2025 & 2033
- Figure 23: South America Interactive Flat Panels Revenue (billion), by Country 2025 & 2033
- Figure 24: South America Interactive Flat Panels Volume (K), by Country 2025 & 2033
- Figure 25: South America Interactive Flat Panels Revenue Share (%), by Country 2025 & 2033
- Figure 26: South America Interactive Flat Panels Volume Share (%), by Country 2025 & 2033
- Figure 27: Europe Interactive Flat Panels Revenue (billion), by Application 2025 & 2033
- Figure 28: Europe Interactive Flat Panels Volume (K), by Application 2025 & 2033
- Figure 29: Europe Interactive Flat Panels Revenue Share (%), by Application 2025 & 2033
- Figure 30: Europe Interactive Flat Panels Volume Share (%), by Application 2025 & 2033
- Figure 31: Europe Interactive Flat Panels Revenue (billion), by Types 2025 & 2033
- Figure 32: Europe Interactive Flat Panels Volume (K), by Types 2025 & 2033
- Figure 33: Europe Interactive Flat Panels Revenue Share (%), by Types 2025 & 2033
- Figure 34: Europe Interactive Flat Panels Volume Share (%), by Types 2025 & 2033
- Figure 35: Europe Interactive Flat Panels Revenue (billion), by Country 2025 & 2033
- Figure 36: Europe Interactive Flat Panels Volume (K), by Country 2025 & 2033
- Figure 37: Europe Interactive Flat Panels Revenue Share (%), by Country 2025 & 2033
- Figure 38: Europe Interactive Flat Panels Volume Share (%), by Country 2025 & 2033
- Figure 39: Middle East & Africa Interactive Flat Panels Revenue (billion), by Application 2025 & 2033
- Figure 40: Middle East & Africa Interactive Flat Panels Volume (K), by Application 2025 & 2033
- Figure 41: Middle East & Africa Interactive Flat Panels Revenue Share (%), by Application 2025 & 2033
- Figure 42: Middle East & Africa Interactive Flat Panels Volume Share (%), by Application 2025 & 2033
- Figure 43: Middle East & Africa Interactive Flat Panels Revenue (billion), by Types 2025 & 2033
- Figure 44: Middle East & Africa Interactive Flat Panels Volume (K), by Types 2025 & 2033
- Figure 45: Middle East & Africa Interactive Flat Panels Revenue Share (%), by Types 2025 & 2033
- Figure 46: Middle East & Africa Interactive Flat Panels Volume Share (%), by Types 2025 & 2033
- Figure 47: Middle East & Africa Interactive Flat Panels Revenue (billion), by Country 2025 & 2033
- Figure 48: Middle East & Africa Interactive Flat Panels Volume (K), by Country 2025 & 2033
- Figure 49: Middle East & Africa Interactive Flat Panels Revenue Share (%), by Country 2025 & 2033
- Figure 50: Middle East & Africa Interactive Flat Panels Volume Share (%), by Country 2025 & 2033
- Figure 51: Asia Pacific Interactive Flat Panels Revenue (billion), by Application 2025 & 2033
- Figure 52: Asia Pacific Interactive Flat Panels Volume (K), by Application 2025 & 2033
- Figure 53: Asia Pacific Interactive Flat Panels Revenue Share (%), by Application 2025 & 2033
- Figure 54: Asia Pacific Interactive Flat Panels Volume Share (%), by Application 2025 & 2033
- Figure 55: Asia Pacific Interactive Flat Panels Revenue (billion), by Types 2025 & 2033
- Figure 56: Asia Pacific Interactive Flat Panels Volume (K), by Types 2025 & 2033
- Figure 57: Asia Pacific Interactive Flat Panels Revenue Share (%), by Types 2025 & 2033
- Figure 58: Asia Pacific Interactive Flat Panels Volume Share (%), by Types 2025 & 2033
- Figure 59: Asia Pacific Interactive Flat Panels Revenue (billion), by Country 2025 & 2033
- Figure 60: Asia Pacific Interactive Flat Panels Volume (K), by Country 2025 & 2033
- Figure 61: Asia Pacific Interactive Flat Panels Revenue Share (%), by Country 2025 & 2033
- Figure 62: Asia Pacific Interactive Flat Panels Volume Share (%), by Country 2025 & 2033
List of Tables
- Table 1: Global Interactive Flat Panels Revenue billion Forecast, by Application 2020 & 2033
- Table 2: Global Interactive Flat Panels Volume K Forecast, by Application 2020 & 2033
- Table 3: Global Interactive Flat Panels Revenue billion Forecast, by Types 2020 & 2033
- Table 4: Global Interactive Flat Panels Volume K Forecast, by Types 2020 & 2033
- Table 5: Global Interactive Flat Panels Revenue billion Forecast, by Region 2020 & 2033
- Table 6: Global Interactive Flat Panels Volume K Forecast, by Region 2020 & 2033
- Table 7: Global Interactive Flat Panels Revenue billion Forecast, by Application 2020 & 2033
- Table 8: Global Interactive Flat Panels Volume K Forecast, by Application 2020 & 2033
- Table 9: Global Interactive Flat Panels Revenue billion Forecast, by Types 2020 & 2033
- Table 10: Global Interactive Flat Panels Volume K Forecast, by Types 2020 & 2033
- Table 11: Global Interactive Flat Panels Revenue billion Forecast, by Country 2020 & 2033
- Table 12: Global Interactive Flat Panels Volume K Forecast, by Country 2020 & 2033
- Table 13: United States Interactive Flat Panels Revenue (billion) Forecast, by Application 2020 & 2033
- Table 14: United States Interactive Flat Panels Volume (K) Forecast, by Application 2020 & 2033
- Table 15: Canada Interactive Flat Panels Revenue (billion) Forecast, by Application 2020 & 2033
- Table 16: Canada Interactive Flat Panels Volume (K) Forecast, by Application 2020 & 2033
- Table 17: Mexico Interactive Flat Panels Revenue (billion) Forecast, by Application 2020 & 2033
- Table 18: Mexico Interactive Flat Panels Volume (K) Forecast, by Application 2020 & 2033
- Table 19: Global Interactive Flat Panels Revenue billion Forecast, by Application 2020 & 2033
- Table 20: Global Interactive Flat Panels Volume K Forecast, by Application 2020 & 2033
- Table 21: Global Interactive Flat Panels Revenue billion Forecast, by Types 2020 & 2033
- Table 22: Global Interactive Flat Panels Volume K Forecast, by Types 2020 & 2033
- Table 23: Global Interactive Flat Panels Revenue billion Forecast, by Country 2020 & 2033
- Table 24: Global Interactive Flat Panels Volume K Forecast, by Country 2020 & 2033
- Table 25: Brazil Interactive Flat Panels Revenue (billion) Forecast, by Application 2020 & 2033
- Table 26: Brazil Interactive Flat Panels Volume (K) Forecast, by Application 2020 & 2033
- Table 27: Argentina Interactive Flat Panels Revenue (billion) Forecast, by Application 2020 & 2033
- Table 28: Argentina Interactive Flat Panels Volume (K) Forecast, by Application 2020 & 2033
- Table 29: Rest of South America Interactive Flat Panels Revenue (billion) Forecast, by Application 2020 & 2033
- Table 30: Rest of South America Interactive Flat Panels Volume (K) Forecast, by Application 2020 & 2033
- Table 31: Global Interactive Flat Panels Revenue billion Forecast, by Application 2020 & 2033
- Table 32: Global Interactive Flat Panels Volume K Forecast, by Application 2020 & 2033
- Table 33: Global Interactive Flat Panels Revenue billion Forecast, by Types 2020 & 2033
- Table 34: Global Interactive Flat Panels Volume K Forecast, by Types 2020 & 2033
- Table 35: Global Interactive Flat Panels Revenue billion Forecast, by Country 2020 & 2033
- Table 36: Global Interactive Flat Panels Volume K Forecast, by Country 2020 & 2033
- Table 37: United Kingdom Interactive Flat Panels Revenue (billion) Forecast, by Application 2020 & 2033
- Table 38: United Kingdom Interactive Flat Panels Volume (K) Forecast, by Application 2020 & 2033
- Table 39: Germany Interactive Flat Panels Revenue (billion) Forecast, by Application 2020 & 2033
- Table 40: Germany Interactive Flat Panels Volume (K) Forecast, by Application 2020 & 2033
- Table 41: France Interactive Flat Panels Revenue (billion) Forecast, by Application 2020 & 2033
- Table 42: France Interactive Flat Panels Volume (K) Forecast, by Application 2020 & 2033
- Table 43: Italy Interactive Flat Panels Revenue (billion) Forecast, by Application 2020 & 2033
- Table 44: Italy Interactive Flat Panels Volume (K) Forecast, by Application 2020 & 2033
- Table 45: Spain Interactive Flat Panels Revenue (billion) Forecast, by Application 2020 & 2033
- Table 46: Spain Interactive Flat Panels Volume (K) Forecast, by Application 2020 & 2033
- Table 47: Russia Interactive Flat Panels Revenue (billion) Forecast, by Application 2020 & 2033
- Table 48: Russia Interactive Flat Panels Volume (K) Forecast, by Application 2020 & 2033
- Table 49: Benelux Interactive Flat Panels Revenue (billion) Forecast, by Application 2020 & 2033
- Table 50: Benelux Interactive Flat Panels Volume (K) Forecast, by Application 2020 & 2033
- Table 51: Nordics Interactive Flat Panels Revenue (billion) Forecast, by Application 2020 & 2033
- Table 52: Nordics Interactive Flat Panels Volume (K) Forecast, by Application 2020 & 2033
- Table 53: Rest of Europe Interactive Flat Panels Revenue (billion) Forecast, by Application 2020 & 2033
- Table 54: Rest of Europe Interactive Flat Panels Volume (K) Forecast, by Application 2020 & 2033
- Table 55: Global Interactive Flat Panels Revenue billion Forecast, by Application 2020 & 2033
- Table 56: Global Interactive Flat Panels Volume K Forecast, by Application 2020 & 2033
- Table 57: Global Interactive Flat Panels Revenue billion Forecast, by Types 2020 & 2033
- Table 58: Global Interactive Flat Panels Volume K Forecast, by Types 2020 & 2033
- Table 59: Global Interactive Flat Panels Revenue billion Forecast, by Country 2020 & 2033
- Table 60: Global Interactive Flat Panels Volume K Forecast, by Country 2020 & 2033
- Table 61: Turkey Interactive Flat Panels Revenue (billion) Forecast, by Application 2020 & 2033
- Table 62: Turkey Interactive Flat Panels Volume (K) Forecast, by Application 2020 & 2033
- Table 63: Israel Interactive Flat Panels Revenue (billion) Forecast, by Application 2020 & 2033
- Table 64: Israel Interactive Flat Panels Volume (K) Forecast, by Application 2020 & 2033
- Table 65: GCC Interactive Flat Panels Revenue (billion) Forecast, by Application 2020 & 2033
- Table 66: GCC Interactive Flat Panels Volume (K) Forecast, by Application 2020 & 2033
- Table 67: North Africa Interactive Flat Panels Revenue (billion) Forecast, by Application 2020 & 2033
- Table 68: North Africa Interactive Flat Panels Volume (K) Forecast, by Application 2020 & 2033
- Table 69: South Africa Interactive Flat Panels Revenue (billion) Forecast, by Application 2020 & 2033
- Table 70: South Africa Interactive Flat Panels Volume (K) Forecast, by Application 2020 & 2033
- Table 71: Rest of Middle East & Africa Interactive Flat Panels Revenue (billion) Forecast, by Application 2020 & 2033
- Table 72: Rest of Middle East & Africa Interactive Flat Panels Volume (K) Forecast, by Application 2020 & 2033
- Table 73: Global Interactive Flat Panels Revenue billion Forecast, by Application 2020 & 2033
- Table 74: Global Interactive Flat Panels Volume K Forecast, by Application 2020 & 2033
- Table 75: Global Interactive Flat Panels Revenue billion Forecast, by Types 2020 & 2033
- Table 76: Global Interactive Flat Panels Volume K Forecast, by Types 2020 & 2033
- Table 77: Global Interactive Flat Panels Revenue billion Forecast, by Country 2020 & 2033
- Table 78: Global Interactive Flat Panels Volume K Forecast, by Country 2020 & 2033
- Table 79: China Interactive Flat Panels Revenue (billion) Forecast, by Application 2020 & 2033
- Table 80: China Interactive Flat Panels Volume (K) Forecast, by Application 2020 & 2033
- Table 81: India Interactive Flat Panels Revenue (billion) Forecast, by Application 2020 & 2033
- Table 82: India Interactive Flat Panels Volume (K) Forecast, by Application 2020 & 2033
- Table 83: Japan Interactive Flat Panels Revenue (billion) Forecast, by Application 2020 & 2033
- Table 84: Japan Interactive Flat Panels Volume (K) Forecast, by Application 2020 & 2033
- Table 85: South Korea Interactive Flat Panels Revenue (billion) Forecast, by Application 2020 & 2033
- Table 86: South Korea Interactive Flat Panels Volume (K) Forecast, by Application 2020 & 2033
- Table 87: ASEAN Interactive Flat Panels Revenue (billion) Forecast, by Application 2020 & 2033
- Table 88: ASEAN Interactive Flat Panels Volume (K) Forecast, by Application 2020 & 2033
- Table 89: Oceania Interactive Flat Panels Revenue (billion) Forecast, by Application 2020 & 2033
- Table 90: Oceania Interactive Flat Panels Volume (K) Forecast, by Application 2020 & 2033
- Table 91: Rest of Asia Pacific Interactive Flat Panels Revenue (billion) Forecast, by Application 2020 & 2033
- Table 92: Rest of Asia Pacific Interactive Flat Panels Volume (K) Forecast, by Application 2020 & 2033
Frequently Asked Questions
1. What is the projected Compound Annual Growth Rate (CAGR) of the Interactive Flat Panels?
The projected CAGR is approximately 8.9%.
2. Which companies are prominent players in the Interactive Flat Panels?
Key companies in the market include Baanto International, Crystal Display Systems, ELO Touch Solutions, Gesturetek, Horizon Display, Interactive Touchscreen Solutions, Intuilab, LG Display, NEC Display Solutions, Panasonic, Planar Systems, Samsung Display.
3. What are the main segments of the Interactive Flat Panels?
The market segments include Application, Types.
4. Can you provide details about the market size?
The market size is estimated to be USD 6.26 billion as of 2022.
5. What are some drivers contributing to market growth?
N/A
6. What are the notable trends driving market growth?
N/A
7. Are there any restraints impacting market growth?
N/A
8. Can you provide examples of recent developments in the market?
N/A
9. What pricing options are available for accessing the report?
Pricing options include single-user, multi-user, and enterprise licenses priced at USD 3350.00, USD 5025.00, and USD 6700.00 respectively.
10. Is the market size provided in terms of value or volume?
The market size is provided in terms of value, measured in billion and volume, measured in K.
11. Are there any specific market keywords associated with the report?
Yes, the market keyword associated with the report is "Interactive Flat Panels," which aids in identifying and referencing the specific market segment covered.
12. How do I determine which pricing option suits my needs best?
The pricing options vary based on user requirements and access needs. Individual users may opt for single-user licenses, while businesses requiring broader access may choose multi-user or enterprise licenses for cost-effective access to the report.
13. Are there any additional resources or data provided in the Interactive Flat Panels report?
While the report offers comprehensive insights, it's advisable to review the specific contents or supplementary materials provided to ascertain if additional resources or data are available.
14. How can I stay updated on further developments or reports in the Interactive Flat Panels?
To stay informed about further developments, trends, and reports in the Interactive Flat Panels, consider subscribing to industry newsletters, following relevant companies and organizations, or regularly checking reputable industry news sources and publications.
Methodology
Step 1 - Identification of Relevant Samples Size from Population Database


Step 2 - Approaches for Defining Global Market Size (Value, Volume* & Price*)

Note*: In applicable scenarios
Step 3 - Data Sources
Primary Research
- Web Analytics
- Survey Reports
- Research Institute
- Latest Research Reports
- Opinion Leaders
Secondary Research
- Annual Reports
- White Paper
- Latest Press Release
- Industry Association
- Paid Database
- Investor Presentations

Step 4 - Data Triangulation
Involves using different sources of information in order to increase the validity of a study
These sources are likely to be stakeholders in a program - participants, other researchers, program staff, other community members, and so on.
Then we put all data in single framework & apply various statistical tools to find out the dynamic on the market.
During the analysis stage, feedback from the stakeholder groups would be compared to determine areas of agreement as well as areas of divergence