

Key Insights
The Integrated Base Station market is poised for significant expansion, projected to reach a substantial $199 million by 2025. This growth is fueled by a robust Compound Annual Growth Rate (CAGR) of 5.7% over the forecast period of 2025-2033. The escalating demand for enhanced connectivity and the rapid adoption of advanced technologies across various sectors are the primary market drivers. Industries such as Smart Mining, Intelligent Manufacturing, Medical Care, and Transportation are increasingly relying on integrated base stations to support their digital transformation initiatives. These solutions offer a consolidated approach to network infrastructure, simplifying deployment and improving operational efficiency. The evolution from 4G to 5G base stations further amplifies this growth, as businesses seek the superior speed, lower latency, and greater capacity that 5G networks provide. The increasing investment in infrastructure development and the growing need for seamless communication in remote or harsh environments are also contributing to the market's upward trajectory.
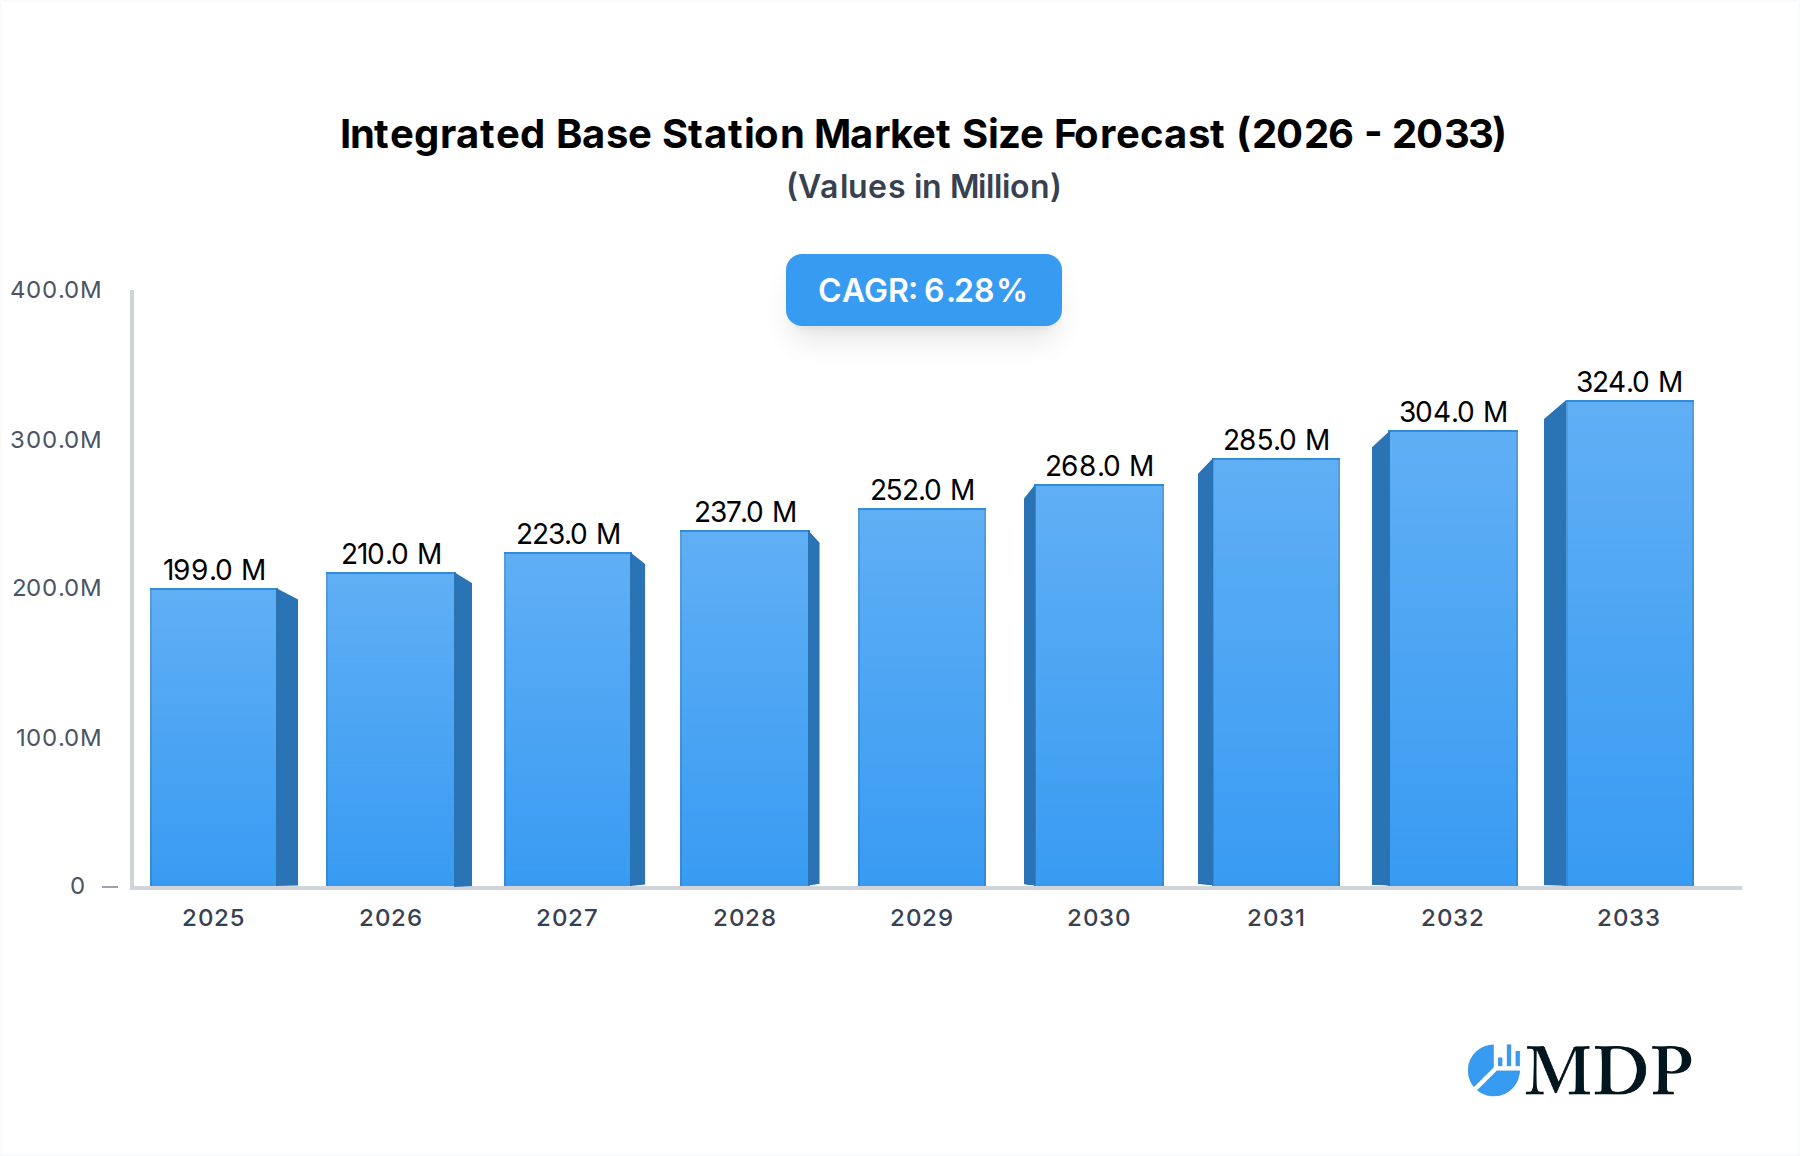
Integrated Base Station Market Size (In Million)
The market is characterized by key trends that are shaping its development. The convergence of multiple network functions within a single base station unit, along with advancements in small cell technology, is leading to more flexible and cost-effective deployments. Furthermore, the integration of AI and machine learning capabilities into base station management systems promises to optimize network performance and resource allocation. While the market exhibits strong growth potential, certain restraints need to be considered. High initial investment costs for advanced integrated base station solutions and the ongoing need for skilled personnel for installation and maintenance can pose challenges. However, the long-term benefits of enhanced operational efficiency, improved data processing capabilities, and the enablement of new service offerings are expected to outweigh these initial hurdles, driving sustained market expansion.

Integrated Base Station Company Market Share
Unlocking the Future: Integrated Base Station Market Analysis and Strategic Outlook (2019–2033)
This comprehensive report delves into the dynamic global Integrated Base Station market, offering in-depth analysis and actionable insights for industry stakeholders. Spanning from 2019 to 2033, with a base year of 2025, this study provides a robust understanding of market drivers, trends, leading players, and future opportunities in this rapidly evolving sector. Expect to uncover critical data on 4G and 5G base station advancements across key applications like Smart Mining, Intelligent Manufacturing, Medical Care, and Transportation. With an estimated market size projected in the millions, this report is your essential guide to navigating the competitive landscape and capitalizing on the immense potential of integrated base station technology.
Integrated Base Station Market Dynamics & Concentration
The Integrated Base Station market is characterized by a moderate concentration of key players, with a significant share held by established telecommunications equipment providers and emerging technology innovators. Innovation is a primary driver, fueled by the relentless pursuit of higher bandwidth, lower latency, and more efficient spectrum utilization. Regulatory frameworks play a crucial role, with governments worldwide establishing policies to promote 5G deployment and private network adoption, directly impacting market accessibility and investment. Product substitutes, such as distributed antenna systems (DAS) and standalone Wi-Fi solutions, exist, but integrated base stations offer superior performance and seamless integration for demanding enterprise applications. End-user trends are increasingly favoring private network solutions tailored for specific industry needs, driving demand for customized and highly available communication infrastructure. Mergers and Acquisitions (M&A) activities are a notable aspect of market concentration, with an estimated xx M&A deals observed during the historical period, indicating a consolidation trend as larger players acquire innovative startups to enhance their technology portfolios and market reach. The overall market share distribution indicates that the top 5 players command an estimated xx% of the global market, with significant opportunities for growth for niche players and new entrants.
Integrated Base Station Industry Trends & Analysis
The Integrated Base Station industry is poised for substantial growth, driven by the accelerating digital transformation across various sectors. Market growth drivers include the escalating demand for high-speed, reliable connectivity in enterprise environments, coupled with the increasing adoption of IoT devices and mission-critical applications. Technological disruptions are at the forefront of this evolution, with continuous advancements in 5G technology, including Massive MIMO, beamforming, and network slicing, enabling unprecedented performance and flexibility. The integration of AI and machine learning within base station architecture is further enhancing network efficiency, predictive maintenance, and resource allocation, promising a projected compound annual growth rate (CAGR) of approximately xx% during the forecast period. Consumer preferences are shifting towards seamless, high-performance connectivity solutions that support data-intensive applications and enhance user experience. In the enterprise realm, this translates to a demand for private and dedicated networks that offer greater control, security, and customization. Competitive dynamics are intensifying, with both incumbent telecommunications giants and agile technology firms vying for market share. This competition is fostering innovation and driving down costs, making integrated base stations more accessible to a wider range of industries. Market penetration of integrated base stations in industrial settings is projected to reach xx% by 2033, up from an estimated xx% in the base year of 2025, highlighting the significant expansion potential within this sector. The development of open RAN architectures is also contributing to a more diverse and competitive vendor ecosystem, further stimulating market growth.
Leading Markets & Segments in Integrated Base Station
The Integrated Base Station market is experiencing significant regional and segmental dominance. Asia Pacific, particularly China, stands out as a leading market, driven by robust government initiatives supporting 5G infrastructure development and extensive private network deployments in manufacturing and industrial zones. The country's proactive economic policies and substantial investments in telecommunications infrastructure have created a fertile ground for integrated base station adoption.
Within the application segments, Intelligent Manufacturing and Smart Mining are emerging as dominant forces.
Intelligent Manufacturing:
- Key Drivers: The imperative for increased automation, real-time data analytics, and enhanced operational efficiency in smart factories. The need for reliable, low-latency communication to support robotics, AI-powered quality control, and predictive maintenance systems. Economic policies incentivizing Industry 4.0 adoption.
- Dominance Analysis: This segment benefits from massive investments in upgrading existing factory infrastructure and building new, highly automated production facilities. Integrated base stations provide the backbone for seamless data flow between machines, sensors, and control systems, enabling unprecedented levels of productivity and flexibility. The market for intelligent manufacturing is projected to reach xx million in the forecast period.
Smart Mining:
- Key Drivers: The demand for improved safety, remote operation of heavy machinery, and real-time monitoring in hazardous mining environments. The ability of integrated base stations to provide robust connectivity in remote and challenging terrains is crucial. Regulatory frameworks pushing for safer and more efficient mining operations.
- Dominance Analysis: Integrated base stations enable the deployment of autonomous vehicles, drones for surveying and inspection, and advanced sensor networks, significantly enhancing safety and operational efficiency in mines. The remoteness and harsh conditions of mining operations make traditional connectivity solutions insufficient, thus favoring integrated base stations. The projected market size for smart mining applications is estimated to reach xx million.
In terms of Type, the 5G Base Station segment is experiencing the most rapid growth and is projected to lead the market.
- 5G Base Station:
- Key Drivers: The superior speed, capacity, and low latency offered by 5G technology are essential for supporting advanced applications in manufacturing, smart cities, and beyond. The ongoing global rollout of 5G networks creates a direct demand for 5G-enabled base stations.
- Dominance Analysis: While 4G base stations continue to play a role, the future of integrated base stations is intrinsically linked to 5G technology. The capabilities of 5G, such as network slicing and ultra-reliable low-latency communication (URLLC), are particularly crucial for mission-critical enterprise use cases. The market for 5G integrated base stations is anticipated to grow to xx million by 2033.
Integrated Base Station Product Developments
Recent product developments in the Integrated Base Station sector focus on enhancing modularity, energy efficiency, and AI-driven performance optimization. Companies are innovating with smaller, more power-efficient base station units that can be easily deployed in diverse environments. Advanced software capabilities, including AI-powered spectrum management and self-healing network features, are becoming standard, offering improved reliability and reduced operational costs. The integration of enhanced security protocols and support for private 5G network deployment are key competitive advantages, catering to the growing demand for secure and dedicated enterprise communication solutions. These advancements are driven by the need to meet the stringent performance requirements of emerging applications in smart mining, intelligent manufacturing, and other mission-critical sectors.
Key Drivers of Integrated Base Station Growth
The growth of the Integrated Base Station market is primarily propelled by several key factors. Firstly, the relentless demand for enhanced connectivity in industrial and enterprise settings, driven by the proliferation of IoT devices and the need for real-time data processing. Secondly, the accelerating global adoption of 5G technology, which unlocks new capabilities for low-latency, high-bandwidth communication essential for mission-critical applications. Thirdly, government initiatives and smart city projects worldwide are actively promoting the deployment of advanced communication infrastructure, creating a favorable regulatory environment. Finally, the increasing focus on operational efficiency and automation across industries like manufacturing and mining necessitates robust and reliable private network solutions, directly fueling the demand for integrated base stations.
Challenges in the Integrated Base Station Market
Despite the promising growth trajectory, the Integrated Base Station market faces several significant challenges. Regulatory hurdles, particularly in spectrum allocation and deployment permits, can slow down network rollouts. Supply chain disruptions and the increasing complexity of hardware components present ongoing concerns for manufacturers, potentially impacting production timelines and costs, with an estimated xx% increase in production lead times observed historically. Furthermore, intense competitive pressures from established players and new entrants can lead to price erosion and necessitate continuous investment in R&D to maintain market relevance. The high initial investment cost for deploying advanced integrated base station solutions can also be a barrier for some smaller enterprises.
Emerging Opportunities in Integrated Base Station
Emerging opportunities in the Integrated Base Station market are primarily driven by technological breakthroughs and strategic market expansion. The continued evolution of 5G standards, particularly towards 6G, will open new avenues for enhanced performance and novel applications. The burgeoning demand for private 5G networks in enterprise verticals, such as logistics, agriculture, and public safety, presents a significant growth catalyst. Strategic partnerships between telecom operators, equipment vendors, and industry-specific solution providers are crucial for co-creating tailored solutions and accelerating market penetration. Furthermore, the increasing focus on edge computing, where processing power is brought closer to the data source, will see integrated base stations playing a pivotal role in enabling these distributed computing architectures, further expanding their utility and market reach.
Leading Players in the Integrated Base Station Sector
- Comba Telecom
- Vicinity Tec
- Vicinity Technologies
- NEC
- Inspur Group
- Hytera
- Sunwave
- SageRAN Technology
- Signalwing Corporation
- Baicells
- Beijing Changkun
Key Milestones in Integrated Base Station Industry
- 2019/05: Launch of early 5G integrated base station prototypes demonstrating enhanced spectrum efficiency.
- 2020/01: Significant increase in R&D investments by major players to accelerate 5G integration.
- 2021/07: First large-scale commercial deployments of private 5G integrated base stations in intelligent manufacturing facilities.
- 2022/03: Release of new standards for open RAN architectures, fostering greater vendor diversity.
- 2023/11: Growing interest and pilot projects for integrated base stations in smart mining applications.
- 2024/04: Advancements in AI-driven network management for integrated base stations leading to improved operational efficiency.
Strategic Outlook for Integrated Base Station Market
The strategic outlook for the Integrated Base Station market is exceptionally positive, characterized by sustained growth and diversification. The increasing demand for private 5G networks, driven by the need for enhanced security, performance, and customization in enterprise environments, will be a key growth accelerator. Continuous innovation in areas like AI integration, energy efficiency, and edge computing will further solidify the market position of integrated base stations. Strategic partnerships and collaborations will be crucial for developing industry-specific solutions and expanding into new application verticals. The ongoing global rollout of 5G infrastructure will continue to create a strong foundation for market expansion, with an anticipated overall market potential reaching xx million by 2033.
Integrated Base Station Segmentation
-
1. Application
- 1.1. Smart Mining
- 1.2. Intelligent Manufacturing
- 1.3. Medical Care
- 1.4. Transportation
- 1.5. Other
-
2. Type
- 2.1. 4G Base Station
- 2.2. 5G Base Station
Integrated Base Station Segmentation By Geography
-
1. North America
- 1.1. United States
- 1.2. Canada
- 1.3. Mexico
-
2. South America
- 2.1. Brazil
- 2.2. Argentina
- 2.3. Rest of South America
-
3. Europe
- 3.1. United Kingdom
- 3.2. Germany
- 3.3. France
- 3.4. Italy
- 3.5. Spain
- 3.6. Russia
- 3.7. Benelux
- 3.8. Nordics
- 3.9. Rest of Europe
-
4. Middle East & Africa
- 4.1. Turkey
- 4.2. Israel
- 4.3. GCC
- 4.4. North Africa
- 4.5. South Africa
- 4.6. Rest of Middle East & Africa
-
5. Asia Pacific
- 5.1. China
- 5.2. India
- 5.3. Japan
- 5.4. South Korea
- 5.5. ASEAN
- 5.6. Oceania
- 5.7. Rest of Asia Pacific
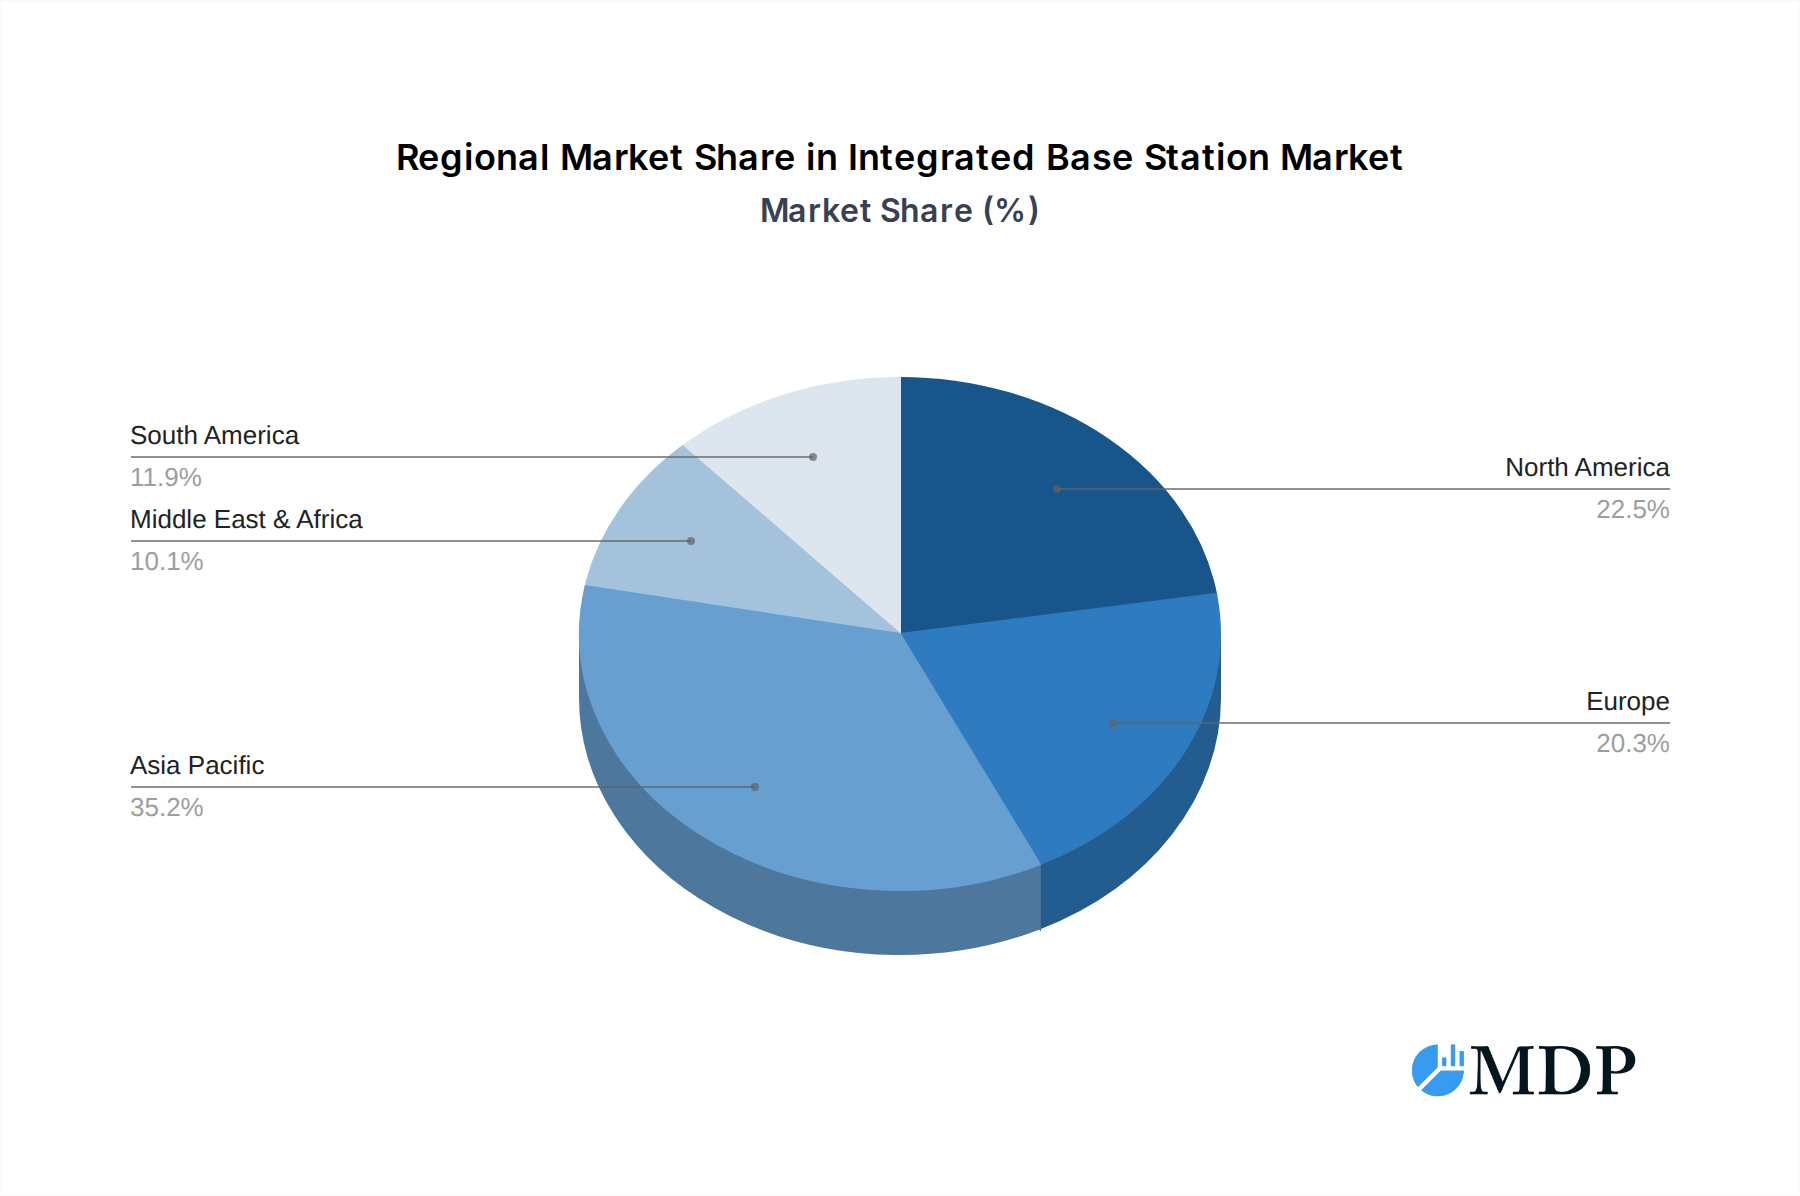
Integrated Base Station Regional Market Share
Geographic Coverage of Integrated Base Station
Integrated Base Station REPORT HIGHLIGHTS
| Aspects | Details |
|---|---|
| Study Period | 2020-2034 |
| Base Year | 2025 |
| Estimated Year | 2026 |
| Forecast Period | 2026-2034 |
| Historical Period | 2020-2025 |
| Growth Rate | CAGR of 5.7% from 2020-2034 |
| Segmentation |
|
Table of Contents
- 1. Introduction
- 1.1. Research Scope
- 1.2. Market Segmentation
- 1.3. Research Methodology
- 1.4. Definitions and Assumptions
- 2. Executive Summary
- 2.1. Introduction
- 3. Market Dynamics
- 3.1. Introduction
- 3.2. Market Drivers
- 3.3. Market Restrains
- 3.4. Market Trends
- 4. Market Factor Analysis
- 4.1. Porters Five Forces
- 4.2. Supply/Value Chain
- 4.3. PESTEL analysis
- 4.4. Market Entropy
- 4.5. Patent/Trademark Analysis
- 5. Global Integrated Base Station Analysis, Insights and Forecast, 2020-2032
- 5.1. Market Analysis, Insights and Forecast - by Application
- 5.1.1. Smart Mining
- 5.1.2. Intelligent Manufacturing
- 5.1.3. Medical Care
- 5.1.4. Transportation
- 5.1.5. Other
- 5.2. Market Analysis, Insights and Forecast - by Type
- 5.2.1. 4G Base Station
- 5.2.2. 5G Base Station
- 5.3. Market Analysis, Insights and Forecast - by Region
- 5.3.1. North America
- 5.3.2. South America
- 5.3.3. Europe
- 5.3.4. Middle East & Africa
- 5.3.5. Asia Pacific
- 5.1. Market Analysis, Insights and Forecast - by Application
- 6. North America Integrated Base Station Analysis, Insights and Forecast, 2020-2032
- 6.1. Market Analysis, Insights and Forecast - by Application
- 6.1.1. Smart Mining
- 6.1.2. Intelligent Manufacturing
- 6.1.3. Medical Care
- 6.1.4. Transportation
- 6.1.5. Other
- 6.2. Market Analysis, Insights and Forecast - by Type
- 6.2.1. 4G Base Station
- 6.2.2. 5G Base Station
- 6.1. Market Analysis, Insights and Forecast - by Application
- 7. South America Integrated Base Station Analysis, Insights and Forecast, 2020-2032
- 7.1. Market Analysis, Insights and Forecast - by Application
- 7.1.1. Smart Mining
- 7.1.2. Intelligent Manufacturing
- 7.1.3. Medical Care
- 7.1.4. Transportation
- 7.1.5. Other
- 7.2. Market Analysis, Insights and Forecast - by Type
- 7.2.1. 4G Base Station
- 7.2.2. 5G Base Station
- 7.1. Market Analysis, Insights and Forecast - by Application
- 8. Europe Integrated Base Station Analysis, Insights and Forecast, 2020-2032
- 8.1. Market Analysis, Insights and Forecast - by Application
- 8.1.1. Smart Mining
- 8.1.2. Intelligent Manufacturing
- 8.1.3. Medical Care
- 8.1.4. Transportation
- 8.1.5. Other
- 8.2. Market Analysis, Insights and Forecast - by Type
- 8.2.1. 4G Base Station
- 8.2.2. 5G Base Station
- 8.1. Market Analysis, Insights and Forecast - by Application
- 9. Middle East & Africa Integrated Base Station Analysis, Insights and Forecast, 2020-2032
- 9.1. Market Analysis, Insights and Forecast - by Application
- 9.1.1. Smart Mining
- 9.1.2. Intelligent Manufacturing
- 9.1.3. Medical Care
- 9.1.4. Transportation
- 9.1.5. Other
- 9.2. Market Analysis, Insights and Forecast - by Type
- 9.2.1. 4G Base Station
- 9.2.2. 5G Base Station
- 9.1. Market Analysis, Insights and Forecast - by Application
- 10. Asia Pacific Integrated Base Station Analysis, Insights and Forecast, 2020-2032
- 10.1. Market Analysis, Insights and Forecast - by Application
- 10.1.1. Smart Mining
- 10.1.2. Intelligent Manufacturing
- 10.1.3. Medical Care
- 10.1.4. Transportation
- 10.1.5. Other
- 10.2. Market Analysis, Insights and Forecast - by Type
- 10.2.1. 4G Base Station
- 10.2.2. 5G Base Station
- 10.1. Market Analysis, Insights and Forecast - by Application
- 11. Competitive Analysis
- 11.1. Global Market Share Analysis 2025
- 11.2. Company Profiles
- 11.2.1 Comba Telecom
- 11.2.1.1. Overview
- 11.2.1.2. Products
- 11.2.1.3. SWOT Analysis
- 11.2.1.4. Recent Developments
- 11.2.1.5. Financials (Based on Availability)
- 11.2.2 Vicinity TecVicinity Technologies
- 11.2.2.1. Overview
- 11.2.2.2. Products
- 11.2.2.3. SWOT Analysis
- 11.2.2.4. Recent Developments
- 11.2.2.5. Financials (Based on Availability)
- 11.2.3 NEC
- 11.2.3.1. Overview
- 11.2.3.2. Products
- 11.2.3.3. SWOT Analysis
- 11.2.3.4. Recent Developments
- 11.2.3.5. Financials (Based on Availability)
- 11.2.4 Inspur Group
- 11.2.4.1. Overview
- 11.2.4.2. Products
- 11.2.4.3. SWOT Analysis
- 11.2.4.4. Recent Developments
- 11.2.4.5. Financials (Based on Availability)
- 11.2.5 Hytera
- 11.2.5.1. Overview
- 11.2.5.2. Products
- 11.2.5.3. SWOT Analysis
- 11.2.5.4. Recent Developments
- 11.2.5.5. Financials (Based on Availability)
- 11.2.6 Sunwave
- 11.2.6.1. Overview
- 11.2.6.2. Products
- 11.2.6.3. SWOT Analysis
- 11.2.6.4. Recent Developments
- 11.2.6.5. Financials (Based on Availability)
- 11.2.7 SageRAN Technology
- 11.2.7.1. Overview
- 11.2.7.2. Products
- 11.2.7.3. SWOT Analysis
- 11.2.7.4. Recent Developments
- 11.2.7.5. Financials (Based on Availability)
- 11.2.8 Signalwing Corporation
- 11.2.8.1. Overview
- 11.2.8.2. Products
- 11.2.8.3. SWOT Analysis
- 11.2.8.4. Recent Developments
- 11.2.8.5. Financials (Based on Availability)
- 11.2.9 Baicells
- 11.2.9.1. Overview
- 11.2.9.2. Products
- 11.2.9.3. SWOT Analysis
- 11.2.9.4. Recent Developments
- 11.2.9.5. Financials (Based on Availability)
- 11.2.10 Beijing Changkun
- 11.2.10.1. Overview
- 11.2.10.2. Products
- 11.2.10.3. SWOT Analysis
- 11.2.10.4. Recent Developments
- 11.2.10.5. Financials (Based on Availability)
- 11.2.1 Comba Telecom
List of Figures
- Figure 1: Global Integrated Base Station Revenue Breakdown (million, %) by Region 2025 & 2033
- Figure 2: Global Integrated Base Station Volume Breakdown (K, %) by Region 2025 & 2033
- Figure 3: North America Integrated Base Station Revenue (million), by Application 2025 & 2033
- Figure 4: North America Integrated Base Station Volume (K), by Application 2025 & 2033
- Figure 5: North America Integrated Base Station Revenue Share (%), by Application 2025 & 2033
- Figure 6: North America Integrated Base Station Volume Share (%), by Application 2025 & 2033
- Figure 7: North America Integrated Base Station Revenue (million), by Type 2025 & 2033
- Figure 8: North America Integrated Base Station Volume (K), by Type 2025 & 2033
- Figure 9: North America Integrated Base Station Revenue Share (%), by Type 2025 & 2033
- Figure 10: North America Integrated Base Station Volume Share (%), by Type 2025 & 2033
- Figure 11: North America Integrated Base Station Revenue (million), by Country 2025 & 2033
- Figure 12: North America Integrated Base Station Volume (K), by Country 2025 & 2033
- Figure 13: North America Integrated Base Station Revenue Share (%), by Country 2025 & 2033
- Figure 14: North America Integrated Base Station Volume Share (%), by Country 2025 & 2033
- Figure 15: South America Integrated Base Station Revenue (million), by Application 2025 & 2033
- Figure 16: South America Integrated Base Station Volume (K), by Application 2025 & 2033
- Figure 17: South America Integrated Base Station Revenue Share (%), by Application 2025 & 2033
- Figure 18: South America Integrated Base Station Volume Share (%), by Application 2025 & 2033
- Figure 19: South America Integrated Base Station Revenue (million), by Type 2025 & 2033
- Figure 20: South America Integrated Base Station Volume (K), by Type 2025 & 2033
- Figure 21: South America Integrated Base Station Revenue Share (%), by Type 2025 & 2033
- Figure 22: South America Integrated Base Station Volume Share (%), by Type 2025 & 2033
- Figure 23: South America Integrated Base Station Revenue (million), by Country 2025 & 2033
- Figure 24: South America Integrated Base Station Volume (K), by Country 2025 & 2033
- Figure 25: South America Integrated Base Station Revenue Share (%), by Country 2025 & 2033
- Figure 26: South America Integrated Base Station Volume Share (%), by Country 2025 & 2033
- Figure 27: Europe Integrated Base Station Revenue (million), by Application 2025 & 2033
- Figure 28: Europe Integrated Base Station Volume (K), by Application 2025 & 2033
- Figure 29: Europe Integrated Base Station Revenue Share (%), by Application 2025 & 2033
- Figure 30: Europe Integrated Base Station Volume Share (%), by Application 2025 & 2033
- Figure 31: Europe Integrated Base Station Revenue (million), by Type 2025 & 2033
- Figure 32: Europe Integrated Base Station Volume (K), by Type 2025 & 2033
- Figure 33: Europe Integrated Base Station Revenue Share (%), by Type 2025 & 2033
- Figure 34: Europe Integrated Base Station Volume Share (%), by Type 2025 & 2033
- Figure 35: Europe Integrated Base Station Revenue (million), by Country 2025 & 2033
- Figure 36: Europe Integrated Base Station Volume (K), by Country 2025 & 2033
- Figure 37: Europe Integrated Base Station Revenue Share (%), by Country 2025 & 2033
- Figure 38: Europe Integrated Base Station Volume Share (%), by Country 2025 & 2033
- Figure 39: Middle East & Africa Integrated Base Station Revenue (million), by Application 2025 & 2033
- Figure 40: Middle East & Africa Integrated Base Station Volume (K), by Application 2025 & 2033
- Figure 41: Middle East & Africa Integrated Base Station Revenue Share (%), by Application 2025 & 2033
- Figure 42: Middle East & Africa Integrated Base Station Volume Share (%), by Application 2025 & 2033
- Figure 43: Middle East & Africa Integrated Base Station Revenue (million), by Type 2025 & 2033
- Figure 44: Middle East & Africa Integrated Base Station Volume (K), by Type 2025 & 2033
- Figure 45: Middle East & Africa Integrated Base Station Revenue Share (%), by Type 2025 & 2033
- Figure 46: Middle East & Africa Integrated Base Station Volume Share (%), by Type 2025 & 2033
- Figure 47: Middle East & Africa Integrated Base Station Revenue (million), by Country 2025 & 2033
- Figure 48: Middle East & Africa Integrated Base Station Volume (K), by Country 2025 & 2033
- Figure 49: Middle East & Africa Integrated Base Station Revenue Share (%), by Country 2025 & 2033
- Figure 50: Middle East & Africa Integrated Base Station Volume Share (%), by Country 2025 & 2033
- Figure 51: Asia Pacific Integrated Base Station Revenue (million), by Application 2025 & 2033
- Figure 52: Asia Pacific Integrated Base Station Volume (K), by Application 2025 & 2033
- Figure 53: Asia Pacific Integrated Base Station Revenue Share (%), by Application 2025 & 2033
- Figure 54: Asia Pacific Integrated Base Station Volume Share (%), by Application 2025 & 2033
- Figure 55: Asia Pacific Integrated Base Station Revenue (million), by Type 2025 & 2033
- Figure 56: Asia Pacific Integrated Base Station Volume (K), by Type 2025 & 2033
- Figure 57: Asia Pacific Integrated Base Station Revenue Share (%), by Type 2025 & 2033
- Figure 58: Asia Pacific Integrated Base Station Volume Share (%), by Type 2025 & 2033
- Figure 59: Asia Pacific Integrated Base Station Revenue (million), by Country 2025 & 2033
- Figure 60: Asia Pacific Integrated Base Station Volume (K), by Country 2025 & 2033
- Figure 61: Asia Pacific Integrated Base Station Revenue Share (%), by Country 2025 & 2033
- Figure 62: Asia Pacific Integrated Base Station Volume Share (%), by Country 2025 & 2033
List of Tables
- Table 1: Global Integrated Base Station Revenue million Forecast, by Application 2020 & 2033
- Table 2: Global Integrated Base Station Volume K Forecast, by Application 2020 & 2033
- Table 3: Global Integrated Base Station Revenue million Forecast, by Type 2020 & 2033
- Table 4: Global Integrated Base Station Volume K Forecast, by Type 2020 & 2033
- Table 5: Global Integrated Base Station Revenue million Forecast, by Region 2020 & 2033
- Table 6: Global Integrated Base Station Volume K Forecast, by Region 2020 & 2033
- Table 7: Global Integrated Base Station Revenue million Forecast, by Application 2020 & 2033
- Table 8: Global Integrated Base Station Volume K Forecast, by Application 2020 & 2033
- Table 9: Global Integrated Base Station Revenue million Forecast, by Type 2020 & 2033
- Table 10: Global Integrated Base Station Volume K Forecast, by Type 2020 & 2033
- Table 11: Global Integrated Base Station Revenue million Forecast, by Country 2020 & 2033
- Table 12: Global Integrated Base Station Volume K Forecast, by Country 2020 & 2033
- Table 13: United States Integrated Base Station Revenue (million) Forecast, by Application 2020 & 2033
- Table 14: United States Integrated Base Station Volume (K) Forecast, by Application 2020 & 2033
- Table 15: Canada Integrated Base Station Revenue (million) Forecast, by Application 2020 & 2033
- Table 16: Canada Integrated Base Station Volume (K) Forecast, by Application 2020 & 2033
- Table 17: Mexico Integrated Base Station Revenue (million) Forecast, by Application 2020 & 2033
- Table 18: Mexico Integrated Base Station Volume (K) Forecast, by Application 2020 & 2033
- Table 19: Global Integrated Base Station Revenue million Forecast, by Application 2020 & 2033
- Table 20: Global Integrated Base Station Volume K Forecast, by Application 2020 & 2033
- Table 21: Global Integrated Base Station Revenue million Forecast, by Type 2020 & 2033
- Table 22: Global Integrated Base Station Volume K Forecast, by Type 2020 & 2033
- Table 23: Global Integrated Base Station Revenue million Forecast, by Country 2020 & 2033
- Table 24: Global Integrated Base Station Volume K Forecast, by Country 2020 & 2033
- Table 25: Brazil Integrated Base Station Revenue (million) Forecast, by Application 2020 & 2033
- Table 26: Brazil Integrated Base Station Volume (K) Forecast, by Application 2020 & 2033
- Table 27: Argentina Integrated Base Station Revenue (million) Forecast, by Application 2020 & 2033
- Table 28: Argentina Integrated Base Station Volume (K) Forecast, by Application 2020 & 2033
- Table 29: Rest of South America Integrated Base Station Revenue (million) Forecast, by Application 2020 & 2033
- Table 30: Rest of South America Integrated Base Station Volume (K) Forecast, by Application 2020 & 2033
- Table 31: Global Integrated Base Station Revenue million Forecast, by Application 2020 & 2033
- Table 32: Global Integrated Base Station Volume K Forecast, by Application 2020 & 2033
- Table 33: Global Integrated Base Station Revenue million Forecast, by Type 2020 & 2033
- Table 34: Global Integrated Base Station Volume K Forecast, by Type 2020 & 2033
- Table 35: Global Integrated Base Station Revenue million Forecast, by Country 2020 & 2033
- Table 36: Global Integrated Base Station Volume K Forecast, by Country 2020 & 2033
- Table 37: United Kingdom Integrated Base Station Revenue (million) Forecast, by Application 2020 & 2033
- Table 38: United Kingdom Integrated Base Station Volume (K) Forecast, by Application 2020 & 2033
- Table 39: Germany Integrated Base Station Revenue (million) Forecast, by Application 2020 & 2033
- Table 40: Germany Integrated Base Station Volume (K) Forecast, by Application 2020 & 2033
- Table 41: France Integrated Base Station Revenue (million) Forecast, by Application 2020 & 2033
- Table 42: France Integrated Base Station Volume (K) Forecast, by Application 2020 & 2033
- Table 43: Italy Integrated Base Station Revenue (million) Forecast, by Application 2020 & 2033
- Table 44: Italy Integrated Base Station Volume (K) Forecast, by Application 2020 & 2033
- Table 45: Spain Integrated Base Station Revenue (million) Forecast, by Application 2020 & 2033
- Table 46: Spain Integrated Base Station Volume (K) Forecast, by Application 2020 & 2033
- Table 47: Russia Integrated Base Station Revenue (million) Forecast, by Application 2020 & 2033
- Table 48: Russia Integrated Base Station Volume (K) Forecast, by Application 2020 & 2033
- Table 49: Benelux Integrated Base Station Revenue (million) Forecast, by Application 2020 & 2033
- Table 50: Benelux Integrated Base Station Volume (K) Forecast, by Application 2020 & 2033
- Table 51: Nordics Integrated Base Station Revenue (million) Forecast, by Application 2020 & 2033
- Table 52: Nordics Integrated Base Station Volume (K) Forecast, by Application 2020 & 2033
- Table 53: Rest of Europe Integrated Base Station Revenue (million) Forecast, by Application 2020 & 2033
- Table 54: Rest of Europe Integrated Base Station Volume (K) Forecast, by Application 2020 & 2033
- Table 55: Global Integrated Base Station Revenue million Forecast, by Application 2020 & 2033
- Table 56: Global Integrated Base Station Volume K Forecast, by Application 2020 & 2033
- Table 57: Global Integrated Base Station Revenue million Forecast, by Type 2020 & 2033
- Table 58: Global Integrated Base Station Volume K Forecast, by Type 2020 & 2033
- Table 59: Global Integrated Base Station Revenue million Forecast, by Country 2020 & 2033
- Table 60: Global Integrated Base Station Volume K Forecast, by Country 2020 & 2033
- Table 61: Turkey Integrated Base Station Revenue (million) Forecast, by Application 2020 & 2033
- Table 62: Turkey Integrated Base Station Volume (K) Forecast, by Application 2020 & 2033
- Table 63: Israel Integrated Base Station Revenue (million) Forecast, by Application 2020 & 2033
- Table 64: Israel Integrated Base Station Volume (K) Forecast, by Application 2020 & 2033
- Table 65: GCC Integrated Base Station Revenue (million) Forecast, by Application 2020 & 2033
- Table 66: GCC Integrated Base Station Volume (K) Forecast, by Application 2020 & 2033
- Table 67: North Africa Integrated Base Station Revenue (million) Forecast, by Application 2020 & 2033
- Table 68: North Africa Integrated Base Station Volume (K) Forecast, by Application 2020 & 2033
- Table 69: South Africa Integrated Base Station Revenue (million) Forecast, by Application 2020 & 2033
- Table 70: South Africa Integrated Base Station Volume (K) Forecast, by Application 2020 & 2033
- Table 71: Rest of Middle East & Africa Integrated Base Station Revenue (million) Forecast, by Application 2020 & 2033
- Table 72: Rest of Middle East & Africa Integrated Base Station Volume (K) Forecast, by Application 2020 & 2033
- Table 73: Global Integrated Base Station Revenue million Forecast, by Application 2020 & 2033
- Table 74: Global Integrated Base Station Volume K Forecast, by Application 2020 & 2033
- Table 75: Global Integrated Base Station Revenue million Forecast, by Type 2020 & 2033
- Table 76: Global Integrated Base Station Volume K Forecast, by Type 2020 & 2033
- Table 77: Global Integrated Base Station Revenue million Forecast, by Country 2020 & 2033
- Table 78: Global Integrated Base Station Volume K Forecast, by Country 2020 & 2033
- Table 79: China Integrated Base Station Revenue (million) Forecast, by Application 2020 & 2033
- Table 80: China Integrated Base Station Volume (K) Forecast, by Application 2020 & 2033
- Table 81: India Integrated Base Station Revenue (million) Forecast, by Application 2020 & 2033
- Table 82: India Integrated Base Station Volume (K) Forecast, by Application 2020 & 2033
- Table 83: Japan Integrated Base Station Revenue (million) Forecast, by Application 2020 & 2033
- Table 84: Japan Integrated Base Station Volume (K) Forecast, by Application 2020 & 2033
- Table 85: South Korea Integrated Base Station Revenue (million) Forecast, by Application 2020 & 2033
- Table 86: South Korea Integrated Base Station Volume (K) Forecast, by Application 2020 & 2033
- Table 87: ASEAN Integrated Base Station Revenue (million) Forecast, by Application 2020 & 2033
- Table 88: ASEAN Integrated Base Station Volume (K) Forecast, by Application 2020 & 2033
- Table 89: Oceania Integrated Base Station Revenue (million) Forecast, by Application 2020 & 2033
- Table 90: Oceania Integrated Base Station Volume (K) Forecast, by Application 2020 & 2033
- Table 91: Rest of Asia Pacific Integrated Base Station Revenue (million) Forecast, by Application 2020 & 2033
- Table 92: Rest of Asia Pacific Integrated Base Station Volume (K) Forecast, by Application 2020 & 2033
Frequently Asked Questions
1. What is the projected Compound Annual Growth Rate (CAGR) of the Integrated Base Station?
The projected CAGR is approximately 5.7%.
2. Which companies are prominent players in the Integrated Base Station?
Key companies in the market include Comba Telecom, Vicinity TecVicinity Technologies, NEC, Inspur Group, Hytera, Sunwave, SageRAN Technology, Signalwing Corporation, Baicells, Beijing Changkun.
3. What are the main segments of the Integrated Base Station?
The market segments include Application, Type.
4. Can you provide details about the market size?
The market size is estimated to be USD 199 million as of 2022.
5. What are some drivers contributing to market growth?
N/A
6. What are the notable trends driving market growth?
N/A
7. Are there any restraints impacting market growth?
N/A
8. Can you provide examples of recent developments in the market?
N/A
9. What pricing options are available for accessing the report?
Pricing options include single-user, multi-user, and enterprise licenses priced at USD 3950.00, USD 5925.00, and USD 7900.00 respectively.
10. Is the market size provided in terms of value or volume?
The market size is provided in terms of value, measured in million and volume, measured in K.
11. Are there any specific market keywords associated with the report?
Yes, the market keyword associated with the report is "Integrated Base Station," which aids in identifying and referencing the specific market segment covered.
12. How do I determine which pricing option suits my needs best?
The pricing options vary based on user requirements and access needs. Individual users may opt for single-user licenses, while businesses requiring broader access may choose multi-user or enterprise licenses for cost-effective access to the report.
13. Are there any additional resources or data provided in the Integrated Base Station report?
While the report offers comprehensive insights, it's advisable to review the specific contents or supplementary materials provided to ascertain if additional resources or data are available.
14. How can I stay updated on further developments or reports in the Integrated Base Station?
To stay informed about further developments, trends, and reports in the Integrated Base Station, consider subscribing to industry newsletters, following relevant companies and organizations, or regularly checking reputable industry news sources and publications.
Methodology
Step 1 - Identification of Relevant Samples Size from Population Database


Step 2 - Approaches for Defining Global Market Size (Value, Volume* & Price*)

Note*: In applicable scenarios
Step 3 - Data Sources
Primary Research
- Web Analytics
- Survey Reports
- Research Institute
- Latest Research Reports
- Opinion Leaders
Secondary Research
- Annual Reports
- White Paper
- Latest Press Release
- Industry Association
- Paid Database
- Investor Presentations

Step 4 - Data Triangulation
Involves using different sources of information in order to increase the validity of a study
These sources are likely to be stakeholders in a program - participants, other researchers, program staff, other community members, and so on.
Then we put all data in single framework & apply various statistical tools to find out the dynamic on the market.
During the analysis stage, feedback from the stakeholder groups would be compared to determine areas of agreement as well as areas of divergence