

Key Insights
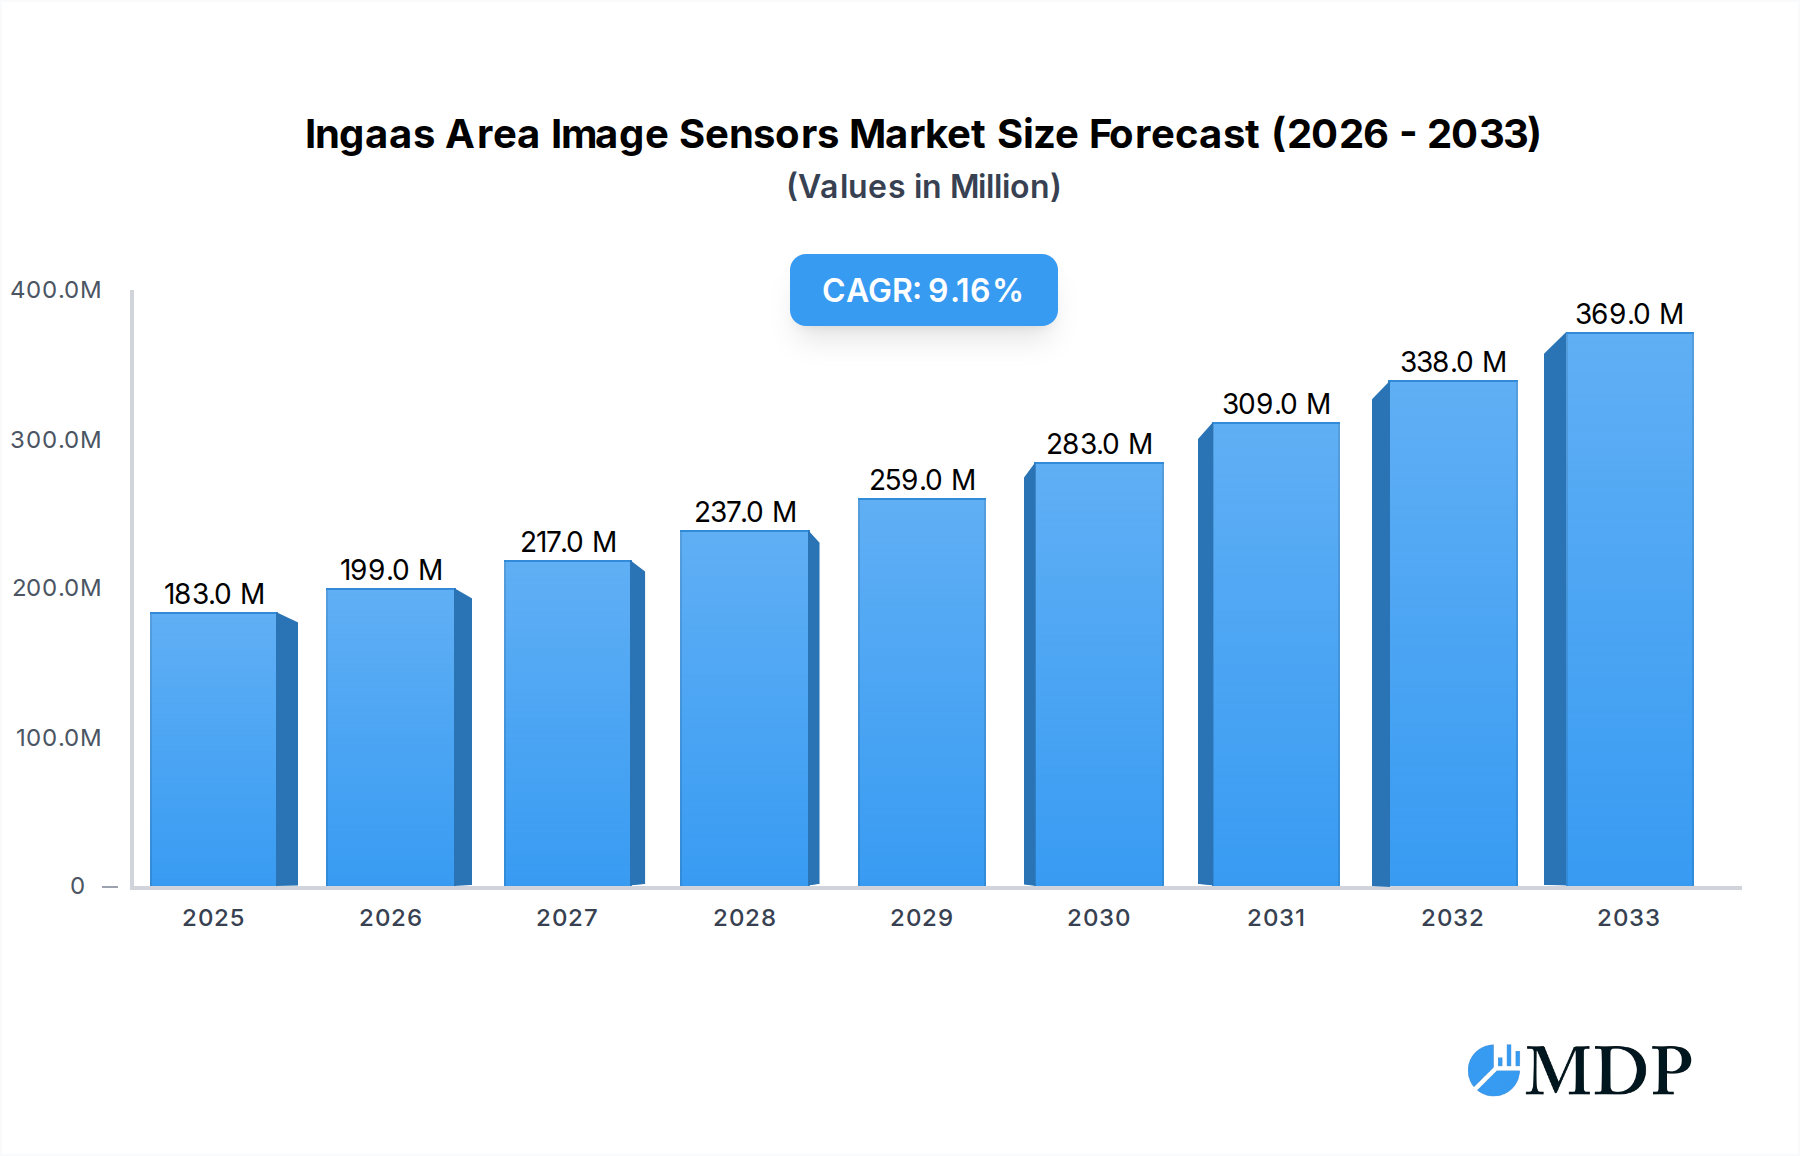
The InGaAs Area Image Sensor market is experiencing robust growth, projected to reach a substantial $183 million by 2025, with an impressive Compound Annual Growth Rate (CAGR) of 8.8% during the forecast period of 2025-2033. This significant expansion is driven by the increasing demand for advanced imaging solutions across various critical sectors. The military and surveillance applications are primary growth engines, leveraging InGaAs sensors for their superior performance in low-light conditions, harsh weather, and for detecting heat signatures. Industrial applications are also on the rise, with InGaAs sensors finding utility in automated inspection, quality control, and process monitoring due to their ability to see through haze, smoke, and fog. Emerging applications in areas like environmental monitoring and scientific research are further contributing to market momentum.

Ingaas Area Image Sensors Market Size (In Million)
The market's trajectory is further supported by technological advancements in sensor resolution and sensitivity, with key players like Hamamatsu, SCD, and Lynred continuously innovating. Resolutions such as 640x512 and 1280x1026 are becoming increasingly standard, catering to higher definition imaging needs. While the market shows strong growth, certain factors could influence its pace. Restraints might include the high cost of some advanced InGaAs sensor technologies and the complexity of integration into existing systems. However, the clear advantages offered by InGaAs technology in specific niches, especially where conventional sensors fall short, ensure continued demand and investment. Asia Pacific, particularly China, is emerging as a significant market, driven by both domestic demand and manufacturing capabilities, alongside established markets in North America and Europe.
Ingaas Area Image Sensors Company Market Share
InGaAs Area Image Sensors: Market Dynamics, Trends, and Strategic Outlook 2019-2033
This comprehensive report provides an in-depth analysis of the InGaAs (Indium Gallium Arsenide) area image sensor market, a critical technology powering advanced imaging applications across diverse sectors. Covering the historical period from 2019 to 2024, the base and estimated year of 2025, and a robust forecast period extending to 2033, this report offers actionable insights for stakeholders seeking to capitalize on this rapidly evolving industry. We delve into market concentration, innovation drivers, regulatory landscapes, end-user adoption, and strategic moves, while meticulously examining key industry trends, leading markets, product developments, growth drivers, challenges, and emerging opportunities. With an estimated market size of over $1,000 million by 2025, projected to reach over $2,500 million by 2033, driven by a Compound Annual Growth Rate (CAGR) of approximately 12%, this report is an indispensable resource.
InGaAs Area Image Sensors Market Dynamics & Concentration
The InGaAs area image sensor market exhibits moderate concentration, with a significant market share held by a few key players, including Hamamatsu and Lynred, each commanding an estimated 20% and 15% market share respectively in 2025. However, the landscape is dynamic, with emerging players like Jiwu Optoelectronic and GHOPTO demonstrating impressive growth and aiming to capture substantial market share in the coming years. Innovation remains the primary driver, fueled by advancements in material science and fabrication techniques, leading to improved resolution and sensitivity. Regulatory frameworks, particularly in defense and security, play a crucial role, often dictating product specifications and market access. Product substitutes, such as microbolometers, present a competitive threat, but InGaAs sensors maintain their dominance in applications requiring high spectral sensitivity and fast response times. End-user trends indicate a growing demand for miniaturized, power-efficient sensors with enhanced performance. Mergers and Acquisitions (M&A) activities, though not pervasive, have occurred, with a few strategic integrations aimed at bolstering technological capabilities and market reach. The estimated count of significant M&A deals within the historical period stands at approximately 5.
InGaAs Area Image Sensors Industry Trends & Analysis
The InGaAs area image sensor industry is experiencing robust growth, propelled by escalating demand for advanced imaging solutions in critical sectors. Market penetration is rapidly increasing, driven by the indispensable role these sensors play in applications where visible light imaging is insufficient. Growth drivers are multifaceted, encompassing the relentless pursuit of enhanced object detection, identification, and measurement capabilities, especially in low-light or obscured conditions. Technological disruptions are a constant, with continuous improvements in pixel size reduction, quantum efficiency, and noise reduction leading to higher resolution and better signal-to-noise ratios. The market penetration for high-resolution variants like 640x512 and 1280x1026 sensors is significantly increasing. Consumer preferences, while indirectly influencing the industrial and surveillance segments, lean towards more compact, energy-efficient, and cost-effective solutions. Competitive dynamics are characterized by intense R&D efforts, strategic partnerships, and a focus on differentiating through specialized features. The projected CAGR of 12% underscores the significant expansion of this market, with the overall market size projected to exceed $2,500 million by 2033. The integration of AI and machine learning capabilities with InGaAs sensor data is further amplifying their utility and driving adoption.
Leading Markets & Segments in InGaAs Area Image Sensors
The Military segment stands as the dominant market for InGaAs area image sensors, projected to account for over 35% of the global market revenue by 2025. This dominance is attributed to critical applications such as target acquisition, surveillance, and reconnaissance, where the unique spectral capabilities of InGaAs are indispensable for detecting camouflaged targets and operating in challenging atmospheric conditions. Within the Military segment, countries with significant defense spending and advanced technological infrastructures, such as the United States and China, represent the leading markets, with their combined share estimated to be over 40% of the military InGaAs sensor market.
Key drivers for this dominance include:
- Stringent Security Demands: The need for superior battlefield awareness and threat detection fuels the adoption of high-performance imaging systems.
- Technological Advancements in Warfare: The integration of smart weaponry and autonomous systems necessitates advanced sensing capabilities.
- Government Procurement Policies: Significant defense budgets and procurement programs directly support the market.
In terms of sensor types, the 640x512 resolution segment is currently the most prevalent within the Military application, offering a balance of detail and processing efficiency. However, the 1280x1026 resolution segment is experiencing rapid growth, driven by the demand for higher fidelity imaging in advanced systems.
The Surveillance segment is another significant growth area, driven by the increasing need for public safety and border security solutions. Emerging economies are also contributing to market expansion due to rising investments in smart city initiatives and intelligent transportation systems.
InGaAs Area Image Sensors Product Developments
Product development in InGaAs area image sensors is primarily focused on enhancing resolution, sensitivity, and spectral range while reducing pixel size and power consumption. Innovations are leading to the creation of smaller, lighter, and more integrated sensor modules suitable for a wider array of platforms, from drones to handheld devices. Key advancements include improved quantum efficiency across broader near-infrared (NIR) bands and enhanced performance in challenging environmental conditions, such as smoke, fog, and darkness. These developments are crucial for maintaining a competitive advantage, particularly in the burgeoning industrial automation and advanced security markets. The strategic integration of these sensors with AI algorithms is also a significant trend, enabling real-time analysis and decision-making.
Key Drivers of InGaAs Area Image Sensors Growth
The InGaAs area image sensor market is propelled by several key drivers. Technologically, the increasing demand for advanced night vision, thermal imaging, and spectral analysis capabilities in military, security, and industrial applications is paramount. Economic factors such as rising defense budgets globally and significant investments in smart infrastructure and automation are directly contributing to market expansion. Furthermore, regulatory mandates in specific sectors, particularly those related to safety and security, are enforcing the adoption of high-performance imaging solutions. The ongoing miniaturization and cost reduction of these sensors are also making them accessible for a broader range of applications, further fueling growth.
Challenges in the InGaAs Area Image Sensors Market
Despite its robust growth, the InGaAs area image sensor market faces several challenges. High manufacturing costs associated with specialized materials and fabrication processes remain a significant barrier, limiting adoption in some cost-sensitive applications. Stringent export controls and geopolitical factors can also impact global supply chains and market access for certain technologies and regions. The availability of alternative sensing technologies, such as advanced CMOS sensors with extended spectral sensitivity, presents a competitive pressure. Furthermore, ensuring consistent quality and performance across diverse operating environments requires rigorous testing and validation, adding to development timelines and costs.
Emerging Opportunities in InGaAs Area Image Sensors
Emerging opportunities in the InGaAs area image sensor market are vast and exciting. The burgeoning fields of autonomous driving and advanced driver-assistance systems (ADAS) present a significant untapped market, where InGaAs sensors can enable robust perception in adverse weather and lighting conditions. The expansion of smart agriculture, with its need for precise crop monitoring and disease detection, also offers substantial growth potential. Furthermore, the integration of InGaAs sensors with hyperspectral imaging capabilities opens doors for new applications in medical diagnostics, food quality inspection, and environmental monitoring. Strategic partnerships between sensor manufacturers and system integrators are crucial for unlocking these opportunities and driving innovation.
Leading Players in the InGaAs Area Image Sensors Sector
- Hamamatsu
- SCD
- Lynred
- I3system
- CETC (NO.44 Institute)
- NORINCO GROUP (Kunming Institute of Physics)
- Jiwu Optoelectronic
- Sony
- GHOPTO
- ZKDX
- XenICs
- Xi'an Leading Optoelectronic Technology
Key Milestones in InGaAs Area Image Sensors Industry
- 2019: Introduction of new InGaAs sensor architectures with improved low-light performance by Hamamatsu.
- 2020: Lynred announces advancements in uncooled infrared detector technology, impacting the InGaAs space.
- 2021: I3system showcases high-resolution InGaAs array sensors for industrial inspection applications.
- 2021: Jiwu Optoelectronic launches a new generation of cost-effective InGaAs sensors, expanding market accessibility.
- 2022: Sony announces R&D efforts in advanced InGaAs sensor technology for automotive applications.
- 2023: GHOPTO introduces novel InGaAs sensor designs for enhanced spectral sensitivity in security applications.
- 2024: CETC (NO.44 Institute) demonstrates breakthroughs in InGaAs focal plane arrays for defense systems.
Strategic Outlook for InGaAs Area Image Sensors Market
The strategic outlook for the InGaAs area image sensor market is highly positive, characterized by sustained growth and technological innovation. The increasing demand from defense, security, and industrial automation sectors will continue to be the primary growth accelerators. Future market potential lies in the successful penetration of emerging applications like autonomous systems and advanced medical imaging. Strategic opportunities will arise from continued investment in R&D to develop higher resolution, more power-efficient, and cost-effective sensors, alongside forging strong collaborations with end-users to tailor solutions for specific needs. The ability of market players to navigate evolving regulatory landscapes and capitalize on technological advancements will be critical for long-term success.
Ingaas Area Image Sensors Segmentation
-
1. Application
- 1.1. Military
- 1.2. Surveillance
- 1.3. Induatrial
- 1.4. Others
-
2. Type
- 2.1. 320×256
- 2.2. 640×512
- 2.3. 1280×1026
- 2.4. Others
Ingaas Area Image Sensors Segmentation By Geography
-
1. North America
- 1.1. United States
- 1.2. Canada
- 1.3. Mexico
-
2. South America
- 2.1. Brazil
- 2.2. Argentina
- 2.3. Rest of South America
-
3. Europe
- 3.1. United Kingdom
- 3.2. Germany
- 3.3. France
- 3.4. Italy
- 3.5. Spain
- 3.6. Russia
- 3.7. Benelux
- 3.8. Nordics
- 3.9. Rest of Europe
-
4. Middle East & Africa
- 4.1. Turkey
- 4.2. Israel
- 4.3. GCC
- 4.4. North Africa
- 4.5. South Africa
- 4.6. Rest of Middle East & Africa
-
5. Asia Pacific
- 5.1. China
- 5.2. India
- 5.3. Japan
- 5.4. South Korea
- 5.5. ASEAN
- 5.6. Oceania
- 5.7. Rest of Asia Pacific
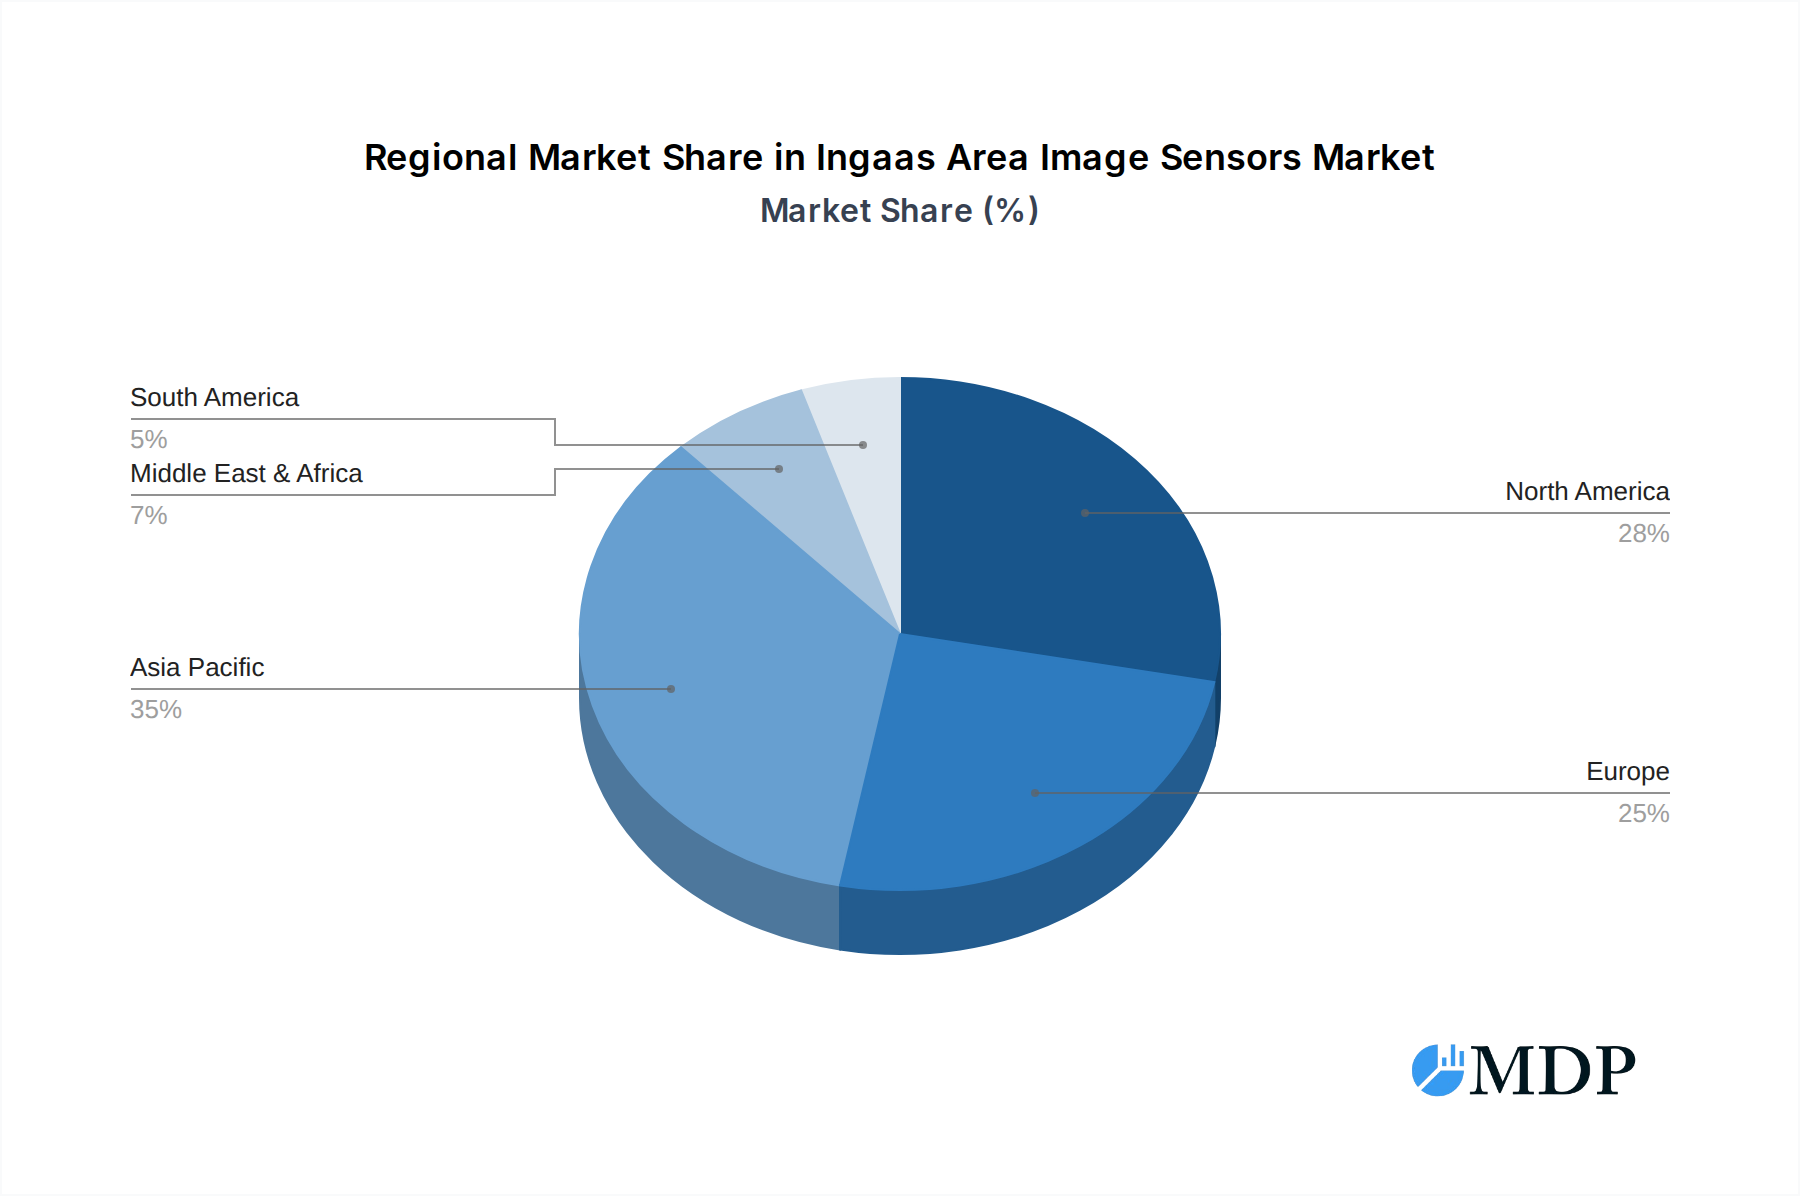
Ingaas Area Image Sensors Regional Market Share
Geographic Coverage of Ingaas Area Image Sensors
Ingaas Area Image Sensors REPORT HIGHLIGHTS
| Aspects | Details |
|---|---|
| Study Period | 2020-2034 |
| Base Year | 2025 |
| Estimated Year | 2026 |
| Forecast Period | 2026-2034 |
| Historical Period | 2020-2025 |
| Growth Rate | CAGR of 8.8% from 2020-2034 |
| Segmentation |
|
Table of Contents
- 1. Introduction
- 1.1. Research Scope
- 1.2. Market Segmentation
- 1.3. Research Methodology
- 1.4. Definitions and Assumptions
- 2. Executive Summary
- 2.1. Introduction
- 3. Market Dynamics
- 3.1. Introduction
- 3.2. Market Drivers
- 3.3. Market Restrains
- 3.4. Market Trends
- 4. Market Factor Analysis
- 4.1. Porters Five Forces
- 4.2. Supply/Value Chain
- 4.3. PESTEL analysis
- 4.4. Market Entropy
- 4.5. Patent/Trademark Analysis
- 5. Global Ingaas Area Image Sensors Analysis, Insights and Forecast, 2020-2032
- 5.1. Market Analysis, Insights and Forecast - by Application
- 5.1.1. Military
- 5.1.2. Surveillance
- 5.1.3. Induatrial
- 5.1.4. Others
- 5.2. Market Analysis, Insights and Forecast - by Type
- 5.2.1. 320×256
- 5.2.2. 640×512
- 5.2.3. 1280×1026
- 5.2.4. Others
- 5.3. Market Analysis, Insights and Forecast - by Region
- 5.3.1. North America
- 5.3.2. South America
- 5.3.3. Europe
- 5.3.4. Middle East & Africa
- 5.3.5. Asia Pacific
- 5.1. Market Analysis, Insights and Forecast - by Application
- 6. North America Ingaas Area Image Sensors Analysis, Insights and Forecast, 2020-2032
- 6.1. Market Analysis, Insights and Forecast - by Application
- 6.1.1. Military
- 6.1.2. Surveillance
- 6.1.3. Induatrial
- 6.1.4. Others
- 6.2. Market Analysis, Insights and Forecast - by Type
- 6.2.1. 320×256
- 6.2.2. 640×512
- 6.2.3. 1280×1026
- 6.2.4. Others
- 6.1. Market Analysis, Insights and Forecast - by Application
- 7. South America Ingaas Area Image Sensors Analysis, Insights and Forecast, 2020-2032
- 7.1. Market Analysis, Insights and Forecast - by Application
- 7.1.1. Military
- 7.1.2. Surveillance
- 7.1.3. Induatrial
- 7.1.4. Others
- 7.2. Market Analysis, Insights and Forecast - by Type
- 7.2.1. 320×256
- 7.2.2. 640×512
- 7.2.3. 1280×1026
- 7.2.4. Others
- 7.1. Market Analysis, Insights and Forecast - by Application
- 8. Europe Ingaas Area Image Sensors Analysis, Insights and Forecast, 2020-2032
- 8.1. Market Analysis, Insights and Forecast - by Application
- 8.1.1. Military
- 8.1.2. Surveillance
- 8.1.3. Induatrial
- 8.1.4. Others
- 8.2. Market Analysis, Insights and Forecast - by Type
- 8.2.1. 320×256
- 8.2.2. 640×512
- 8.2.3. 1280×1026
- 8.2.4. Others
- 8.1. Market Analysis, Insights and Forecast - by Application
- 9. Middle East & Africa Ingaas Area Image Sensors Analysis, Insights and Forecast, 2020-2032
- 9.1. Market Analysis, Insights and Forecast - by Application
- 9.1.1. Military
- 9.1.2. Surveillance
- 9.1.3. Induatrial
- 9.1.4. Others
- 9.2. Market Analysis, Insights and Forecast - by Type
- 9.2.1. 320×256
- 9.2.2. 640×512
- 9.2.3. 1280×1026
- 9.2.4. Others
- 9.1. Market Analysis, Insights and Forecast - by Application
- 10. Asia Pacific Ingaas Area Image Sensors Analysis, Insights and Forecast, 2020-2032
- 10.1. Market Analysis, Insights and Forecast - by Application
- 10.1.1. Military
- 10.1.2. Surveillance
- 10.1.3. Induatrial
- 10.1.4. Others
- 10.2. Market Analysis, Insights and Forecast - by Type
- 10.2.1. 320×256
- 10.2.2. 640×512
- 10.2.3. 1280×1026
- 10.2.4. Others
- 10.1. Market Analysis, Insights and Forecast - by Application
- 11. Competitive Analysis
- 11.1. Global Market Share Analysis 2025
- 11.2. Company Profiles
- 11.2.1 Hamamatsu
- 11.2.1.1. Overview
- 11.2.1.2. Products
- 11.2.1.3. SWOT Analysis
- 11.2.1.4. Recent Developments
- 11.2.1.5. Financials (Based on Availability)
- 11.2.2 SCD
- 11.2.2.1. Overview
- 11.2.2.2. Products
- 11.2.2.3. SWOT Analysis
- 11.2.2.4. Recent Developments
- 11.2.2.5. Financials (Based on Availability)
- 11.2.3 Lynred
- 11.2.3.1. Overview
- 11.2.3.2. Products
- 11.2.3.3. SWOT Analysis
- 11.2.3.4. Recent Developments
- 11.2.3.5. Financials (Based on Availability)
- 11.2.4 I3system
- 11.2.4.1. Overview
- 11.2.4.2. Products
- 11.2.4.3. SWOT Analysis
- 11.2.4.4. Recent Developments
- 11.2.4.5. Financials (Based on Availability)
- 11.2.5 CETC (NO.44 Institute)
- 11.2.5.1. Overview
- 11.2.5.2. Products
- 11.2.5.3. SWOT Analysis
- 11.2.5.4. Recent Developments
- 11.2.5.5. Financials (Based on Availability)
- 11.2.6 NORINCO GROUP (Kunming Institute of Physics)
- 11.2.6.1. Overview
- 11.2.6.2. Products
- 11.2.6.3. SWOT Analysis
- 11.2.6.4. Recent Developments
- 11.2.6.5. Financials (Based on Availability)
- 11.2.7 Jiwu Optoelectronic
- 11.2.7.1. Overview
- 11.2.7.2. Products
- 11.2.7.3. SWOT Analysis
- 11.2.7.4. Recent Developments
- 11.2.7.5. Financials (Based on Availability)
- 11.2.8 Sony
- 11.2.8.1. Overview
- 11.2.8.2. Products
- 11.2.8.3. SWOT Analysis
- 11.2.8.4. Recent Developments
- 11.2.8.5. Financials (Based on Availability)
- 11.2.9 GHOPTO
- 11.2.9.1. Overview
- 11.2.9.2. Products
- 11.2.9.3. SWOT Analysis
- 11.2.9.4. Recent Developments
- 11.2.9.5. Financials (Based on Availability)
- 11.2.10 ZKDX
- 11.2.10.1. Overview
- 11.2.10.2. Products
- 11.2.10.3. SWOT Analysis
- 11.2.10.4. Recent Developments
- 11.2.10.5. Financials (Based on Availability)
- 11.2.11 XenICs
- 11.2.11.1. Overview
- 11.2.11.2. Products
- 11.2.11.3. SWOT Analysis
- 11.2.11.4. Recent Developments
- 11.2.11.5. Financials (Based on Availability)
- 11.2.12 Xi'an Leading Optoelectronic Technology
- 11.2.12.1. Overview
- 11.2.12.2. Products
- 11.2.12.3. SWOT Analysis
- 11.2.12.4. Recent Developments
- 11.2.12.5. Financials (Based on Availability)
- 11.2.1 Hamamatsu
List of Figures
- Figure 1: Global Ingaas Area Image Sensors Revenue Breakdown (million, %) by Region 2025 & 2033
- Figure 2: Global Ingaas Area Image Sensors Volume Breakdown (K, %) by Region 2025 & 2033
- Figure 3: North America Ingaas Area Image Sensors Revenue (million), by Application 2025 & 2033
- Figure 4: North America Ingaas Area Image Sensors Volume (K), by Application 2025 & 2033
- Figure 5: North America Ingaas Area Image Sensors Revenue Share (%), by Application 2025 & 2033
- Figure 6: North America Ingaas Area Image Sensors Volume Share (%), by Application 2025 & 2033
- Figure 7: North America Ingaas Area Image Sensors Revenue (million), by Type 2025 & 2033
- Figure 8: North America Ingaas Area Image Sensors Volume (K), by Type 2025 & 2033
- Figure 9: North America Ingaas Area Image Sensors Revenue Share (%), by Type 2025 & 2033
- Figure 10: North America Ingaas Area Image Sensors Volume Share (%), by Type 2025 & 2033
- Figure 11: North America Ingaas Area Image Sensors Revenue (million), by Country 2025 & 2033
- Figure 12: North America Ingaas Area Image Sensors Volume (K), by Country 2025 & 2033
- Figure 13: North America Ingaas Area Image Sensors Revenue Share (%), by Country 2025 & 2033
- Figure 14: North America Ingaas Area Image Sensors Volume Share (%), by Country 2025 & 2033
- Figure 15: South America Ingaas Area Image Sensors Revenue (million), by Application 2025 & 2033
- Figure 16: South America Ingaas Area Image Sensors Volume (K), by Application 2025 & 2033
- Figure 17: South America Ingaas Area Image Sensors Revenue Share (%), by Application 2025 & 2033
- Figure 18: South America Ingaas Area Image Sensors Volume Share (%), by Application 2025 & 2033
- Figure 19: South America Ingaas Area Image Sensors Revenue (million), by Type 2025 & 2033
- Figure 20: South America Ingaas Area Image Sensors Volume (K), by Type 2025 & 2033
- Figure 21: South America Ingaas Area Image Sensors Revenue Share (%), by Type 2025 & 2033
- Figure 22: South America Ingaas Area Image Sensors Volume Share (%), by Type 2025 & 2033
- Figure 23: South America Ingaas Area Image Sensors Revenue (million), by Country 2025 & 2033
- Figure 24: South America Ingaas Area Image Sensors Volume (K), by Country 2025 & 2033
- Figure 25: South America Ingaas Area Image Sensors Revenue Share (%), by Country 2025 & 2033
- Figure 26: South America Ingaas Area Image Sensors Volume Share (%), by Country 2025 & 2033
- Figure 27: Europe Ingaas Area Image Sensors Revenue (million), by Application 2025 & 2033
- Figure 28: Europe Ingaas Area Image Sensors Volume (K), by Application 2025 & 2033
- Figure 29: Europe Ingaas Area Image Sensors Revenue Share (%), by Application 2025 & 2033
- Figure 30: Europe Ingaas Area Image Sensors Volume Share (%), by Application 2025 & 2033
- Figure 31: Europe Ingaas Area Image Sensors Revenue (million), by Type 2025 & 2033
- Figure 32: Europe Ingaas Area Image Sensors Volume (K), by Type 2025 & 2033
- Figure 33: Europe Ingaas Area Image Sensors Revenue Share (%), by Type 2025 & 2033
- Figure 34: Europe Ingaas Area Image Sensors Volume Share (%), by Type 2025 & 2033
- Figure 35: Europe Ingaas Area Image Sensors Revenue (million), by Country 2025 & 2033
- Figure 36: Europe Ingaas Area Image Sensors Volume (K), by Country 2025 & 2033
- Figure 37: Europe Ingaas Area Image Sensors Revenue Share (%), by Country 2025 & 2033
- Figure 38: Europe Ingaas Area Image Sensors Volume Share (%), by Country 2025 & 2033
- Figure 39: Middle East & Africa Ingaas Area Image Sensors Revenue (million), by Application 2025 & 2033
- Figure 40: Middle East & Africa Ingaas Area Image Sensors Volume (K), by Application 2025 & 2033
- Figure 41: Middle East & Africa Ingaas Area Image Sensors Revenue Share (%), by Application 2025 & 2033
- Figure 42: Middle East & Africa Ingaas Area Image Sensors Volume Share (%), by Application 2025 & 2033
- Figure 43: Middle East & Africa Ingaas Area Image Sensors Revenue (million), by Type 2025 & 2033
- Figure 44: Middle East & Africa Ingaas Area Image Sensors Volume (K), by Type 2025 & 2033
- Figure 45: Middle East & Africa Ingaas Area Image Sensors Revenue Share (%), by Type 2025 & 2033
- Figure 46: Middle East & Africa Ingaas Area Image Sensors Volume Share (%), by Type 2025 & 2033
- Figure 47: Middle East & Africa Ingaas Area Image Sensors Revenue (million), by Country 2025 & 2033
- Figure 48: Middle East & Africa Ingaas Area Image Sensors Volume (K), by Country 2025 & 2033
- Figure 49: Middle East & Africa Ingaas Area Image Sensors Revenue Share (%), by Country 2025 & 2033
- Figure 50: Middle East & Africa Ingaas Area Image Sensors Volume Share (%), by Country 2025 & 2033
- Figure 51: Asia Pacific Ingaas Area Image Sensors Revenue (million), by Application 2025 & 2033
- Figure 52: Asia Pacific Ingaas Area Image Sensors Volume (K), by Application 2025 & 2033
- Figure 53: Asia Pacific Ingaas Area Image Sensors Revenue Share (%), by Application 2025 & 2033
- Figure 54: Asia Pacific Ingaas Area Image Sensors Volume Share (%), by Application 2025 & 2033
- Figure 55: Asia Pacific Ingaas Area Image Sensors Revenue (million), by Type 2025 & 2033
- Figure 56: Asia Pacific Ingaas Area Image Sensors Volume (K), by Type 2025 & 2033
- Figure 57: Asia Pacific Ingaas Area Image Sensors Revenue Share (%), by Type 2025 & 2033
- Figure 58: Asia Pacific Ingaas Area Image Sensors Volume Share (%), by Type 2025 & 2033
- Figure 59: Asia Pacific Ingaas Area Image Sensors Revenue (million), by Country 2025 & 2033
- Figure 60: Asia Pacific Ingaas Area Image Sensors Volume (K), by Country 2025 & 2033
- Figure 61: Asia Pacific Ingaas Area Image Sensors Revenue Share (%), by Country 2025 & 2033
- Figure 62: Asia Pacific Ingaas Area Image Sensors Volume Share (%), by Country 2025 & 2033
List of Tables
- Table 1: Global Ingaas Area Image Sensors Revenue million Forecast, by Application 2020 & 2033
- Table 2: Global Ingaas Area Image Sensors Volume K Forecast, by Application 2020 & 2033
- Table 3: Global Ingaas Area Image Sensors Revenue million Forecast, by Type 2020 & 2033
- Table 4: Global Ingaas Area Image Sensors Volume K Forecast, by Type 2020 & 2033
- Table 5: Global Ingaas Area Image Sensors Revenue million Forecast, by Region 2020 & 2033
- Table 6: Global Ingaas Area Image Sensors Volume K Forecast, by Region 2020 & 2033
- Table 7: Global Ingaas Area Image Sensors Revenue million Forecast, by Application 2020 & 2033
- Table 8: Global Ingaas Area Image Sensors Volume K Forecast, by Application 2020 & 2033
- Table 9: Global Ingaas Area Image Sensors Revenue million Forecast, by Type 2020 & 2033
- Table 10: Global Ingaas Area Image Sensors Volume K Forecast, by Type 2020 & 2033
- Table 11: Global Ingaas Area Image Sensors Revenue million Forecast, by Country 2020 & 2033
- Table 12: Global Ingaas Area Image Sensors Volume K Forecast, by Country 2020 & 2033
- Table 13: United States Ingaas Area Image Sensors Revenue (million) Forecast, by Application 2020 & 2033
- Table 14: United States Ingaas Area Image Sensors Volume (K) Forecast, by Application 2020 & 2033
- Table 15: Canada Ingaas Area Image Sensors Revenue (million) Forecast, by Application 2020 & 2033
- Table 16: Canada Ingaas Area Image Sensors Volume (K) Forecast, by Application 2020 & 2033
- Table 17: Mexico Ingaas Area Image Sensors Revenue (million) Forecast, by Application 2020 & 2033
- Table 18: Mexico Ingaas Area Image Sensors Volume (K) Forecast, by Application 2020 & 2033
- Table 19: Global Ingaas Area Image Sensors Revenue million Forecast, by Application 2020 & 2033
- Table 20: Global Ingaas Area Image Sensors Volume K Forecast, by Application 2020 & 2033
- Table 21: Global Ingaas Area Image Sensors Revenue million Forecast, by Type 2020 & 2033
- Table 22: Global Ingaas Area Image Sensors Volume K Forecast, by Type 2020 & 2033
- Table 23: Global Ingaas Area Image Sensors Revenue million Forecast, by Country 2020 & 2033
- Table 24: Global Ingaas Area Image Sensors Volume K Forecast, by Country 2020 & 2033
- Table 25: Brazil Ingaas Area Image Sensors Revenue (million) Forecast, by Application 2020 & 2033
- Table 26: Brazil Ingaas Area Image Sensors Volume (K) Forecast, by Application 2020 & 2033
- Table 27: Argentina Ingaas Area Image Sensors Revenue (million) Forecast, by Application 2020 & 2033
- Table 28: Argentina Ingaas Area Image Sensors Volume (K) Forecast, by Application 2020 & 2033
- Table 29: Rest of South America Ingaas Area Image Sensors Revenue (million) Forecast, by Application 2020 & 2033
- Table 30: Rest of South America Ingaas Area Image Sensors Volume (K) Forecast, by Application 2020 & 2033
- Table 31: Global Ingaas Area Image Sensors Revenue million Forecast, by Application 2020 & 2033
- Table 32: Global Ingaas Area Image Sensors Volume K Forecast, by Application 2020 & 2033
- Table 33: Global Ingaas Area Image Sensors Revenue million Forecast, by Type 2020 & 2033
- Table 34: Global Ingaas Area Image Sensors Volume K Forecast, by Type 2020 & 2033
- Table 35: Global Ingaas Area Image Sensors Revenue million Forecast, by Country 2020 & 2033
- Table 36: Global Ingaas Area Image Sensors Volume K Forecast, by Country 2020 & 2033
- Table 37: United Kingdom Ingaas Area Image Sensors Revenue (million) Forecast, by Application 2020 & 2033
- Table 38: United Kingdom Ingaas Area Image Sensors Volume (K) Forecast, by Application 2020 & 2033
- Table 39: Germany Ingaas Area Image Sensors Revenue (million) Forecast, by Application 2020 & 2033
- Table 40: Germany Ingaas Area Image Sensors Volume (K) Forecast, by Application 2020 & 2033
- Table 41: France Ingaas Area Image Sensors Revenue (million) Forecast, by Application 2020 & 2033
- Table 42: France Ingaas Area Image Sensors Volume (K) Forecast, by Application 2020 & 2033
- Table 43: Italy Ingaas Area Image Sensors Revenue (million) Forecast, by Application 2020 & 2033
- Table 44: Italy Ingaas Area Image Sensors Volume (K) Forecast, by Application 2020 & 2033
- Table 45: Spain Ingaas Area Image Sensors Revenue (million) Forecast, by Application 2020 & 2033
- Table 46: Spain Ingaas Area Image Sensors Volume (K) Forecast, by Application 2020 & 2033
- Table 47: Russia Ingaas Area Image Sensors Revenue (million) Forecast, by Application 2020 & 2033
- Table 48: Russia Ingaas Area Image Sensors Volume (K) Forecast, by Application 2020 & 2033
- Table 49: Benelux Ingaas Area Image Sensors Revenue (million) Forecast, by Application 2020 & 2033
- Table 50: Benelux Ingaas Area Image Sensors Volume (K) Forecast, by Application 2020 & 2033
- Table 51: Nordics Ingaas Area Image Sensors Revenue (million) Forecast, by Application 2020 & 2033
- Table 52: Nordics Ingaas Area Image Sensors Volume (K) Forecast, by Application 2020 & 2033
- Table 53: Rest of Europe Ingaas Area Image Sensors Revenue (million) Forecast, by Application 2020 & 2033
- Table 54: Rest of Europe Ingaas Area Image Sensors Volume (K) Forecast, by Application 2020 & 2033
- Table 55: Global Ingaas Area Image Sensors Revenue million Forecast, by Application 2020 & 2033
- Table 56: Global Ingaas Area Image Sensors Volume K Forecast, by Application 2020 & 2033
- Table 57: Global Ingaas Area Image Sensors Revenue million Forecast, by Type 2020 & 2033
- Table 58: Global Ingaas Area Image Sensors Volume K Forecast, by Type 2020 & 2033
- Table 59: Global Ingaas Area Image Sensors Revenue million Forecast, by Country 2020 & 2033
- Table 60: Global Ingaas Area Image Sensors Volume K Forecast, by Country 2020 & 2033
- Table 61: Turkey Ingaas Area Image Sensors Revenue (million) Forecast, by Application 2020 & 2033
- Table 62: Turkey Ingaas Area Image Sensors Volume (K) Forecast, by Application 2020 & 2033
- Table 63: Israel Ingaas Area Image Sensors Revenue (million) Forecast, by Application 2020 & 2033
- Table 64: Israel Ingaas Area Image Sensors Volume (K) Forecast, by Application 2020 & 2033
- Table 65: GCC Ingaas Area Image Sensors Revenue (million) Forecast, by Application 2020 & 2033
- Table 66: GCC Ingaas Area Image Sensors Volume (K) Forecast, by Application 2020 & 2033
- Table 67: North Africa Ingaas Area Image Sensors Revenue (million) Forecast, by Application 2020 & 2033
- Table 68: North Africa Ingaas Area Image Sensors Volume (K) Forecast, by Application 2020 & 2033
- Table 69: South Africa Ingaas Area Image Sensors Revenue (million) Forecast, by Application 2020 & 2033
- Table 70: South Africa Ingaas Area Image Sensors Volume (K) Forecast, by Application 2020 & 2033
- Table 71: Rest of Middle East & Africa Ingaas Area Image Sensors Revenue (million) Forecast, by Application 2020 & 2033
- Table 72: Rest of Middle East & Africa Ingaas Area Image Sensors Volume (K) Forecast, by Application 2020 & 2033
- Table 73: Global Ingaas Area Image Sensors Revenue million Forecast, by Application 2020 & 2033
- Table 74: Global Ingaas Area Image Sensors Volume K Forecast, by Application 2020 & 2033
- Table 75: Global Ingaas Area Image Sensors Revenue million Forecast, by Type 2020 & 2033
- Table 76: Global Ingaas Area Image Sensors Volume K Forecast, by Type 2020 & 2033
- Table 77: Global Ingaas Area Image Sensors Revenue million Forecast, by Country 2020 & 2033
- Table 78: Global Ingaas Area Image Sensors Volume K Forecast, by Country 2020 & 2033
- Table 79: China Ingaas Area Image Sensors Revenue (million) Forecast, by Application 2020 & 2033
- Table 80: China Ingaas Area Image Sensors Volume (K) Forecast, by Application 2020 & 2033
- Table 81: India Ingaas Area Image Sensors Revenue (million) Forecast, by Application 2020 & 2033
- Table 82: India Ingaas Area Image Sensors Volume (K) Forecast, by Application 2020 & 2033
- Table 83: Japan Ingaas Area Image Sensors Revenue (million) Forecast, by Application 2020 & 2033
- Table 84: Japan Ingaas Area Image Sensors Volume (K) Forecast, by Application 2020 & 2033
- Table 85: South Korea Ingaas Area Image Sensors Revenue (million) Forecast, by Application 2020 & 2033
- Table 86: South Korea Ingaas Area Image Sensors Volume (K) Forecast, by Application 2020 & 2033
- Table 87: ASEAN Ingaas Area Image Sensors Revenue (million) Forecast, by Application 2020 & 2033
- Table 88: ASEAN Ingaas Area Image Sensors Volume (K) Forecast, by Application 2020 & 2033
- Table 89: Oceania Ingaas Area Image Sensors Revenue (million) Forecast, by Application 2020 & 2033
- Table 90: Oceania Ingaas Area Image Sensors Volume (K) Forecast, by Application 2020 & 2033
- Table 91: Rest of Asia Pacific Ingaas Area Image Sensors Revenue (million) Forecast, by Application 2020 & 2033
- Table 92: Rest of Asia Pacific Ingaas Area Image Sensors Volume (K) Forecast, by Application 2020 & 2033
Frequently Asked Questions
1. What is the projected Compound Annual Growth Rate (CAGR) of the Ingaas Area Image Sensors?
The projected CAGR is approximately 8.8%.
2. Which companies are prominent players in the Ingaas Area Image Sensors?
Key companies in the market include Hamamatsu, SCD, Lynred, I3system, CETC (NO.44 Institute), NORINCO GROUP (Kunming Institute of Physics), Jiwu Optoelectronic, Sony, GHOPTO, ZKDX, XenICs, Xi'an Leading Optoelectronic Technology.
3. What are the main segments of the Ingaas Area Image Sensors?
The market segments include Application, Type.
4. Can you provide details about the market size?
The market size is estimated to be USD 183 million as of 2022.
5. What are some drivers contributing to market growth?
N/A
6. What are the notable trends driving market growth?
N/A
7. Are there any restraints impacting market growth?
N/A
8. Can you provide examples of recent developments in the market?
N/A
9. What pricing options are available for accessing the report?
Pricing options include single-user, multi-user, and enterprise licenses priced at USD 3950.00, USD 5925.00, and USD 7900.00 respectively.
10. Is the market size provided in terms of value or volume?
The market size is provided in terms of value, measured in million and volume, measured in K.
11. Are there any specific market keywords associated with the report?
Yes, the market keyword associated with the report is "Ingaas Area Image Sensors," which aids in identifying and referencing the specific market segment covered.
12. How do I determine which pricing option suits my needs best?
The pricing options vary based on user requirements and access needs. Individual users may opt for single-user licenses, while businesses requiring broader access may choose multi-user or enterprise licenses for cost-effective access to the report.
13. Are there any additional resources or data provided in the Ingaas Area Image Sensors report?
While the report offers comprehensive insights, it's advisable to review the specific contents or supplementary materials provided to ascertain if additional resources or data are available.
14. How can I stay updated on further developments or reports in the Ingaas Area Image Sensors?
To stay informed about further developments, trends, and reports in the Ingaas Area Image Sensors, consider subscribing to industry newsletters, following relevant companies and organizations, or regularly checking reputable industry news sources and publications.
Methodology
Step 1 - Identification of Relevant Samples Size from Population Database


Step 2 - Approaches for Defining Global Market Size (Value, Volume* & Price*)

Note*: In applicable scenarios
Step 3 - Data Sources
Primary Research
- Web Analytics
- Survey Reports
- Research Institute
- Latest Research Reports
- Opinion Leaders
Secondary Research
- Annual Reports
- White Paper
- Latest Press Release
- Industry Association
- Paid Database
- Investor Presentations

Step 4 - Data Triangulation
Involves using different sources of information in order to increase the validity of a study
These sources are likely to be stakeholders in a program - participants, other researchers, program staff, other community members, and so on.
Then we put all data in single framework & apply various statistical tools to find out the dynamic on the market.
During the analysis stage, feedback from the stakeholder groups would be compared to determine areas of agreement as well as areas of divergence