

Key Insights
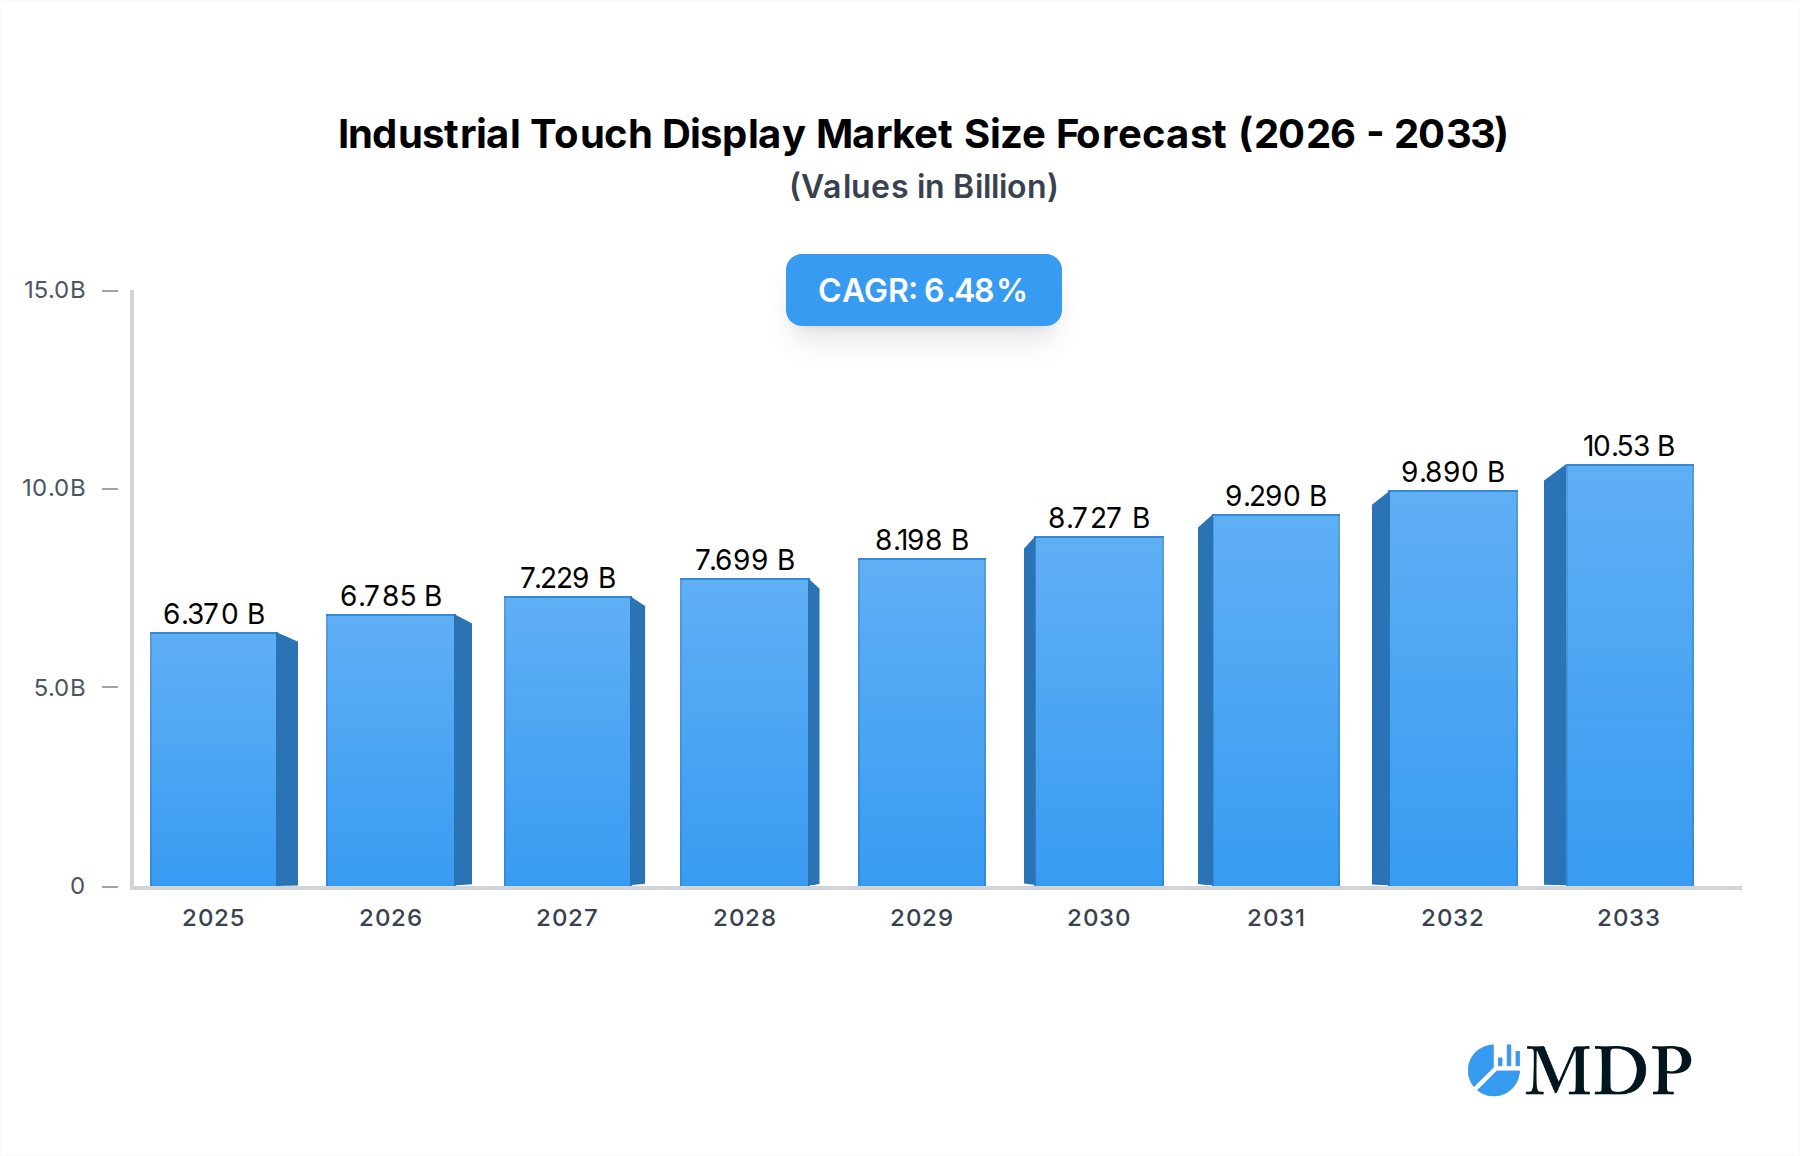
The Industrial Touch Display market is poised for significant expansion, projecting a market size of $6.37 billion in 2025, driven by the escalating demand for intuitive and efficient human-machine interfaces across various sectors. The market is expected to witness robust growth with a Compound Annual Growth Rate (CAGR) of 6.52% during the forecast period. This upward trajectory is primarily fueled by the increasing adoption of automation and smart manufacturing initiatives globally, particularly within the Medical, Education, and Finance industries. The need for enhanced operational efficiency, real-time data visualization, and seamless control systems in these demanding environments are key catalysts for the widespread deployment of industrial touch displays. Furthermore, advancements in touch technology, including improved durability, responsiveness, and integration capabilities with IoT devices, are contributing to market acceleration. The growing sophistication of smart city infrastructure, with its emphasis on integrated traffic management and public service interfaces, also presents a substantial growth avenue.

Industrial Touch Display Market Size (In Billion)
The market dynamics are further shaped by emerging trends such as the integration of advanced processing capabilities into touch displays, enabling edge computing functionalities for faster data analysis and decision-making. The increasing demand for ruggedized and environmentally resistant displays capable of withstanding harsh industrial conditions, including extreme temperatures, vibrations, and dust, is also a prominent trend. While opportunities abound, the market faces certain restraints, including the initial high cost of sophisticated industrial touch display systems and the ongoing need for skilled personnel to manage and maintain these advanced technologies. Despite these challenges, the ongoing digital transformation and the relentless pursuit of operational excellence across industries are expected to propel the Industrial Touch Display market to new heights, solidifying its importance in modern industrial ecosystems. The competitive landscape features prominent players like Advantech, ADLINK Technology, and Faytech AG, actively innovating to meet evolving market demands.
Industrial Touch Display Company Market Share
Industrial Touch Display Market Report: Comprehensive Analysis & Future Outlook (2019-2033)
This in-depth report provides a thorough analysis of the global Industrial Touch Display market, encompassing market dynamics, key trends, leading segments, product innovations, growth drivers, challenges, emerging opportunities, and strategic outlooks from 2019 to 2033. With a base year of 2025 and a forecast period extending to 2033, this study offers actionable insights for industry stakeholders, including manufacturers, suppliers, investors, and end-users across various applications like Medical, Educate, Finance, City Traffic, and Others. The report delves into different types of industrial touch displays, including Embedded, Wall-Mounted, Rack Mount, and Others, to provide a holistic market view.
Industrial Touch Display Market Dynamics & Concentration
The global Industrial Touch Display market exhibits a moderate level of concentration, with a few key players holding significant market share. The innovation landscape is characterized by continuous advancements in touch technologies (e.g., projected capacitive, resistive), display resolutions, ruggedization, and integration capabilities. Regulatory frameworks, particularly those pertaining to industrial automation, safety standards (e.g., IEC 61000), and environmental compliance, are shaping product development and market entry. Product substitutes, such as traditional button interfaces and non-touch displays, are gradually being displaced by the superior user experience and efficiency offered by industrial touch displays. End-user trends are heavily influenced by the increasing demand for automation, human-machine interface (HMI) improvements, and the adoption of Industry 4.0 principles across various sectors. Mergers and acquisitions (M&A) activities, with an estimated $2 billion in deal volume and approximately 10 major M&A transactions anticipated over the forecast period, are strategically consolidating the market and expanding company portfolios. The market share distribution reveals that key players collectively command an estimated 70% of the total market value, with the remaining 30% held by smaller, specialized vendors.
Industrial Touch Display Industry Trends & Analysis
The Industrial Touch Display industry is poised for substantial growth, driven by the relentless pursuit of operational efficiency, enhanced worker productivity, and sophisticated data visualization in industrial settings. The market is projected to expand at a Compound Annual Growth Rate (CAGR) of approximately 8.5% from 2025 to 2033, reaching an estimated market value of $25 billion by the end of the forecast period. Technological disruptions are at the forefront of this growth, with advancements in high-resolution displays, multi-touch capabilities, improved responsiveness, and enhanced durability against harsh environments (dust, water, extreme temperatures) becoming standard. The increasing adoption of IoT (Internet of Things) and AI (Artificial Intelligence) in industrial processes further fuels the demand for intuitive and robust touch interfaces that facilitate seamless data interaction and control. Consumer preferences, even in industrial contexts, are shifting towards user-friendly, intuitive interfaces that mimic those found in consumer electronics, demanding displays that are not only functional but also aesthetically pleasing and easy to operate. Competitive dynamics are intensifying, with companies focusing on product differentiation through specialized features, customized solutions, and competitive pricing strategies. Market penetration is projected to rise significantly, especially in emerging economies where industrial automation is rapidly gaining traction. The integration of advanced features such as glove-touch operation, stylus compatibility, and sunlight-readable displays are becoming crucial for market competitiveness.
Leading Markets & Segments in Industrial Touch Display
The Medical segment is emerging as a dominant force in the Industrial Touch Display market, driven by the critical need for sterile, easy-to-clean, and highly responsive interfaces in medical devices, diagnostic equipment, and patient monitoring systems. The application of industrial touch displays in the medical field is further bolstered by stringent regulatory requirements for accuracy, reliability, and patient safety. Economic policies supporting healthcare infrastructure development and technological advancements in medical imaging and robotics are significant drivers.
- Key Drivers for Medical Segment Dominance:
- Increasing demand for advanced medical equipment and devices.
- Growing adoption of touch interfaces for improved patient care and data management.
- Strict regulatory compliance favoring durable and reliable display solutions.
- Technological innovation in sterile and antimicrobial touch technologies.
The Educate segment is also witnessing robust growth, with industrial touch displays finding applications in interactive whiteboards, digital signage in educational institutions, and specialized training simulators. Government initiatives aimed at modernizing educational infrastructure and promoting digital learning environments are key contributors.
- Key Drivers for Educate Segment Growth:
- Digital transformation of educational institutions.
- Demand for interactive learning tools and smart classrooms.
- Government funding for educational technology.
The Embedded type of industrial touch display is leading the market due to its seamless integration into machinery, control panels, and complex industrial systems. This type offers greater design flexibility and a more compact footprint, making it ideal for space-constrained applications.
- Key Drivers for Embedded Type Dominance:
- Miniaturization of industrial equipment.
- Demand for integrated HMI solutions in automation.
- Cost-effectiveness and design flexibility.
Industrial Touch Display Product Developments
Recent product developments in the industrial touch display market are characterized by enhanced ruggedization, improved optical clarity, and advanced touch functionalities. Innovations include displays with higher brightness for sunlight readability, wider operating temperature ranges, and enhanced impact and vibration resistance. The integration of projected capacitive (PCAP) touch technology, offering multi-touch capabilities and superior responsiveness, is becoming a de facto standard. Companies are also focusing on developing displays with extended lifecycles and reduced power consumption, catering to sustainability initiatives and operational cost reduction. The competitive advantage lies in offering tailored solutions that meet specific industry needs, such as medical-grade certification or extreme environmental resistance.
Key Drivers of Industrial Touch Display Growth
The industrial touch display market's growth is propelled by several key drivers. Technologically, the increasing demand for automation and the integration of Industry 4.0 principles are paramount, necessitating intuitive human-machine interfaces. Economically, rising global manufacturing output and investments in smart factories are fueling adoption. Regulatory factors, such as mandates for improved safety and efficiency in industrial operations, also play a significant role. For instance, the push for Industry 4.0 adoption in manufacturing industries globally is a direct catalyst, driving the need for robust and interactive display solutions.
Challenges in the Industrial Touch Display Market
The industrial touch display market faces several challenges. Regulatory hurdles, particularly in highly specialized sectors like medical and aerospace, can slow down product approval and market entry. Supply chain issues, including the availability of critical components and potential geopolitical disruptions, can impact production volumes and lead times. Competitive pressures from numerous global and regional players are driving down prices, making it challenging for smaller manufacturers to maintain profitability. The cost of advanced technologies can also be a barrier for some smaller enterprises.
Emerging Opportunities in Industrial Touch Display
Emerging opportunities in the industrial touch display market are abundant. Technological breakthroughs in areas like flexible displays, transparent touchscreens, and augmented reality (AR) integration offer exciting new application possibilities. Strategic partnerships between display manufacturers and automation solution providers can create bundled offerings that cater to specific industrial needs. Market expansion into rapidly industrializing regions and niche sectors like renewable energy management systems presents significant growth potential. The increasing demand for IoT-enabled devices that require sophisticated and durable interfaces also presents a substantial opportunity.
Leading Players in the Industrial Touch Display Sector
- Faytech AG
- Hope Industrial Systems
- Advantech
- ADLINK Technology
- Fortec UK
- Ekaa Technology Co.,Ltd
- Keetouch GMBH
- Maple Systems
- New Vision Display
- Beetronics
- TouchWo
- TRU-Vu Monitors
- Touch International
- E3 Displays
- STX Technology - Australia
Key Milestones in Industrial Touch Display Industry
- 2019: Increased adoption of projected capacitive (PCAP) touch technology in ruggedized industrial displays.
- 2020: Emergence of demand for touch displays with enhanced antimicrobial properties in the healthcare sector.
- 2021: Significant investment in R&D for higher resolution and brighter industrial displays for outdoor applications.
- 2022: Growing integration of IoT capabilities and cloud connectivity into industrial touch display solutions.
- 2023: Focus on sustainable manufacturing and energy-efficient display technologies.
- 2024: Advancements in AI-powered touch interfaces for predictive maintenance and automated control systems.
Strategic Outlook for Industrial Touch Display Market
The strategic outlook for the Industrial Touch Display market is highly optimistic, driven by the continuous digital transformation across industries. Key growth accelerators include the expanding adoption of Industry 4.0, the proliferation of IoT devices, and the persistent demand for enhanced human-machine interaction in complex industrial environments. Companies that focus on innovation, product customization, and building strong distribution networks will be well-positioned to capitalize on future market potential. Strategic opportunities lie in developing solutions for emerging applications like smart cities, advanced robotics, and the Internet of Medical Things (IoMT).
Industrial Touch Display Segmentation
-
1. Application
- 1.1. Medical
- 1.2. Educate
- 1.3. Finance
- 1.4. City Traffic
- 1.5. Others
-
2. Types
- 2.1. Embedded
- 2.2. Wall-Mounted
- 2.3. Rack Mount
- 2.4. Others
Industrial Touch Display Segmentation By Geography
-
1. North America
- 1.1. United States
- 1.2. Canada
- 1.3. Mexico
-
2. South America
- 2.1. Brazil
- 2.2. Argentina
- 2.3. Rest of South America
-
3. Europe
- 3.1. United Kingdom
- 3.2. Germany
- 3.3. France
- 3.4. Italy
- 3.5. Spain
- 3.6. Russia
- 3.7. Benelux
- 3.8. Nordics
- 3.9. Rest of Europe
-
4. Middle East & Africa
- 4.1. Turkey
- 4.2. Israel
- 4.3. GCC
- 4.4. North Africa
- 4.5. South Africa
- 4.6. Rest of Middle East & Africa
-
5. Asia Pacific
- 5.1. China
- 5.2. India
- 5.3. Japan
- 5.4. South Korea
- 5.5. ASEAN
- 5.6. Oceania
- 5.7. Rest of Asia Pacific
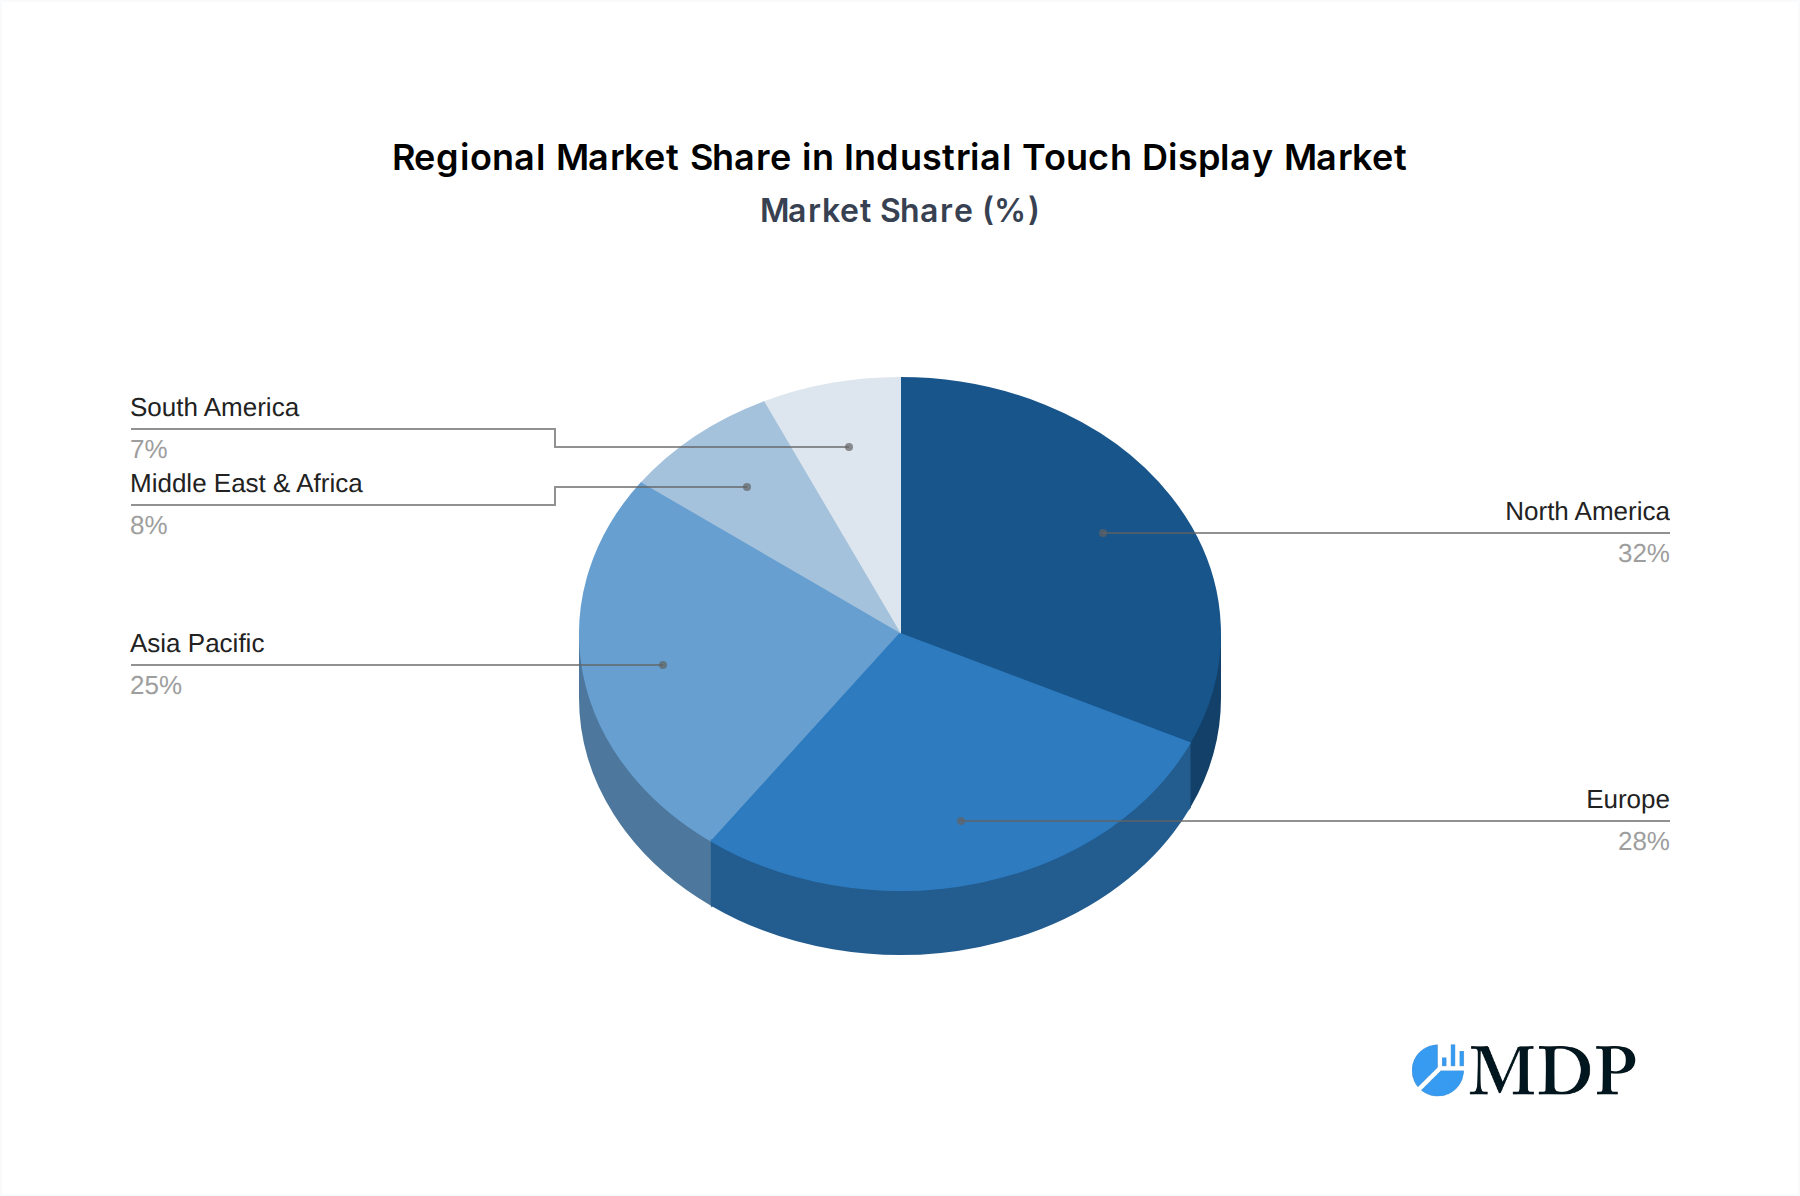
Industrial Touch Display Regional Market Share
Geographic Coverage of Industrial Touch Display
Industrial Touch Display REPORT HIGHLIGHTS
| Aspects | Details |
|---|---|
| Study Period | 2020-2034 |
| Base Year | 2025 |
| Estimated Year | 2026 |
| Forecast Period | 2026-2034 |
| Historical Period | 2020-2025 |
| Growth Rate | CAGR of 6.52% from 2020-2034 |
| Segmentation |
|
Table of Contents
- 1. Introduction
- 1.1. Research Scope
- 1.2. Market Segmentation
- 1.3. Research Methodology
- 1.4. Definitions and Assumptions
- 2. Executive Summary
- 2.1. Introduction
- 3. Market Dynamics
- 3.1. Introduction
- 3.2. Market Drivers
- 3.3. Market Restrains
- 3.4. Market Trends
- 4. Market Factor Analysis
- 4.1. Porters Five Forces
- 4.2. Supply/Value Chain
- 4.3. PESTEL analysis
- 4.4. Market Entropy
- 4.5. Patent/Trademark Analysis
- 5. Global Industrial Touch Display Analysis, Insights and Forecast, 2020-2032
- 5.1. Market Analysis, Insights and Forecast - by Application
- 5.1.1. Medical
- 5.1.2. Educate
- 5.1.3. Finance
- 5.1.4. City Traffic
- 5.1.5. Others
- 5.2. Market Analysis, Insights and Forecast - by Types
- 5.2.1. Embedded
- 5.2.2. Wall-Mounted
- 5.2.3. Rack Mount
- 5.2.4. Others
- 5.3. Market Analysis, Insights and Forecast - by Region
- 5.3.1. North America
- 5.3.2. South America
- 5.3.3. Europe
- 5.3.4. Middle East & Africa
- 5.3.5. Asia Pacific
- 5.1. Market Analysis, Insights and Forecast - by Application
- 6. North America Industrial Touch Display Analysis, Insights and Forecast, 2020-2032
- 6.1. Market Analysis, Insights and Forecast - by Application
- 6.1.1. Medical
- 6.1.2. Educate
- 6.1.3. Finance
- 6.1.4. City Traffic
- 6.1.5. Others
- 6.2. Market Analysis, Insights and Forecast - by Types
- 6.2.1. Embedded
- 6.2.2. Wall-Mounted
- 6.2.3. Rack Mount
- 6.2.4. Others
- 6.1. Market Analysis, Insights and Forecast - by Application
- 7. South America Industrial Touch Display Analysis, Insights and Forecast, 2020-2032
- 7.1. Market Analysis, Insights and Forecast - by Application
- 7.1.1. Medical
- 7.1.2. Educate
- 7.1.3. Finance
- 7.1.4. City Traffic
- 7.1.5. Others
- 7.2. Market Analysis, Insights and Forecast - by Types
- 7.2.1. Embedded
- 7.2.2. Wall-Mounted
- 7.2.3. Rack Mount
- 7.2.4. Others
- 7.1. Market Analysis, Insights and Forecast - by Application
- 8. Europe Industrial Touch Display Analysis, Insights and Forecast, 2020-2032
- 8.1. Market Analysis, Insights and Forecast - by Application
- 8.1.1. Medical
- 8.1.2. Educate
- 8.1.3. Finance
- 8.1.4. City Traffic
- 8.1.5. Others
- 8.2. Market Analysis, Insights and Forecast - by Types
- 8.2.1. Embedded
- 8.2.2. Wall-Mounted
- 8.2.3. Rack Mount
- 8.2.4. Others
- 8.1. Market Analysis, Insights and Forecast - by Application
- 9. Middle East & Africa Industrial Touch Display Analysis, Insights and Forecast, 2020-2032
- 9.1. Market Analysis, Insights and Forecast - by Application
- 9.1.1. Medical
- 9.1.2. Educate
- 9.1.3. Finance
- 9.1.4. City Traffic
- 9.1.5. Others
- 9.2. Market Analysis, Insights and Forecast - by Types
- 9.2.1. Embedded
- 9.2.2. Wall-Mounted
- 9.2.3. Rack Mount
- 9.2.4. Others
- 9.1. Market Analysis, Insights and Forecast - by Application
- 10. Asia Pacific Industrial Touch Display Analysis, Insights and Forecast, 2020-2032
- 10.1. Market Analysis, Insights and Forecast - by Application
- 10.1.1. Medical
- 10.1.2. Educate
- 10.1.3. Finance
- 10.1.4. City Traffic
- 10.1.5. Others
- 10.2. Market Analysis, Insights and Forecast - by Types
- 10.2.1. Embedded
- 10.2.2. Wall-Mounted
- 10.2.3. Rack Mount
- 10.2.4. Others
- 10.1. Market Analysis, Insights and Forecast - by Application
- 11. Competitive Analysis
- 11.1. Global Market Share Analysis 2025
- 11.2. Company Profiles
- 11.2.1 Faytech AG
- 11.2.1.1. Overview
- 11.2.1.2. Products
- 11.2.1.3. SWOT Analysis
- 11.2.1.4. Recent Developments
- 11.2.1.5. Financials (Based on Availability)
- 11.2.2 Hope Industrial Systems
- 11.2.2.1. Overview
- 11.2.2.2. Products
- 11.2.2.3. SWOT Analysis
- 11.2.2.4. Recent Developments
- 11.2.2.5. Financials (Based on Availability)
- 11.2.3 Advantech
- 11.2.3.1. Overview
- 11.2.3.2. Products
- 11.2.3.3. SWOT Analysis
- 11.2.3.4. Recent Developments
- 11.2.3.5. Financials (Based on Availability)
- 11.2.4 ADLINK Technology
- 11.2.4.1. Overview
- 11.2.4.2. Products
- 11.2.4.3. SWOT Analysis
- 11.2.4.4. Recent Developments
- 11.2.4.5. Financials (Based on Availability)
- 11.2.5 Fortec UK
- 11.2.5.1. Overview
- 11.2.5.2. Products
- 11.2.5.3. SWOT Analysis
- 11.2.5.4. Recent Developments
- 11.2.5.5. Financials (Based on Availability)
- 11.2.6 Ekaa Technology Co.
- 11.2.6.1. Overview
- 11.2.6.2. Products
- 11.2.6.3. SWOT Analysis
- 11.2.6.4. Recent Developments
- 11.2.6.5. Financials (Based on Availability)
- 11.2.7 Ltd
- 11.2.7.1. Overview
- 11.2.7.2. Products
- 11.2.7.3. SWOT Analysis
- 11.2.7.4. Recent Developments
- 11.2.7.5. Financials (Based on Availability)
- 11.2.8 Keetouch GMBH
- 11.2.8.1. Overview
- 11.2.8.2. Products
- 11.2.8.3. SWOT Analysis
- 11.2.8.4. Recent Developments
- 11.2.8.5. Financials (Based on Availability)
- 11.2.9 Maple Systems
- 11.2.9.1. Overview
- 11.2.9.2. Products
- 11.2.9.3. SWOT Analysis
- 11.2.9.4. Recent Developments
- 11.2.9.5. Financials (Based on Availability)
- 11.2.10 New Vision Display
- 11.2.10.1. Overview
- 11.2.10.2. Products
- 11.2.10.3. SWOT Analysis
- 11.2.10.4. Recent Developments
- 11.2.10.5. Financials (Based on Availability)
- 11.2.11 Beetronics
- 11.2.11.1. Overview
- 11.2.11.2. Products
- 11.2.11.3. SWOT Analysis
- 11.2.11.4. Recent Developments
- 11.2.11.5. Financials (Based on Availability)
- 11.2.12 TouchWo
- 11.2.12.1. Overview
- 11.2.12.2. Products
- 11.2.12.3. SWOT Analysis
- 11.2.12.4. Recent Developments
- 11.2.12.5. Financials (Based on Availability)
- 11.2.13 TRU-Vu Monitors
- 11.2.13.1. Overview
- 11.2.13.2. Products
- 11.2.13.3. SWOT Analysis
- 11.2.13.4. Recent Developments
- 11.2.13.5. Financials (Based on Availability)
- 11.2.14 Touch International
- 11.2.14.1. Overview
- 11.2.14.2. Products
- 11.2.14.3. SWOT Analysis
- 11.2.14.4. Recent Developments
- 11.2.14.5. Financials (Based on Availability)
- 11.2.15 E3 Displays
- 11.2.15.1. Overview
- 11.2.15.2. Products
- 11.2.15.3. SWOT Analysis
- 11.2.15.4. Recent Developments
- 11.2.15.5. Financials (Based on Availability)
- 11.2.16 STX Technology - Australia
- 11.2.16.1. Overview
- 11.2.16.2. Products
- 11.2.16.3. SWOT Analysis
- 11.2.16.4. Recent Developments
- 11.2.16.5. Financials (Based on Availability)
- 11.2.1 Faytech AG
List of Figures
- Figure 1: Global Industrial Touch Display Revenue Breakdown (billion, %) by Region 2025 & 2033
- Figure 2: North America Industrial Touch Display Revenue (billion), by Application 2025 & 2033
- Figure 3: North America Industrial Touch Display Revenue Share (%), by Application 2025 & 2033
- Figure 4: North America Industrial Touch Display Revenue (billion), by Types 2025 & 2033
- Figure 5: North America Industrial Touch Display Revenue Share (%), by Types 2025 & 2033
- Figure 6: North America Industrial Touch Display Revenue (billion), by Country 2025 & 2033
- Figure 7: North America Industrial Touch Display Revenue Share (%), by Country 2025 & 2033
- Figure 8: South America Industrial Touch Display Revenue (billion), by Application 2025 & 2033
- Figure 9: South America Industrial Touch Display Revenue Share (%), by Application 2025 & 2033
- Figure 10: South America Industrial Touch Display Revenue (billion), by Types 2025 & 2033
- Figure 11: South America Industrial Touch Display Revenue Share (%), by Types 2025 & 2033
- Figure 12: South America Industrial Touch Display Revenue (billion), by Country 2025 & 2033
- Figure 13: South America Industrial Touch Display Revenue Share (%), by Country 2025 & 2033
- Figure 14: Europe Industrial Touch Display Revenue (billion), by Application 2025 & 2033
- Figure 15: Europe Industrial Touch Display Revenue Share (%), by Application 2025 & 2033
- Figure 16: Europe Industrial Touch Display Revenue (billion), by Types 2025 & 2033
- Figure 17: Europe Industrial Touch Display Revenue Share (%), by Types 2025 & 2033
- Figure 18: Europe Industrial Touch Display Revenue (billion), by Country 2025 & 2033
- Figure 19: Europe Industrial Touch Display Revenue Share (%), by Country 2025 & 2033
- Figure 20: Middle East & Africa Industrial Touch Display Revenue (billion), by Application 2025 & 2033
- Figure 21: Middle East & Africa Industrial Touch Display Revenue Share (%), by Application 2025 & 2033
- Figure 22: Middle East & Africa Industrial Touch Display Revenue (billion), by Types 2025 & 2033
- Figure 23: Middle East & Africa Industrial Touch Display Revenue Share (%), by Types 2025 & 2033
- Figure 24: Middle East & Africa Industrial Touch Display Revenue (billion), by Country 2025 & 2033
- Figure 25: Middle East & Africa Industrial Touch Display Revenue Share (%), by Country 2025 & 2033
- Figure 26: Asia Pacific Industrial Touch Display Revenue (billion), by Application 2025 & 2033
- Figure 27: Asia Pacific Industrial Touch Display Revenue Share (%), by Application 2025 & 2033
- Figure 28: Asia Pacific Industrial Touch Display Revenue (billion), by Types 2025 & 2033
- Figure 29: Asia Pacific Industrial Touch Display Revenue Share (%), by Types 2025 & 2033
- Figure 30: Asia Pacific Industrial Touch Display Revenue (billion), by Country 2025 & 2033
- Figure 31: Asia Pacific Industrial Touch Display Revenue Share (%), by Country 2025 & 2033
List of Tables
- Table 1: Global Industrial Touch Display Revenue billion Forecast, by Application 2020 & 2033
- Table 2: Global Industrial Touch Display Revenue billion Forecast, by Types 2020 & 2033
- Table 3: Global Industrial Touch Display Revenue billion Forecast, by Region 2020 & 2033
- Table 4: Global Industrial Touch Display Revenue billion Forecast, by Application 2020 & 2033
- Table 5: Global Industrial Touch Display Revenue billion Forecast, by Types 2020 & 2033
- Table 6: Global Industrial Touch Display Revenue billion Forecast, by Country 2020 & 2033
- Table 7: United States Industrial Touch Display Revenue (billion) Forecast, by Application 2020 & 2033
- Table 8: Canada Industrial Touch Display Revenue (billion) Forecast, by Application 2020 & 2033
- Table 9: Mexico Industrial Touch Display Revenue (billion) Forecast, by Application 2020 & 2033
- Table 10: Global Industrial Touch Display Revenue billion Forecast, by Application 2020 & 2033
- Table 11: Global Industrial Touch Display Revenue billion Forecast, by Types 2020 & 2033
- Table 12: Global Industrial Touch Display Revenue billion Forecast, by Country 2020 & 2033
- Table 13: Brazil Industrial Touch Display Revenue (billion) Forecast, by Application 2020 & 2033
- Table 14: Argentina Industrial Touch Display Revenue (billion) Forecast, by Application 2020 & 2033
- Table 15: Rest of South America Industrial Touch Display Revenue (billion) Forecast, by Application 2020 & 2033
- Table 16: Global Industrial Touch Display Revenue billion Forecast, by Application 2020 & 2033
- Table 17: Global Industrial Touch Display Revenue billion Forecast, by Types 2020 & 2033
- Table 18: Global Industrial Touch Display Revenue billion Forecast, by Country 2020 & 2033
- Table 19: United Kingdom Industrial Touch Display Revenue (billion) Forecast, by Application 2020 & 2033
- Table 20: Germany Industrial Touch Display Revenue (billion) Forecast, by Application 2020 & 2033
- Table 21: France Industrial Touch Display Revenue (billion) Forecast, by Application 2020 & 2033
- Table 22: Italy Industrial Touch Display Revenue (billion) Forecast, by Application 2020 & 2033
- Table 23: Spain Industrial Touch Display Revenue (billion) Forecast, by Application 2020 & 2033
- Table 24: Russia Industrial Touch Display Revenue (billion) Forecast, by Application 2020 & 2033
- Table 25: Benelux Industrial Touch Display Revenue (billion) Forecast, by Application 2020 & 2033
- Table 26: Nordics Industrial Touch Display Revenue (billion) Forecast, by Application 2020 & 2033
- Table 27: Rest of Europe Industrial Touch Display Revenue (billion) Forecast, by Application 2020 & 2033
- Table 28: Global Industrial Touch Display Revenue billion Forecast, by Application 2020 & 2033
- Table 29: Global Industrial Touch Display Revenue billion Forecast, by Types 2020 & 2033
- Table 30: Global Industrial Touch Display Revenue billion Forecast, by Country 2020 & 2033
- Table 31: Turkey Industrial Touch Display Revenue (billion) Forecast, by Application 2020 & 2033
- Table 32: Israel Industrial Touch Display Revenue (billion) Forecast, by Application 2020 & 2033
- Table 33: GCC Industrial Touch Display Revenue (billion) Forecast, by Application 2020 & 2033
- Table 34: North Africa Industrial Touch Display Revenue (billion) Forecast, by Application 2020 & 2033
- Table 35: South Africa Industrial Touch Display Revenue (billion) Forecast, by Application 2020 & 2033
- Table 36: Rest of Middle East & Africa Industrial Touch Display Revenue (billion) Forecast, by Application 2020 & 2033
- Table 37: Global Industrial Touch Display Revenue billion Forecast, by Application 2020 & 2033
- Table 38: Global Industrial Touch Display Revenue billion Forecast, by Types 2020 & 2033
- Table 39: Global Industrial Touch Display Revenue billion Forecast, by Country 2020 & 2033
- Table 40: China Industrial Touch Display Revenue (billion) Forecast, by Application 2020 & 2033
- Table 41: India Industrial Touch Display Revenue (billion) Forecast, by Application 2020 & 2033
- Table 42: Japan Industrial Touch Display Revenue (billion) Forecast, by Application 2020 & 2033
- Table 43: South Korea Industrial Touch Display Revenue (billion) Forecast, by Application 2020 & 2033
- Table 44: ASEAN Industrial Touch Display Revenue (billion) Forecast, by Application 2020 & 2033
- Table 45: Oceania Industrial Touch Display Revenue (billion) Forecast, by Application 2020 & 2033
- Table 46: Rest of Asia Pacific Industrial Touch Display Revenue (billion) Forecast, by Application 2020 & 2033
Frequently Asked Questions
1. What is the projected Compound Annual Growth Rate (CAGR) of the Industrial Touch Display?
The projected CAGR is approximately 6.52%.
2. Which companies are prominent players in the Industrial Touch Display?
Key companies in the market include Faytech AG, Hope Industrial Systems, Advantech, ADLINK Technology, Fortec UK, Ekaa Technology Co., Ltd, Keetouch GMBH, Maple Systems, New Vision Display, Beetronics, TouchWo, TRU-Vu Monitors, Touch International, E3 Displays, STX Technology - Australia.
3. What are the main segments of the Industrial Touch Display?
The market segments include Application, Types.
4. Can you provide details about the market size?
The market size is estimated to be USD 6.37 billion as of 2022.
5. What are some drivers contributing to market growth?
N/A
6. What are the notable trends driving market growth?
N/A
7. Are there any restraints impacting market growth?
N/A
8. Can you provide examples of recent developments in the market?
N/A
9. What pricing options are available for accessing the report?
Pricing options include single-user, multi-user, and enterprise licenses priced at USD 4900.00, USD 7350.00, and USD 9800.00 respectively.
10. Is the market size provided in terms of value or volume?
The market size is provided in terms of value, measured in billion.
11. Are there any specific market keywords associated with the report?
Yes, the market keyword associated with the report is "Industrial Touch Display," which aids in identifying and referencing the specific market segment covered.
12. How do I determine which pricing option suits my needs best?
The pricing options vary based on user requirements and access needs. Individual users may opt for single-user licenses, while businesses requiring broader access may choose multi-user or enterprise licenses for cost-effective access to the report.
13. Are there any additional resources or data provided in the Industrial Touch Display report?
While the report offers comprehensive insights, it's advisable to review the specific contents or supplementary materials provided to ascertain if additional resources or data are available.
14. How can I stay updated on further developments or reports in the Industrial Touch Display?
To stay informed about further developments, trends, and reports in the Industrial Touch Display, consider subscribing to industry newsletters, following relevant companies and organizations, or regularly checking reputable industry news sources and publications.
Methodology
Step 1 - Identification of Relevant Samples Size from Population Database


Step 2 - Approaches for Defining Global Market Size (Value, Volume* & Price*)

Note*: In applicable scenarios
Step 3 - Data Sources
Primary Research
- Web Analytics
- Survey Reports
- Research Institute
- Latest Research Reports
- Opinion Leaders
Secondary Research
- Annual Reports
- White Paper
- Latest Press Release
- Industry Association
- Paid Database
- Investor Presentations

Step 4 - Data Triangulation
Involves using different sources of information in order to increase the validity of a study
These sources are likely to be stakeholders in a program - participants, other researchers, program staff, other community members, and so on.
Then we put all data in single framework & apply various statistical tools to find out the dynamic on the market.
During the analysis stage, feedback from the stakeholder groups would be compared to determine areas of agreement as well as areas of divergence