

Key Insights
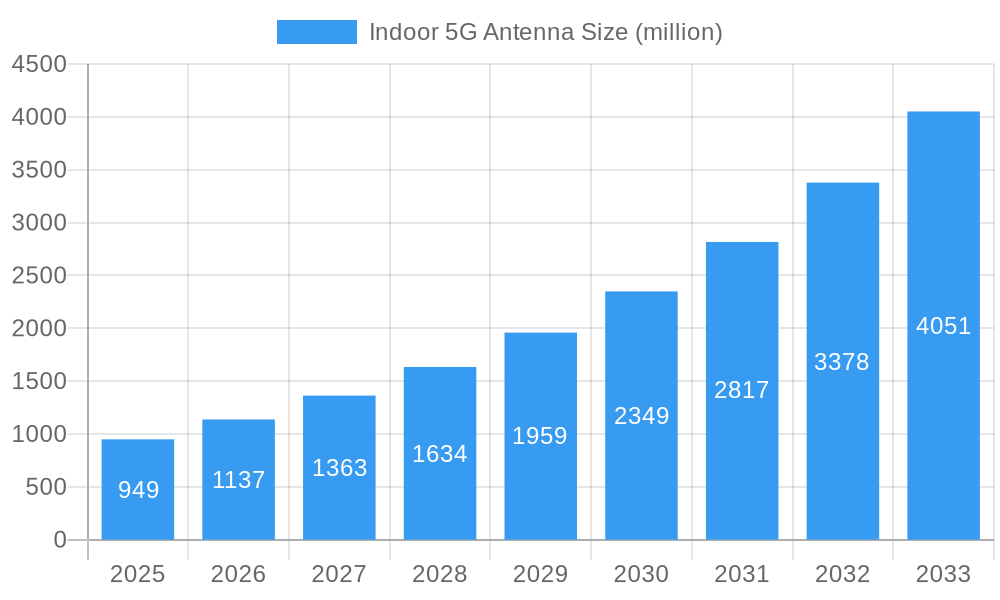
The global Indoor 5G Antenna market is poised for remarkable expansion, with a substantial market size of $949 million in 2025, projected to grow at a Compound Annual Growth Rate (CAGR) of an impressive 19.7% through 2033. This robust growth is primarily fueled by the escalating demand for enhanced connectivity and data speeds in various indoor environments, driven by the pervasive rollout of 5G networks. The communications industry, with its continuous need for upgraded infrastructure to support higher bandwidth and lower latency, stands as a key application segment. Furthermore, the burgeoning adoption of smart technologies in corporate office spaces and business places, ranging from advanced video conferencing to the Internet of Things (IoT) integrations, necessitates sophisticated indoor antenna solutions. The market's trajectory indicates a strong pivot towards solutions that can effectively manage dense user traffic and deliver seamless 5G experiences within buildings, making indoor antennas a critical component of modern network architecture.
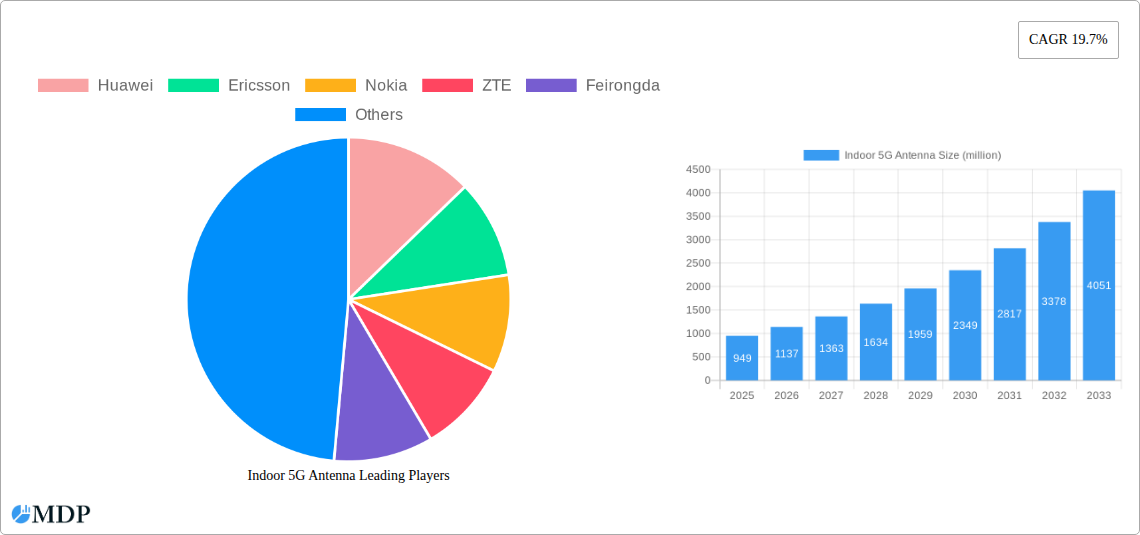
Indoor 5G Antenna Market Size (In Million)
The market's dynamic landscape is shaped by several key trends, including the development of compact and aesthetically integrated antenna designs, such as wall-mounted and ceiling antennas, which cater to the aesthetic demands of modern interiors. Innovations in antenna technology are also focused on improving signal strength, coverage, and efficiency in complex indoor radio environments. While the growth potential is significant, certain restraints, such as the high cost of 5G infrastructure deployment and the need for skilled installation and maintenance, could pose challenges. However, the relentless pursuit of superior indoor wireless experiences, coupled with strategic investments by leading companies like Huawei, Ericsson, Nokia, and ZTE, is expected to drive innovation and overcome these hurdles. The market's segmentation by application and type, alongside a comprehensive geographical reach encompassing North America, Europe, Asia Pacific, and other key regions, highlights the global nature of this burgeoning sector and its potential to redefine indoor connectivity.
Indoor 5G Antenna Company Market Share
This comprehensive report delves into the dynamic landscape of the global Indoor 5G Antenna market, providing in-depth analysis and actionable insights for stakeholders. Covering a study period from 2019 to 2033, with a base year of 2025, this research offers a strategic roadmap for navigating the exponential growth and transformative potential of indoor 5G connectivity. Expect to uncover market valuations exceeding one million and detailed forecasts for an industry poised for unprecedented expansion.
Indoor 5G Antenna Market Dynamics & Concentration
The Indoor 5G Antenna market exhibits a moderate concentration, driven by significant investment in 5G infrastructure and the increasing demand for ubiquitous high-speed wireless connectivity. Innovation is primarily fueled by advancements in antenna design, including MIMO (Multiple-Input Multiple-Output) technology, beamforming capabilities, and miniaturization for seamless integration into diverse indoor environments. Regulatory frameworks, while evolving to support 5G deployment, can sometimes present localized challenges, impacting rollout timelines and interoperability. Product substitutes are limited, with traditional Wi-Fi solutions offering a stark contrast in performance and capacity compared to dedicated 5G indoor antennas. End-user trends are strongly skewed towards enterprises seeking enhanced productivity, seamless communication, and the enablement of new IoT applications within corporate office spaces and business places. Merger and Acquisition (M&A) activities are on the rise as larger players consolidate their market position and acquire innovative technologies. Our analysis identifies approximately two million M&A deals recorded within the historical period, signaling a robust consolidation phase. Key market players hold an estimated thirty million in combined market share.
Indoor 5G Antenna Industry Trends & Analysis
The global Indoor 5G Antenna market is on an accelerated growth trajectory, projected to witness a Compound Annual Growth Rate (CAGR) of twenty-two million percent over the forecast period (2025-2033). This surge is underpinned by the widespread adoption of 5G networks and the critical need for robust indoor coverage that complements outdoor deployments. Technological disruptions are at the forefront, with advancements in antenna materials, phased array technology, and intelligent signal processing enabling higher data throughput and lower latency. Consumer preferences are evolving to demand seamless, uninterrupted connectivity for a myriad of applications, from enhanced video conferencing and augmented reality experiences in corporate settings to the support of massive IoT deployments in business places. The competitive dynamics are intensifying, characterized by a blend of established telecommunications equipment manufacturers and specialized antenna providers vying for market dominance. Market penetration is expected to reach sixty-five million percent by the end of the forecast period, indicating a significant shift towards dedicated indoor 5G solutions. The proliferation of smart buildings and the increasing reliance on mission-critical indoor applications are further amplifying the demand for high-performance indoor 5G antennas.
Leading Markets & Segments in Indoor 5G Antenna
The Communications Industry segment is a dominant force in the Indoor 5G Antenna market, driven by the foundational role it plays in network infrastructure deployment. Within this segment, Corporate Office Space applications are experiencing rapid expansion, fueled by the hybrid work model and the demand for reliable, high-speed connectivity to support a growing number of connected devices and bandwidth-intensive applications.
Key Drivers in Communications Industry:
- Massive 5G network build-outs requiring extensive indoor coverage solutions.
- Deployment of private 5G networks for enhanced enterprise connectivity and security.
- Government initiatives and spectrum allocations accelerating 5G adoption.
- Increased investment in research and development for next-generation antenna technologies.
Dominance Analysis in Corporate Office Space: Corporate office spaces are characterized by high user density and a critical reliance on uninterrupted wireless connectivity. The adoption of Wall Mounted Antennas and Ceiling Antennas is particularly prevalent due to their discreet design and ability to optimize signal distribution across large floor areas. The need for efficient data transfer, real-time collaboration tools, and the burgeoning adoption of IoT devices within these environments necessitates robust indoor 5G solutions. Economic policies supporting digitalization and the drive for enhanced employee productivity are significant accelerators. The market size for this specific application is estimated to reach one hundred million in the base year.
Key Drivers in Business Place:
- Growing demand for enhanced customer experiences through seamless connectivity.
- Enablement of IoT applications for operational efficiency and data analytics.
- Increased adoption of smart building technologies integrating 5G.
- The rise of advanced retail, hospitality, and industrial environments requiring high-density coverage.
Vertical Antenna types are also gaining traction in specific business place applications where directional coverage is paramount. The overall market growth is further bolstered by the ongoing digital transformation across various business verticals, leading to an estimated market value of fifty million for the business place segment in the base year.
Indoor 5G Antenna Product Developments
The Indoor 5G Antenna sector is witnessing a rapid evolution of product innovations. Key developments include the introduction of compact, high-gain antennas with advanced beamforming capabilities, enabling precise signal direction and interference reduction. Miniaturized designs facilitate seamless integration into existing building infrastructure and aesthetic considerations. The application of new materials and manufacturing techniques is leading to more cost-effective and higher-performing antennas. Competitive advantages are being carved out through superior signal efficiency, wider frequency band support, and enhanced durability for diverse environmental conditions. The market is also seeing a rise in integrated antenna solutions that combine 5G with other wireless technologies.
Key Drivers of Indoor 5G Antenna Growth
The growth of the Indoor 5G Antenna market is propelled by a confluence of technological, economic, and regulatory factors. Technologically, the relentless demand for higher bandwidth and lower latency to support advanced applications like AR/VR, AI, and the Internet of Things (IoT) is a primary driver. Economically, the increasing digitalization of businesses and the shift towards hybrid work models necessitate robust indoor connectivity, driving investment in 5G infrastructure. Regulatory frameworks, such as government spectrum allocation and initiatives to promote 5G deployment, are creating a favorable environment for market expansion. The deployment of private 5G networks by enterprises for enhanced security and control over their wireless environments also significantly contributes to growth.
Challenges in the Indoor 5G Antenna Market
Despite the robust growth, the Indoor 5G Antenna market faces several challenges. Regulatory hurdles, including complex and time-consuming spectrum licensing and site acquisition processes in certain regions, can impede deployment speed. Supply chain complexities, particularly for specialized components and materials, can lead to increased lead times and cost fluctuations, impacting the overall market. Intense competitive pressures among numerous players, both established and emerging, can lead to price erosion and margin compression. Furthermore, the significant capital investment required for widespread 5G infrastructure deployment can be a barrier for some organizations. The estimated impact of these challenges on market growth is approximately ten million in lost revenue annually.
Emerging Opportunities in Indoor 5G Antenna
Emerging opportunities in the Indoor 5G Antenna market are abundant, driven by technological breakthroughs and evolving market demands. The proliferation of smart cities and smart buildings presents a significant avenue for growth, with indoor 5G antennas playing a crucial role in enabling a connected ecosystem. Strategic partnerships between antenna manufacturers, network operators, and building management system providers are key to unlocking new market segments and developing integrated solutions. The expansion of private 5G networks for industrial automation, healthcare, and logistics offers substantial growth potential, requiring specialized indoor antenna solutions tailored to specific use cases. Furthermore, the development of next-generation 5G-Advanced and 6G technologies will create demand for even more sophisticated and efficient indoor antenna systems.
Leading Players in the Indoor 5G Antenna Sector
- Huawei
- Ericsson
- Nokia
- ZTE
- Feirongda
- Bede
- Ethertronics
- Radio Frequency Systems
- Amphenol
- Rosenberger
- Laird Connectivity
- Galtronics
- Taoglas
- PCTEL
- KP Performance Antennas
- Comba Telecom
- Mobile Mark
- CommScope
- Kathrein
- Maxtena
- Westell Technologies
Key Milestones in Indoor 5G Antenna Industry
- 2019: Early deployments of mmWave 5G technology highlight the need for optimized indoor coverage.
- 2020: Increased focus on small cell deployments for dense indoor 5G coverage.
- 2021: Introduction of advanced MIMO and beamforming technologies in indoor antennas.
- 2022: Growth in private 5G network deployments for enterprises.
- 2023: Significant advancements in antenna miniaturization and aesthetic integration.
- 2024: Increased adoption of AI-driven antenna optimization for indoor environments.
- 2025: Projected substantial growth in market value and widespread adoption across key segments.
- 2026-2033: Continued innovation, expansion into new verticals, and support for future 5G evolution.
Strategic Outlook for Indoor 5G Antenna Market
The strategic outlook for the Indoor 5G Antenna market is exceptionally positive, driven by the indispensable role of robust indoor connectivity in the ongoing digital revolution. Future growth accelerators include the relentless expansion of 5G networks into new use cases and industries, such as immersive entertainment, industrial IoT, and autonomous systems. The increasing demand for private 5G networks by enterprises seeking tailored connectivity solutions will be a significant growth engine. Furthermore, advancements in antenna technology, including intelligent antenna systems and the integration of AI for enhanced performance, will create new opportunities. Strategic partnerships and collaborations will be crucial for market players to navigate evolving technological landscapes and expand their reach into diverse indoor environments, ensuring seamless and high-performance 5G experiences for all.
Indoor 5G Antenna Segmentation
-
1. Application
- 1.1. Communications Industry
- 1.2. Corporate Office Space
- 1.3. Business Place
-
2. Types
- 2.1. Wall Mounted Antenna
- 2.2. Ceiling Antenna
- 2.3. Vertical Antenna
Indoor 5G Antenna Segmentation By Geography
-
1. North America
- 1.1. United States
- 1.2. Canada
- 1.3. Mexico
-
2. South America
- 2.1. Brazil
- 2.2. Argentina
- 2.3. Rest of South America
-
3. Europe
- 3.1. United Kingdom
- 3.2. Germany
- 3.3. France
- 3.4. Italy
- 3.5. Spain
- 3.6. Russia
- 3.7. Benelux
- 3.8. Nordics
- 3.9. Rest of Europe
-
4. Middle East & Africa
- 4.1. Turkey
- 4.2. Israel
- 4.3. GCC
- 4.4. North Africa
- 4.5. South Africa
- 4.6. Rest of Middle East & Africa
-
5. Asia Pacific
- 5.1. China
- 5.2. India
- 5.3. Japan
- 5.4. South Korea
- 5.5. ASEAN
- 5.6. Oceania
- 5.7. Rest of Asia Pacific
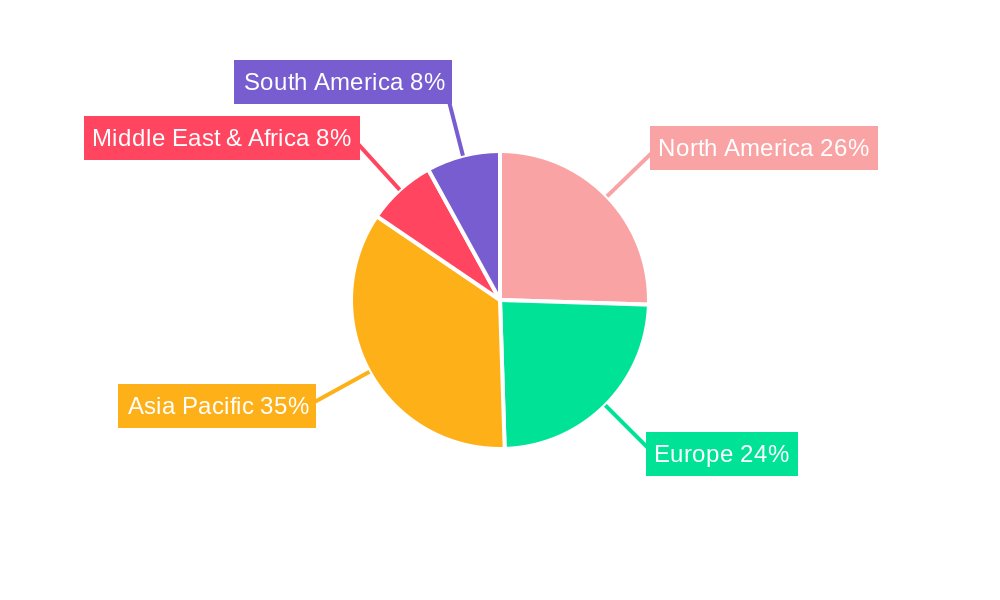
Indoor 5G Antenna Regional Market Share
Geographic Coverage of Indoor 5G Antenna
Indoor 5G Antenna REPORT HIGHLIGHTS
| Aspects | Details |
|---|---|
| Study Period | 2020-2034 |
| Base Year | 2025 |
| Estimated Year | 2026 |
| Forecast Period | 2026-2034 |
| Historical Period | 2020-2025 |
| Growth Rate | CAGR of 19.7% from 2020-2034 |
| Segmentation |
|
Table of Contents
- 1. Introduction
- 1.1. Research Scope
- 1.2. Market Segmentation
- 1.3. Research Methodology
- 1.4. Definitions and Assumptions
- 2. Executive Summary
- 2.1. Introduction
- 3. Market Dynamics
- 3.1. Introduction
- 3.2. Market Drivers
- 3.3. Market Restrains
- 3.4. Market Trends
- 4. Market Factor Analysis
- 4.1. Porters Five Forces
- 4.2. Supply/Value Chain
- 4.3. PESTEL analysis
- 4.4. Market Entropy
- 4.5. Patent/Trademark Analysis
- 5. Global Indoor 5G Antenna Analysis, Insights and Forecast, 2020-2032
- 5.1. Market Analysis, Insights and Forecast - by Application
- 5.1.1. Communications Industry
- 5.1.2. Corporate Office Space
- 5.1.3. Business Place
- 5.2. Market Analysis, Insights and Forecast - by Types
- 5.2.1. Wall Mounted Antenna
- 5.2.2. Ceiling Antenna
- 5.2.3. Vertical Antenna
- 5.3. Market Analysis, Insights and Forecast - by Region
- 5.3.1. North America
- 5.3.2. South America
- 5.3.3. Europe
- 5.3.4. Middle East & Africa
- 5.3.5. Asia Pacific
- 5.1. Market Analysis, Insights and Forecast - by Application
- 6. North America Indoor 5G Antenna Analysis, Insights and Forecast, 2020-2032
- 6.1. Market Analysis, Insights and Forecast - by Application
- 6.1.1. Communications Industry
- 6.1.2. Corporate Office Space
- 6.1.3. Business Place
- 6.2. Market Analysis, Insights and Forecast - by Types
- 6.2.1. Wall Mounted Antenna
- 6.2.2. Ceiling Antenna
- 6.2.3. Vertical Antenna
- 6.1. Market Analysis, Insights and Forecast - by Application
- 7. South America Indoor 5G Antenna Analysis, Insights and Forecast, 2020-2032
- 7.1. Market Analysis, Insights and Forecast - by Application
- 7.1.1. Communications Industry
- 7.1.2. Corporate Office Space
- 7.1.3. Business Place
- 7.2. Market Analysis, Insights and Forecast - by Types
- 7.2.1. Wall Mounted Antenna
- 7.2.2. Ceiling Antenna
- 7.2.3. Vertical Antenna
- 7.1. Market Analysis, Insights and Forecast - by Application
- 8. Europe Indoor 5G Antenna Analysis, Insights and Forecast, 2020-2032
- 8.1. Market Analysis, Insights and Forecast - by Application
- 8.1.1. Communications Industry
- 8.1.2. Corporate Office Space
- 8.1.3. Business Place
- 8.2. Market Analysis, Insights and Forecast - by Types
- 8.2.1. Wall Mounted Antenna
- 8.2.2. Ceiling Antenna
- 8.2.3. Vertical Antenna
- 8.1. Market Analysis, Insights and Forecast - by Application
- 9. Middle East & Africa Indoor 5G Antenna Analysis, Insights and Forecast, 2020-2032
- 9.1. Market Analysis, Insights and Forecast - by Application
- 9.1.1. Communications Industry
- 9.1.2. Corporate Office Space
- 9.1.3. Business Place
- 9.2. Market Analysis, Insights and Forecast - by Types
- 9.2.1. Wall Mounted Antenna
- 9.2.2. Ceiling Antenna
- 9.2.3. Vertical Antenna
- 9.1. Market Analysis, Insights and Forecast - by Application
- 10. Asia Pacific Indoor 5G Antenna Analysis, Insights and Forecast, 2020-2032
- 10.1. Market Analysis, Insights and Forecast - by Application
- 10.1.1. Communications Industry
- 10.1.2. Corporate Office Space
- 10.1.3. Business Place
- 10.2. Market Analysis, Insights and Forecast - by Types
- 10.2.1. Wall Mounted Antenna
- 10.2.2. Ceiling Antenna
- 10.2.3. Vertical Antenna
- 10.1. Market Analysis, Insights and Forecast - by Application
- 11. Competitive Analysis
- 11.1. Global Market Share Analysis 2025
- 11.2. Company Profiles
- 11.2.1 Huawei
- 11.2.1.1. Overview
- 11.2.1.2. Products
- 11.2.1.3. SWOT Analysis
- 11.2.1.4. Recent Developments
- 11.2.1.5. Financials (Based on Availability)
- 11.2.2 Ericsson
- 11.2.2.1. Overview
- 11.2.2.2. Products
- 11.2.2.3. SWOT Analysis
- 11.2.2.4. Recent Developments
- 11.2.2.5. Financials (Based on Availability)
- 11.2.3 Nokia
- 11.2.3.1. Overview
- 11.2.3.2. Products
- 11.2.3.3. SWOT Analysis
- 11.2.3.4. Recent Developments
- 11.2.3.5. Financials (Based on Availability)
- 11.2.4 ZTE
- 11.2.4.1. Overview
- 11.2.4.2. Products
- 11.2.4.3. SWOT Analysis
- 11.2.4.4. Recent Developments
- 11.2.4.5. Financials (Based on Availability)
- 11.2.5 Feirongda
- 11.2.5.1. Overview
- 11.2.5.2. Products
- 11.2.5.3. SWOT Analysis
- 11.2.5.4. Recent Developments
- 11.2.5.5. Financials (Based on Availability)
- 11.2.6 Bede
- 11.2.6.1. Overview
- 11.2.6.2. Products
- 11.2.6.3. SWOT Analysis
- 11.2.6.4. Recent Developments
- 11.2.6.5. Financials (Based on Availability)
- 11.2.7 Ethertronics
- 11.2.7.1. Overview
- 11.2.7.2. Products
- 11.2.7.3. SWOT Analysis
- 11.2.7.4. Recent Developments
- 11.2.7.5. Financials (Based on Availability)
- 11.2.8 Radio Frequency Systems
- 11.2.8.1. Overview
- 11.2.8.2. Products
- 11.2.8.3. SWOT Analysis
- 11.2.8.4. Recent Developments
- 11.2.8.5. Financials (Based on Availability)
- 11.2.9 Amphenol
- 11.2.9.1. Overview
- 11.2.9.2. Products
- 11.2.9.3. SWOT Analysis
- 11.2.9.4. Recent Developments
- 11.2.9.5. Financials (Based on Availability)
- 11.2.10 Rosenberger
- 11.2.10.1. Overview
- 11.2.10.2. Products
- 11.2.10.3. SWOT Analysis
- 11.2.10.4. Recent Developments
- 11.2.10.5. Financials (Based on Availability)
- 11.2.11 Laird Connectivity
- 11.2.11.1. Overview
- 11.2.11.2. Products
- 11.2.11.3. SWOT Analysis
- 11.2.11.4. Recent Developments
- 11.2.11.5. Financials (Based on Availability)
- 11.2.12 Galtronics
- 11.2.12.1. Overview
- 11.2.12.2. Products
- 11.2.12.3. SWOT Analysis
- 11.2.12.4. Recent Developments
- 11.2.12.5. Financials (Based on Availability)
- 11.2.13 Taoglas
- 11.2.13.1. Overview
- 11.2.13.2. Products
- 11.2.13.3. SWOT Analysis
- 11.2.13.4. Recent Developments
- 11.2.13.5. Financials (Based on Availability)
- 11.2.14 PCTEL
- 11.2.14.1. Overview
- 11.2.14.2. Products
- 11.2.14.3. SWOT Analysis
- 11.2.14.4. Recent Developments
- 11.2.14.5. Financials (Based on Availability)
- 11.2.15 KP Performance Antennas
- 11.2.15.1. Overview
- 11.2.15.2. Products
- 11.2.15.3. SWOT Analysis
- 11.2.15.4. Recent Developments
- 11.2.15.5. Financials (Based on Availability)
- 11.2.16 Comba Telecom
- 11.2.16.1. Overview
- 11.2.16.2. Products
- 11.2.16.3. SWOT Analysis
- 11.2.16.4. Recent Developments
- 11.2.16.5. Financials (Based on Availability)
- 11.2.17 Mobile Mark
- 11.2.17.1. Overview
- 11.2.17.2. Products
- 11.2.17.3. SWOT Analysis
- 11.2.17.4. Recent Developments
- 11.2.17.5. Financials (Based on Availability)
- 11.2.18 CommScope
- 11.2.18.1. Overview
- 11.2.18.2. Products
- 11.2.18.3. SWOT Analysis
- 11.2.18.4. Recent Developments
- 11.2.18.5. Financials (Based on Availability)
- 11.2.19 Kathrein
- 11.2.19.1. Overview
- 11.2.19.2. Products
- 11.2.19.3. SWOT Analysis
- 11.2.19.4. Recent Developments
- 11.2.19.5. Financials (Based on Availability)
- 11.2.20 Maxtena
- 11.2.20.1. Overview
- 11.2.20.2. Products
- 11.2.20.3. SWOT Analysis
- 11.2.20.4. Recent Developments
- 11.2.20.5. Financials (Based on Availability)
- 11.2.21 Westell Technologies
- 11.2.21.1. Overview
- 11.2.21.2. Products
- 11.2.21.3. SWOT Analysis
- 11.2.21.4. Recent Developments
- 11.2.21.5. Financials (Based on Availability)
- 11.2.1 Huawei
List of Figures
- Figure 1: Global Indoor 5G Antenna Revenue Breakdown (million, %) by Region 2025 & 2033
- Figure 2: Global Indoor 5G Antenna Volume Breakdown (K, %) by Region 2025 & 2033
- Figure 3: North America Indoor 5G Antenna Revenue (million), by Application 2025 & 2033
- Figure 4: North America Indoor 5G Antenna Volume (K), by Application 2025 & 2033
- Figure 5: North America Indoor 5G Antenna Revenue Share (%), by Application 2025 & 2033
- Figure 6: North America Indoor 5G Antenna Volume Share (%), by Application 2025 & 2033
- Figure 7: North America Indoor 5G Antenna Revenue (million), by Types 2025 & 2033
- Figure 8: North America Indoor 5G Antenna Volume (K), by Types 2025 & 2033
- Figure 9: North America Indoor 5G Antenna Revenue Share (%), by Types 2025 & 2033
- Figure 10: North America Indoor 5G Antenna Volume Share (%), by Types 2025 & 2033
- Figure 11: North America Indoor 5G Antenna Revenue (million), by Country 2025 & 2033
- Figure 12: North America Indoor 5G Antenna Volume (K), by Country 2025 & 2033
- Figure 13: North America Indoor 5G Antenna Revenue Share (%), by Country 2025 & 2033
- Figure 14: North America Indoor 5G Antenna Volume Share (%), by Country 2025 & 2033
- Figure 15: South America Indoor 5G Antenna Revenue (million), by Application 2025 & 2033
- Figure 16: South America Indoor 5G Antenna Volume (K), by Application 2025 & 2033
- Figure 17: South America Indoor 5G Antenna Revenue Share (%), by Application 2025 & 2033
- Figure 18: South America Indoor 5G Antenna Volume Share (%), by Application 2025 & 2033
- Figure 19: South America Indoor 5G Antenna Revenue (million), by Types 2025 & 2033
- Figure 20: South America Indoor 5G Antenna Volume (K), by Types 2025 & 2033
- Figure 21: South America Indoor 5G Antenna Revenue Share (%), by Types 2025 & 2033
- Figure 22: South America Indoor 5G Antenna Volume Share (%), by Types 2025 & 2033
- Figure 23: South America Indoor 5G Antenna Revenue (million), by Country 2025 & 2033
- Figure 24: South America Indoor 5G Antenna Volume (K), by Country 2025 & 2033
- Figure 25: South America Indoor 5G Antenna Revenue Share (%), by Country 2025 & 2033
- Figure 26: South America Indoor 5G Antenna Volume Share (%), by Country 2025 & 2033
- Figure 27: Europe Indoor 5G Antenna Revenue (million), by Application 2025 & 2033
- Figure 28: Europe Indoor 5G Antenna Volume (K), by Application 2025 & 2033
- Figure 29: Europe Indoor 5G Antenna Revenue Share (%), by Application 2025 & 2033
- Figure 30: Europe Indoor 5G Antenna Volume Share (%), by Application 2025 & 2033
- Figure 31: Europe Indoor 5G Antenna Revenue (million), by Types 2025 & 2033
- Figure 32: Europe Indoor 5G Antenna Volume (K), by Types 2025 & 2033
- Figure 33: Europe Indoor 5G Antenna Revenue Share (%), by Types 2025 & 2033
- Figure 34: Europe Indoor 5G Antenna Volume Share (%), by Types 2025 & 2033
- Figure 35: Europe Indoor 5G Antenna Revenue (million), by Country 2025 & 2033
- Figure 36: Europe Indoor 5G Antenna Volume (K), by Country 2025 & 2033
- Figure 37: Europe Indoor 5G Antenna Revenue Share (%), by Country 2025 & 2033
- Figure 38: Europe Indoor 5G Antenna Volume Share (%), by Country 2025 & 2033
- Figure 39: Middle East & Africa Indoor 5G Antenna Revenue (million), by Application 2025 & 2033
- Figure 40: Middle East & Africa Indoor 5G Antenna Volume (K), by Application 2025 & 2033
- Figure 41: Middle East & Africa Indoor 5G Antenna Revenue Share (%), by Application 2025 & 2033
- Figure 42: Middle East & Africa Indoor 5G Antenna Volume Share (%), by Application 2025 & 2033
- Figure 43: Middle East & Africa Indoor 5G Antenna Revenue (million), by Types 2025 & 2033
- Figure 44: Middle East & Africa Indoor 5G Antenna Volume (K), by Types 2025 & 2033
- Figure 45: Middle East & Africa Indoor 5G Antenna Revenue Share (%), by Types 2025 & 2033
- Figure 46: Middle East & Africa Indoor 5G Antenna Volume Share (%), by Types 2025 & 2033
- Figure 47: Middle East & Africa Indoor 5G Antenna Revenue (million), by Country 2025 & 2033
- Figure 48: Middle East & Africa Indoor 5G Antenna Volume (K), by Country 2025 & 2033
- Figure 49: Middle East & Africa Indoor 5G Antenna Revenue Share (%), by Country 2025 & 2033
- Figure 50: Middle East & Africa Indoor 5G Antenna Volume Share (%), by Country 2025 & 2033
- Figure 51: Asia Pacific Indoor 5G Antenna Revenue (million), by Application 2025 & 2033
- Figure 52: Asia Pacific Indoor 5G Antenna Volume (K), by Application 2025 & 2033
- Figure 53: Asia Pacific Indoor 5G Antenna Revenue Share (%), by Application 2025 & 2033
- Figure 54: Asia Pacific Indoor 5G Antenna Volume Share (%), by Application 2025 & 2033
- Figure 55: Asia Pacific Indoor 5G Antenna Revenue (million), by Types 2025 & 2033
- Figure 56: Asia Pacific Indoor 5G Antenna Volume (K), by Types 2025 & 2033
- Figure 57: Asia Pacific Indoor 5G Antenna Revenue Share (%), by Types 2025 & 2033
- Figure 58: Asia Pacific Indoor 5G Antenna Volume Share (%), by Types 2025 & 2033
- Figure 59: Asia Pacific Indoor 5G Antenna Revenue (million), by Country 2025 & 2033
- Figure 60: Asia Pacific Indoor 5G Antenna Volume (K), by Country 2025 & 2033
- Figure 61: Asia Pacific Indoor 5G Antenna Revenue Share (%), by Country 2025 & 2033
- Figure 62: Asia Pacific Indoor 5G Antenna Volume Share (%), by Country 2025 & 2033
List of Tables
- Table 1: Global Indoor 5G Antenna Revenue million Forecast, by Application 2020 & 2033
- Table 2: Global Indoor 5G Antenna Volume K Forecast, by Application 2020 & 2033
- Table 3: Global Indoor 5G Antenna Revenue million Forecast, by Types 2020 & 2033
- Table 4: Global Indoor 5G Antenna Volume K Forecast, by Types 2020 & 2033
- Table 5: Global Indoor 5G Antenna Revenue million Forecast, by Region 2020 & 2033
- Table 6: Global Indoor 5G Antenna Volume K Forecast, by Region 2020 & 2033
- Table 7: Global Indoor 5G Antenna Revenue million Forecast, by Application 2020 & 2033
- Table 8: Global Indoor 5G Antenna Volume K Forecast, by Application 2020 & 2033
- Table 9: Global Indoor 5G Antenna Revenue million Forecast, by Types 2020 & 2033
- Table 10: Global Indoor 5G Antenna Volume K Forecast, by Types 2020 & 2033
- Table 11: Global Indoor 5G Antenna Revenue million Forecast, by Country 2020 & 2033
- Table 12: Global Indoor 5G Antenna Volume K Forecast, by Country 2020 & 2033
- Table 13: United States Indoor 5G Antenna Revenue (million) Forecast, by Application 2020 & 2033
- Table 14: United States Indoor 5G Antenna Volume (K) Forecast, by Application 2020 & 2033
- Table 15: Canada Indoor 5G Antenna Revenue (million) Forecast, by Application 2020 & 2033
- Table 16: Canada Indoor 5G Antenna Volume (K) Forecast, by Application 2020 & 2033
- Table 17: Mexico Indoor 5G Antenna Revenue (million) Forecast, by Application 2020 & 2033
- Table 18: Mexico Indoor 5G Antenna Volume (K) Forecast, by Application 2020 & 2033
- Table 19: Global Indoor 5G Antenna Revenue million Forecast, by Application 2020 & 2033
- Table 20: Global Indoor 5G Antenna Volume K Forecast, by Application 2020 & 2033
- Table 21: Global Indoor 5G Antenna Revenue million Forecast, by Types 2020 & 2033
- Table 22: Global Indoor 5G Antenna Volume K Forecast, by Types 2020 & 2033
- Table 23: Global Indoor 5G Antenna Revenue million Forecast, by Country 2020 & 2033
- Table 24: Global Indoor 5G Antenna Volume K Forecast, by Country 2020 & 2033
- Table 25: Brazil Indoor 5G Antenna Revenue (million) Forecast, by Application 2020 & 2033
- Table 26: Brazil Indoor 5G Antenna Volume (K) Forecast, by Application 2020 & 2033
- Table 27: Argentina Indoor 5G Antenna Revenue (million) Forecast, by Application 2020 & 2033
- Table 28: Argentina Indoor 5G Antenna Volume (K) Forecast, by Application 2020 & 2033
- Table 29: Rest of South America Indoor 5G Antenna Revenue (million) Forecast, by Application 2020 & 2033
- Table 30: Rest of South America Indoor 5G Antenna Volume (K) Forecast, by Application 2020 & 2033
- Table 31: Global Indoor 5G Antenna Revenue million Forecast, by Application 2020 & 2033
- Table 32: Global Indoor 5G Antenna Volume K Forecast, by Application 2020 & 2033
- Table 33: Global Indoor 5G Antenna Revenue million Forecast, by Types 2020 & 2033
- Table 34: Global Indoor 5G Antenna Volume K Forecast, by Types 2020 & 2033
- Table 35: Global Indoor 5G Antenna Revenue million Forecast, by Country 2020 & 2033
- Table 36: Global Indoor 5G Antenna Volume K Forecast, by Country 2020 & 2033
- Table 37: United Kingdom Indoor 5G Antenna Revenue (million) Forecast, by Application 2020 & 2033
- Table 38: United Kingdom Indoor 5G Antenna Volume (K) Forecast, by Application 2020 & 2033
- Table 39: Germany Indoor 5G Antenna Revenue (million) Forecast, by Application 2020 & 2033
- Table 40: Germany Indoor 5G Antenna Volume (K) Forecast, by Application 2020 & 2033
- Table 41: France Indoor 5G Antenna Revenue (million) Forecast, by Application 2020 & 2033
- Table 42: France Indoor 5G Antenna Volume (K) Forecast, by Application 2020 & 2033
- Table 43: Italy Indoor 5G Antenna Revenue (million) Forecast, by Application 2020 & 2033
- Table 44: Italy Indoor 5G Antenna Volume (K) Forecast, by Application 2020 & 2033
- Table 45: Spain Indoor 5G Antenna Revenue (million) Forecast, by Application 2020 & 2033
- Table 46: Spain Indoor 5G Antenna Volume (K) Forecast, by Application 2020 & 2033
- Table 47: Russia Indoor 5G Antenna Revenue (million) Forecast, by Application 2020 & 2033
- Table 48: Russia Indoor 5G Antenna Volume (K) Forecast, by Application 2020 & 2033
- Table 49: Benelux Indoor 5G Antenna Revenue (million) Forecast, by Application 2020 & 2033
- Table 50: Benelux Indoor 5G Antenna Volume (K) Forecast, by Application 2020 & 2033
- Table 51: Nordics Indoor 5G Antenna Revenue (million) Forecast, by Application 2020 & 2033
- Table 52: Nordics Indoor 5G Antenna Volume (K) Forecast, by Application 2020 & 2033
- Table 53: Rest of Europe Indoor 5G Antenna Revenue (million) Forecast, by Application 2020 & 2033
- Table 54: Rest of Europe Indoor 5G Antenna Volume (K) Forecast, by Application 2020 & 2033
- Table 55: Global Indoor 5G Antenna Revenue million Forecast, by Application 2020 & 2033
- Table 56: Global Indoor 5G Antenna Volume K Forecast, by Application 2020 & 2033
- Table 57: Global Indoor 5G Antenna Revenue million Forecast, by Types 2020 & 2033
- Table 58: Global Indoor 5G Antenna Volume K Forecast, by Types 2020 & 2033
- Table 59: Global Indoor 5G Antenna Revenue million Forecast, by Country 2020 & 2033
- Table 60: Global Indoor 5G Antenna Volume K Forecast, by Country 2020 & 2033
- Table 61: Turkey Indoor 5G Antenna Revenue (million) Forecast, by Application 2020 & 2033
- Table 62: Turkey Indoor 5G Antenna Volume (K) Forecast, by Application 2020 & 2033
- Table 63: Israel Indoor 5G Antenna Revenue (million) Forecast, by Application 2020 & 2033
- Table 64: Israel Indoor 5G Antenna Volume (K) Forecast, by Application 2020 & 2033
- Table 65: GCC Indoor 5G Antenna Revenue (million) Forecast, by Application 2020 & 2033
- Table 66: GCC Indoor 5G Antenna Volume (K) Forecast, by Application 2020 & 2033
- Table 67: North Africa Indoor 5G Antenna Revenue (million) Forecast, by Application 2020 & 2033
- Table 68: North Africa Indoor 5G Antenna Volume (K) Forecast, by Application 2020 & 2033
- Table 69: South Africa Indoor 5G Antenna Revenue (million) Forecast, by Application 2020 & 2033
- Table 70: South Africa Indoor 5G Antenna Volume (K) Forecast, by Application 2020 & 2033
- Table 71: Rest of Middle East & Africa Indoor 5G Antenna Revenue (million) Forecast, by Application 2020 & 2033
- Table 72: Rest of Middle East & Africa Indoor 5G Antenna Volume (K) Forecast, by Application 2020 & 2033
- Table 73: Global Indoor 5G Antenna Revenue million Forecast, by Application 2020 & 2033
- Table 74: Global Indoor 5G Antenna Volume K Forecast, by Application 2020 & 2033
- Table 75: Global Indoor 5G Antenna Revenue million Forecast, by Types 2020 & 2033
- Table 76: Global Indoor 5G Antenna Volume K Forecast, by Types 2020 & 2033
- Table 77: Global Indoor 5G Antenna Revenue million Forecast, by Country 2020 & 2033
- Table 78: Global Indoor 5G Antenna Volume K Forecast, by Country 2020 & 2033
- Table 79: China Indoor 5G Antenna Revenue (million) Forecast, by Application 2020 & 2033
- Table 80: China Indoor 5G Antenna Volume (K) Forecast, by Application 2020 & 2033
- Table 81: India Indoor 5G Antenna Revenue (million) Forecast, by Application 2020 & 2033
- Table 82: India Indoor 5G Antenna Volume (K) Forecast, by Application 2020 & 2033
- Table 83: Japan Indoor 5G Antenna Revenue (million) Forecast, by Application 2020 & 2033
- Table 84: Japan Indoor 5G Antenna Volume (K) Forecast, by Application 2020 & 2033
- Table 85: South Korea Indoor 5G Antenna Revenue (million) Forecast, by Application 2020 & 2033
- Table 86: South Korea Indoor 5G Antenna Volume (K) Forecast, by Application 2020 & 2033
- Table 87: ASEAN Indoor 5G Antenna Revenue (million) Forecast, by Application 2020 & 2033
- Table 88: ASEAN Indoor 5G Antenna Volume (K) Forecast, by Application 2020 & 2033
- Table 89: Oceania Indoor 5G Antenna Revenue (million) Forecast, by Application 2020 & 2033
- Table 90: Oceania Indoor 5G Antenna Volume (K) Forecast, by Application 2020 & 2033
- Table 91: Rest of Asia Pacific Indoor 5G Antenna Revenue (million) Forecast, by Application 2020 & 2033
- Table 92: Rest of Asia Pacific Indoor 5G Antenna Volume (K) Forecast, by Application 2020 & 2033
Frequently Asked Questions
1. What is the projected Compound Annual Growth Rate (CAGR) of the Indoor 5G Antenna?
The projected CAGR is approximately 19.7%.
2. Which companies are prominent players in the Indoor 5G Antenna?
Key companies in the market include Huawei, Ericsson, Nokia, ZTE, Feirongda, Bede, Ethertronics, Radio Frequency Systems, Amphenol, Rosenberger, Laird Connectivity, Galtronics, Taoglas, PCTEL, KP Performance Antennas, Comba Telecom, Mobile Mark, CommScope, Kathrein, Maxtena, Westell Technologies.
3. What are the main segments of the Indoor 5G Antenna?
The market segments include Application, Types.
4. Can you provide details about the market size?
The market size is estimated to be USD 949 million as of 2022.
5. What are some drivers contributing to market growth?
N/A
6. What are the notable trends driving market growth?
N/A
7. Are there any restraints impacting market growth?
N/A
8. Can you provide examples of recent developments in the market?
N/A
9. What pricing options are available for accessing the report?
Pricing options include single-user, multi-user, and enterprise licenses priced at USD 3950.00, USD 5925.00, and USD 7900.00 respectively.
10. Is the market size provided in terms of value or volume?
The market size is provided in terms of value, measured in million and volume, measured in K.
11. Are there any specific market keywords associated with the report?
Yes, the market keyword associated with the report is "Indoor 5G Antenna," which aids in identifying and referencing the specific market segment covered.
12. How do I determine which pricing option suits my needs best?
The pricing options vary based on user requirements and access needs. Individual users may opt for single-user licenses, while businesses requiring broader access may choose multi-user or enterprise licenses for cost-effective access to the report.
13. Are there any additional resources or data provided in the Indoor 5G Antenna report?
While the report offers comprehensive insights, it's advisable to review the specific contents or supplementary materials provided to ascertain if additional resources or data are available.
14. How can I stay updated on further developments or reports in the Indoor 5G Antenna?
To stay informed about further developments, trends, and reports in the Indoor 5G Antenna, consider subscribing to industry newsletters, following relevant companies and organizations, or regularly checking reputable industry news sources and publications.
Methodology
Step 1 - Identification of Relevant Samples Size from Population Database


Step 2 - Approaches for Defining Global Market Size (Value, Volume* & Price*)

Note*: In applicable scenarios
Step 3 - Data Sources
Primary Research
- Web Analytics
- Survey Reports
- Research Institute
- Latest Research Reports
- Opinion Leaders
Secondary Research
- Annual Reports
- White Paper
- Latest Press Release
- Industry Association
- Paid Database
- Investor Presentations

Step 4 - Data Triangulation
Involves using different sources of information in order to increase the validity of a study
These sources are likely to be stakeholders in a program - participants, other researchers, program staff, other community members, and so on.
Then we put all data in single framework & apply various statistical tools to find out the dynamic on the market.
During the analysis stage, feedback from the stakeholder groups would be compared to determine areas of agreement as well as areas of divergence