

Key Insights
India's MICE (Meetings, Incentives, Conferences, Exhibitions) tourism sector is poised for substantial expansion, with a projected Compound Annual Growth Rate (CAGR) of 5.2%. This robust growth, estimated to reach 110.3 billion by 2024, is driven by a combination of factors. A strengthening Indian economy and escalating corporate investment in business events are primary catalysts. The adoption of hybrid and virtual event technologies has broadened market accessibility and appeal, engaging both domestic and international attendees. Government support for tourism and infrastructure development further enhances the operational landscape for MICE events. While economic volatility and energy price fluctuations pose potential headwinds, the sector's diverse segments—Meetings, Incentives, Conferences, and Exhibitions—present multifaceted avenues for growth. Regional dynamics are notable, with metropolitan hubs in North and South India anticipated to outpace growth in Eastern and Western regions, reflecting disparities in infrastructure and economic vitality. Leading entities such as Gautam and Gautam Group, Alpcord Network, and Luxury MICE highlight the industry's vibrancy and prospects for consolidation.
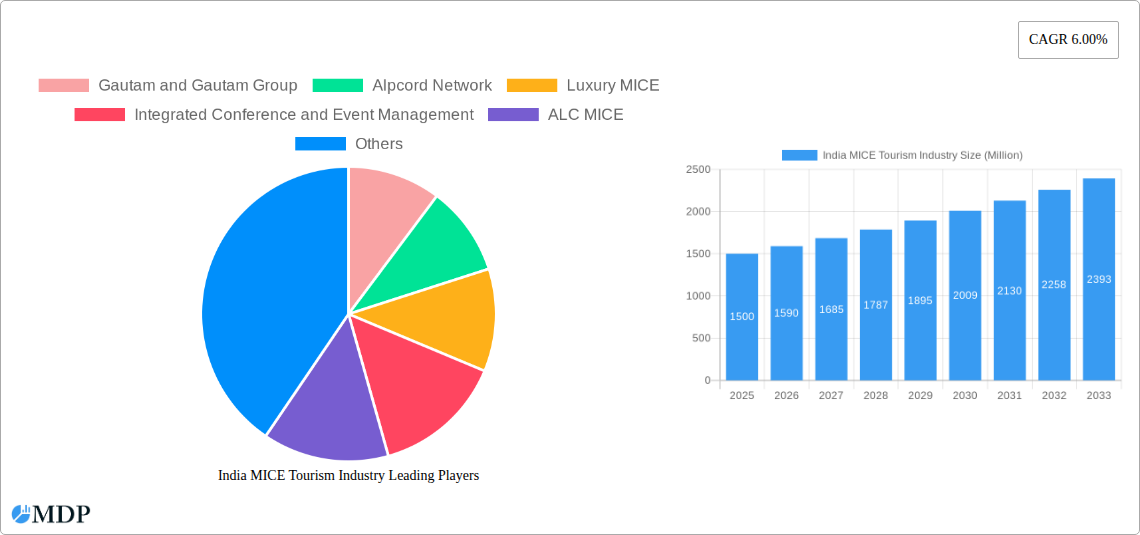
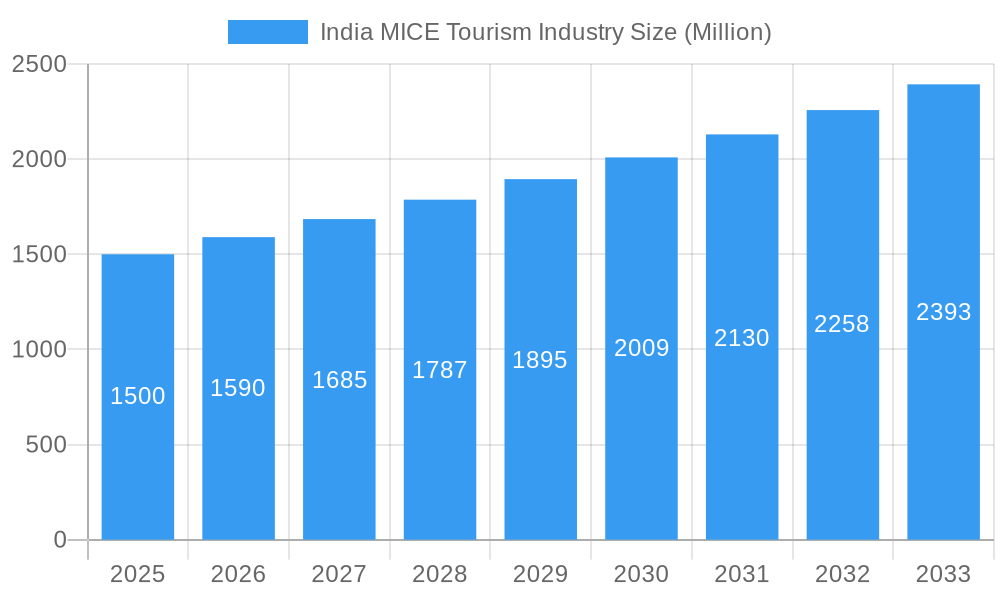
India MICE Tourism Industry Market Size (In Billion)
The Indian MICE tourism market's upward trajectory is underpinned by increased corporate expenditure, supportive government policies, and enhanced infrastructure. The intrinsic diversity of the MICE sector enables tailored growth strategies across its key segments. Despite challenges like economic uncertainties, a positive market outlook prevails, amplified by technological advancements and global business integration. Granular regional segmentation offers precise insights into growth opportunities across India, with major metropolitan centers expected to spearhead expansion. This growth phase presents significant opportunities for both established and emerging players in India's MICE tourism industry. Sustained investment in infrastructure, technology, and strategic marketing initiatives will be crucial in shaping the future of this dynamic sector.
India MICE Tourism Industry Company Market Share
India MICE Tourism Industry Report: 2019-2033
Unlocking the Untapped Potential of India's Thriving MICE Sector: A Comprehensive Market Analysis & Forecast
This comprehensive report provides an in-depth analysis of the India MICE (Meetings, Incentives, Conferences, and Exhibitions) tourism industry, covering the period 2019-2033. We delve into market dynamics, leading players, emerging trends, and future growth projections, offering invaluable insights for industry stakeholders, investors, and policymakers. The report leverages extensive data analysis and expert insights to present a clear picture of this dynamic sector, with a focus on achieving xx Million USD in revenue by 2033. The base year for this analysis is 2025, with forecasts extending to 2033.
India MICE Tourism Industry Market Dynamics & Concentration
The Indian MICE tourism market is experiencing significant growth, driven by factors such as increasing business travel, a burgeoning IT sector, and government initiatives to promote tourism. Market concentration is moderate, with several large players alongside numerous smaller operators. Innovation is primarily driven by technology adoption, including virtual and hybrid event platforms. The regulatory framework, while generally supportive, could benefit from streamlining. Product substitutes, such as virtual meetings, pose a challenge, but the inherent value of in-person networking remains significant. End-user trends show a preference for experiential and sustainable events. M&A activity is moderate, with an estimated xx M&A deals in the historical period (2019-2024), indicating a consolidation trend. Market share is largely fragmented, with no single player commanding a dominant position.
- Market Share (Estimated 2025): Top 5 players hold approximately xx% of the market share.
- M&A Deal Count (2019-2024): xx
- Innovation Drivers: Technological advancements in event management software, virtual reality, and sustainable practices.
- Regulatory Framework: Government initiatives promoting tourism and infrastructure development.
India MICE Tourism Industry Industry Trends & Analysis
The Indian MICE tourism market exhibits a robust growth trajectory, with a projected CAGR of xx% during the forecast period (2025-2033). Several factors fuel this expansion, including the rise of multinational corporations, government incentives to promote business tourism, and the increasing preference for experiential events. Technological disruptions, like the adoption of virtual and hybrid event formats, are transforming the landscape, increasing reach and efficiency but also presenting challenges to traditional in-person events. Consumer preferences are shifting towards personalized, sustainable, and tech-enabled experiences. Competitive dynamics remain intense, with players focusing on differentiation through unique offerings and service quality. Market penetration of MICE tourism services is relatively high in major metropolitan areas, but untapped potential exists in tier-2 and tier-3 cities.
Leading Markets & Segments in India MICE Tourism Industry
The Indian MICE tourism market is geographically diverse, with major metropolitan areas like Mumbai, Delhi, Bangalore, and Hyderabad leading the way. However, government initiatives are actively developing MICE tourism in secondary cities. The "Conferences" segment constitutes the largest share of the market, followed by "Meetings" and "Incentives." Exhibitions hold significant potential, though presently a smaller segment.
Key Drivers for Dominant Regions:
- Mumbai, Delhi, Bangalore, Hyderabad: Strong business presence, well-developed infrastructure, significant air connectivity.
- Agra, Udaipur, Pune, Thiruvananthapuram, Varanasi, Bhubaneswar: Government initiatives to develop MICE infrastructure and promote tourism.
Segment Dominance Analysis: The conference segment benefits from a large number of national and international business events, while the meetings segment is driven by corporate needs. Incentives travel is primarily linked to employee rewards and company milestones.
India MICE Tourism Industry Product Developments
Product innovation is primarily driven by technology, with a focus on virtual and hybrid event platforms, mobile apps for event management, and data analytics for personalized experiences. These developments enhance event efficiency, reach, and attendee engagement. The competitive advantage lies in offering unique and highly customizable solutions that cater to specific client needs, prioritizing sustainability and responsible travel practices.
Key Drivers of India MICE Tourism Industry Growth
The growth of the Indian MICE tourism industry is propelled by a confluence of factors. The expanding IT and business process outsourcing (BPO) sectors contribute significantly, requiring extensive meetings and conferences. Government initiatives, such as the development of MICE hubs and tax benefits, play a crucial role. Furthermore, improvements in infrastructure, including transportation and accommodation, create a more conducive environment for MICE events. The growing preference for experiential tourism and the increasing adoption of technology contribute to the overall positive growth trajectory.
Challenges in the India MICE Tourism Industry Market
The industry faces challenges such as infrastructure limitations in some regions, competition from other tourist destinations, and the need for greater standardization in service quality. Fluctuations in foreign exchange rates and global economic uncertainties can impact international MICE events. Seasonality also presents a challenge; effective marketing and event diversification strategies are essential to minimize its impact.
Emerging Opportunities in India MICE Tourism Industry
The Indian MICE tourism market presents significant long-term growth opportunities. The expansion of domestic and international air connectivity, the development of specialized MICE venues, and the increased emphasis on sustainability present key avenues for growth. Strategic partnerships between government agencies, tourism boards, and private sector operators are crucial to unlock the full potential of the sector. Leveraging technology for enhanced customer engagement and operational efficiency presents another major opportunity.
Leading Players in the India MICE Tourism Industry Sector
- Gautam and Gautam Group
- Alpcord Network
- Luxury MICE
- Integrated Conference and Event Management
- ALC MICE
- ITL World
- India MICE
- Travel XS MICE & More Services
- Dee Catalyst Pvt Ltd
- Plan IT! India
Key Milestones in India MICE Tourism Industry Industry
- June 2021: The Ministry of Tourism identifies six cities (Agra, Udaipur, Pune, Thiruvananthapuram, Varanasi, and Bhubaneswar) for development as MICE destinations. This initiative aims to boost year-round tourism.
- March 2022: The Chief Minister of Karnataka announces the upgradation of Bangalore into a national MICE hub, leveraging its strengths in IT, infrastructure, and air connectivity. This boosts Bangalore's position as a leading MICE destination.
Strategic Outlook for India MICE Tourism Industry Market
The future of the Indian MICE tourism market is bright. Continued investment in infrastructure, technological advancements, and strategic government support will drive significant growth. Focus on sustainable practices, experiential tourism, and specialized niche events will be key to attracting both domestic and international clients. The market exhibits strong potential for significant expansion, positioning itself as a leading player in the global MICE tourism landscape.
India MICE Tourism Industry Segmentation
-
1. Event
- 1.1. Meeting
- 1.2. Incentives
- 1.3. Conference
- 1.4. Exhibitions
India MICE Tourism Industry Segmentation By Geography
- 1. India
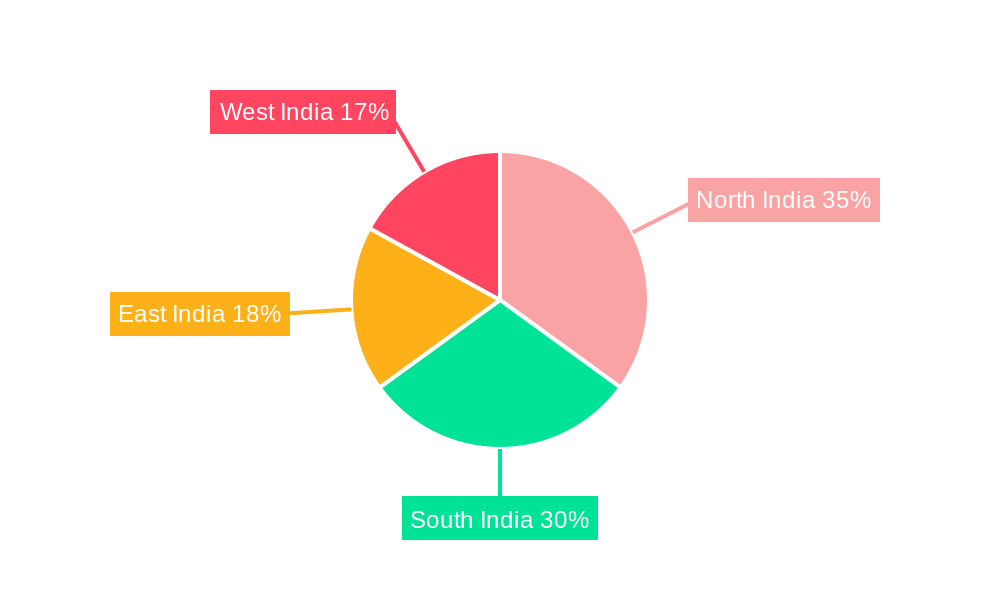
India MICE Tourism Industry Regional Market Share
Geographic Coverage of India MICE Tourism Industry
India MICE Tourism Industry REPORT HIGHLIGHTS
| Aspects | Details |
|---|---|
| Study Period | 2020-2034 |
| Base Year | 2025 |
| Estimated Year | 2026 |
| Forecast Period | 2026-2034 |
| Historical Period | 2020-2025 |
| Growth Rate | CAGR of 5.2% from 2020-2034 |
| Segmentation |
|
Table of Contents
- 1. Introduction
- 1.1. Research Scope
- 1.2. Market Segmentation
- 1.3. Research Objective
- 1.4. Definitions and Assumptions
- 2. Executive Summary
- 2.1. Market Snapshot
- 3. Market Dynamics
- 3.1. Market Drivers
- 3.2. Market Restrains
- 3.3. Market Trends
- 3.4. Market Opportunities
- 4. Market Factor Analysis
- 4.1. Porters Five Forces
- 4.1.1. Bargaining Power of Suppliers
- 4.1.2. Bargaining Power of Buyers
- 4.1.3. Threat of New Entrants
- 4.1.4. Threat of Substitutes
- 4.1.5. Competitive Rivalry
- 4.2. PESTEL analysis
- 4.3. BCG Analysis
- 4.3.1. Stars (High Growth, High Market Share)
- 4.3.2. Cash Cows (Low Growth, High Market Share)
- 4.3.3. Question Mark (High Growth, Low Market Share)
- 4.3.4. Dogs (Low Growth, Low Market Share)
- 4.4. Ansoff Matrix Analysis
- 4.5. Supply Chain Analysis
- 4.6. Regulatory Landscape
- 4.7. Current Market Potential and Opportunity Assessment (TAM–SAM–SOM Framework)
- 4.8. MDP Analyst Note
- 4.1. Porters Five Forces
- 5. Market Analysis, Insights and Forecast 2021-2033
- 5.1. Market Analysis, Insights and Forecast - by Event
- 5.1.1. Meeting
- 5.1.2. Incentives
- 5.1.3. Conference
- 5.1.4. Exhibitions
- 5.2. Market Analysis, Insights and Forecast - by Region
- 5.2.1. India
- 5.1. Market Analysis, Insights and Forecast - by Event
- 6. India MICE Tourism Industry Analysis, Insights and Forecast, 2021-2033
- 6.1. Market Analysis, Insights and Forecast - by Event
- 6.1.1. Meeting
- 6.1.2. Incentives
- 6.1.3. Conference
- 6.1.4. Exhibitions
- 6.1. Market Analysis, Insights and Forecast - by Event
- 7. Competitive Analysis
- 7.1. Company Profiles
- 7.1.1 Gautam and Gautam Group
- 7.1.1.1. Company Overview
- 7.1.1.2. Products
- 7.1.1.3. Company Financials
- 7.1.1.4. SWOT Analysis
- 7.1.2 Alpcord Network
- 7.1.2.1. Company Overview
- 7.1.2.2. Products
- 7.1.2.3. Company Financials
- 7.1.2.4. SWOT Analysis
- 7.1.3 Luxury MICE
- 7.1.3.1. Company Overview
- 7.1.3.2. Products
- 7.1.3.3. Company Financials
- 7.1.3.4. SWOT Analysis
- 7.1.4 Integrated Conference and Event Management
- 7.1.4.1. Company Overview
- 7.1.4.2. Products
- 7.1.4.3. Company Financials
- 7.1.4.4. SWOT Analysis
- 7.1.5 ALC MICE
- 7.1.5.1. Company Overview
- 7.1.5.2. Products
- 7.1.5.3. Company Financials
- 7.1.5.4. SWOT Analysis
- 7.1.6 ITL World
- 7.1.6.1. Company Overview
- 7.1.6.2. Products
- 7.1.6.3. Company Financials
- 7.1.6.4. SWOT Analysis
- 7.1.7 India MICE**List Not Exhaustive
- 7.1.7.1. Company Overview
- 7.1.7.2. Products
- 7.1.7.3. Company Financials
- 7.1.7.4. SWOT Analysis
- 7.1.8 Travel XS MICE & More Services
- 7.1.8.1. Company Overview
- 7.1.8.2. Products
- 7.1.8.3. Company Financials
- 7.1.8.4. SWOT Analysis
- 7.1.9 Dee Catalyst Pvt Ltd
- 7.1.9.1. Company Overview
- 7.1.9.2. Products
- 7.1.9.3. Company Financials
- 7.1.9.4. SWOT Analysis
- 7.1.10 Plan IT! India
- 7.1.10.1. Company Overview
- 7.1.10.2. Products
- 7.1.10.3. Company Financials
- 7.1.10.4. SWOT Analysis
- 7.1.1 Gautam and Gautam Group
- 7.2. Market Entropy
- 7.2.1 Company's Key Areas Served
- 7.2.2 Recent Developments
- 7.3. Company Market Share Analysis 2025
- 7.3.1 Top 5 Companies Market Share Analysis
- 7.3.2 Top 3 Companies Market Share Analysis
- 7.4. List of Potential Customers
- 8. Research Methodology
List of Figures
- Figure 1: India MICE Tourism Industry Revenue Breakdown (billion, %) by Product 2025 & 2033
- Figure 2: India MICE Tourism Industry Share (%) by Company 2025
List of Tables
- Table 1: India MICE Tourism Industry Revenue billion Forecast, by Event 2020 & 2033
- Table 2: India MICE Tourism Industry Revenue billion Forecast, by Region 2020 & 2033
- Table 3: India MICE Tourism Industry Revenue billion Forecast, by Event 2020 & 2033
- Table 4: India MICE Tourism Industry Revenue billion Forecast, by Country 2020 & 2033
Frequently Asked Questions
1. What is the projected Compound Annual Growth Rate (CAGR) of the India MICE Tourism Industry?
The projected CAGR is approximately 5.2%.
2. Which companies are prominent players in the India MICE Tourism Industry?
Key companies in the market include Gautam and Gautam Group, Alpcord Network, Luxury MICE, Integrated Conference and Event Management, ALC MICE, ITL World, India MICE**List Not Exhaustive, Travel XS MICE & More Services, Dee Catalyst Pvt Ltd, Plan IT! India.
3. What are the main segments of the India MICE Tourism Industry?
The market segments include Event.
4. Can you provide details about the market size?
The market size is estimated to be USD 110.3 billion as of 2022.
5. What are some drivers contributing to market growth?
Growing Popularity of Museums. Historical Sites. Zoos and Park is driving the Market Growth; Digitalized Experiences is Driving the Market.
6. What are the notable trends driving market growth?
Then Number of Meeting and Conventions in India is Increasing.
7. Are there any restraints impacting market growth?
Distinct institutional cultures and values; Adapting to the changes in technology is tough for the Institutions.
8. Can you provide examples of recent developments in the market?
In March 2022, Presenting the budget for 2022/23, the Chief Minister of the State announced the up-gradation of Bangalore into a Meeting, Incentive, Conferences, and Exhibitions (MICE) hub of the country by leveraging the city's advantages as a business capital, IT Capital as well as its developed infrastructure in technology, transport, and air connectivity.
9. What pricing options are available for accessing the report?
Pricing options include single-user, multi-user, and enterprise licenses priced at USD 3800, USD 4500, and USD 5800 respectively.
10. Is the market size provided in terms of value or volume?
The market size is provided in terms of value, measured in billion.
11. Are there any specific market keywords associated with the report?
Yes, the market keyword associated with the report is "India MICE Tourism Industry," which aids in identifying and referencing the specific market segment covered.
12. How do I determine which pricing option suits my needs best?
The pricing options vary based on user requirements and access needs. Individual users may opt for single-user licenses, while businesses requiring broader access may choose multi-user or enterprise licenses for cost-effective access to the report.
13. Are there any additional resources or data provided in the India MICE Tourism Industry report?
While the report offers comprehensive insights, it's advisable to review the specific contents or supplementary materials provided to ascertain if additional resources or data are available.
14. How can I stay updated on further developments or reports in the India MICE Tourism Industry?
To stay informed about further developments, trends, and reports in the India MICE Tourism Industry, consider subscribing to industry newsletters, following relevant companies and organizations, or regularly checking reputable industry news sources and publications.
Methodology
Step 1 - Identification of Relevant Samples Size from Population Database


Step 2 - Approaches for Defining Global Market Size (Value, Volume* & Price*)

Note*: In applicable scenarios
Step 3 - Data Sources
Primary Research
- Web Analytics
- Survey Reports
- Research Institute
- Latest Research Reports
- Opinion Leaders
Secondary Research
- Annual Reports
- White Paper
- Latest Press Release
- Industry Association
- Paid Database
- Investor Presentations

Step 4 - Data Triangulation
Involves using different sources of information in order to increase the validity of a study
These sources are likely to be stakeholders in a program - participants, other researchers, program staff, other community members, and so on.
Then we put all data in single framework & apply various statistical tools to find out the dynamic on the market.
During the analysis stage, feedback from the stakeholder groups would be compared to determine areas of agreement as well as areas of divergence